Attached files
| file | filename |
|---|---|
| 8-K - FORM 8-K - STATE STREET CORP | d255422d8k.htm |
| EX-99.2 - APPENDIX: DESCRIPTION OF AND RELATED RECONCILIATIONS FOR OPERATING-BASIS - STATE STREET CORP | d255422dex992.htm |
 1
Joseph L. Hooley
Chairman of the Board, President and
Chief Executive Officer
Bank of America Merrill Lynch Banking
and Financial Services Conference
November 15, 2011
Resilience in a Challenging Environment
Exhibit 99.1 |
 2
Resilience in a Challenging Environment
Agenda
Overview
Business Environment
Widening Our Lead
Summary |
 3
Forward-looking Statements
This
presentation
contains
forward-looking
statements
as
defined
by
United
States
securities
laws,
including
statements
relating
to
our
financial,
operational,
strategic,
commercial,
technological
and
other
goals
and
expectations
regarding
our
Business
Operations
and
Information
Technology
Transformation
program,
as
well
as
regarding
other
goals
and
expectations
for
our
business,
financial
and
capital
condition,
results
of
operations,
operating
margins,
strategies
and
the
business
environment.
Forward-looking
statements
are
often,
but
not
always,
identified
by
such
forward-looking
terminology
as
"plan,"
"expect,"
"look,"
"believe,"
"anticipate,"
"estimate,"
"seek,"
"may,"
"will,"
"trend,"
"target,”
and
"goal,"
or
similar
statements
or
variations
of
such
terms.
These
statements
are
not
guarantees
of
future
performance,
are
inherently
uncertain,
are
based
on
current
assumptions
that
are
difficult
to
predict
and
involve
a
number
of
risks
and
uncertainties.
Therefore,
actual
outcomes
and
results
may
differ
materially
from
what
is
expressed
in
those
statements,
and
those
statements
should
not
be
relied
upon
as
representing
our
expectations
or
beliefs
as
of
any
date
subsequent
to
November
15,
2011.
Important
factors
that
may
affect
future
results
and
outcomes
include,
but
are
not
limited
to:
delays
or
difficulties
in
the
execution
of
our
previously
announced
business
operations
and
information
technology
transformation
program,
which
could
lead
to
changes
in
our
estimates
of
the
charges,
expenses
or
savings
associated
with
the
planned
program,
resulting
in
increased
volatility
of
our
earnings;
our
ability
to
control
operating
risks,
data
security
breach
risks,
information
technology
systems
risks
and
outsourcing
risks,
and
our
ability
to
protect
our
intellectual
property
rights,
the
possibility
of
errors
in
the
quantitative
models
we
use
to
manage
our
business
and
the
possibility
that
our
controls
will
prove
insufficient,
fail
or
be
circumvented;
the
potential
for
new
products
and
services
to
impose
additional
costs
on
us
and
expose
us
to
increased
operational
risk;
the
manner
in
which
the
Federal
Reserve
and
other
regulators
implement
the
Dodd-Frank
Act
and
other
regulatory
initiatives
in
the
U.S.
and
internationally,
including
any
increases
in
the
minimum
regulatory
capital
ratios
applicable
to
us
and
regulatory
developments
that
result
in
changes
to
our
operating
model
or
other
changes
to
the
provision
of
our
services
in
order
to
comply
with
or
respond
to
such
regulations;
required
regulatory
capital
ratios
under
Basel
II
and
Basel
III,
in
each
case
as
fully
implemented
by
State
Street
and
State
Street
Bank
(and
in
the
case
of
Basel
III,
when
finally
adopted
by
the
Federal
Reserve),
which
may
result
in
the
need
for
substantial
additional
capital
or
increased
levels
of
liquidity
in
the
future;
changes
in
law
or
regulation
that
may
adversely
affect
our,
our
clients’
or
our
counterparties’
business
activities
and
the
products
or
services
that
we
sell,
including
additional
or
increased
taxes
or
assessments
thereon,
capital
adequacy
requirements
and
changes
that
expose
us
to
risks
related
to
compliance;
financial
market
disruptions
and
the
economic
recession,
whether
in
the
U.S.
or
internationally;
the
liquidity
of
the
U.S.
and
international
securities
markets,
particularly
the
markets
for
fixed-income
securities,
and
the
liquidity
requirements
of
our
clients;
increases
in
the
volatility
of,
or
declines
in
the
levels
of,
our
net
interest
revenue,
changes
in
the
composition
of
the
assets
on
our
consolidated
balance
sheet
and
the
possibility
that
we
may
be
required
to
change
the
manner
in
which
we
fund
those
assets;
the
financial
strength
and
continuing
viability
of
the
counterparties
with
which
we
or
our
clients
do
business
and
to
which
we
have
investment,
credit
or
financial
exposure;
the
credit
quality,
credit
agency
ratings,
and
fair
values
of
the
securities
in
our
investment
securities
portfolio,
a
deterioration
or
downgrade
of
which
could
lead
to
other-than-temporary
impairment
of
the
respective
securities
and
the
recognition
of
an
impairment
loss
in
our
consolidated
statement
of
income;
the
maintenance
of
credit
agency
ratings
for
our
debt
and
depository
obligations
as
well
as
the
level
of
credibility
of
credit
agency
ratings;
the
results
of,
and
costs
associated
with,
government
investigations,
litigation
and
similar
claims,
disputes,
or
proceedings;
the
risks
that
acquired
businesses
will
not
be
integrated
successfully,
or
that
the
integration
will
take
longer
than
anticipated,
that
expected
synergies
will
not
be
achieved
or
unexpected
disynergies
will
be
experienced,
that
client
and
deposit
retention
goals
will
not
be
met,
that
other
regulatory
or
operational
challenges
will
be
experienced
and
that
disruptions
from
the
transaction
will
harm
relationships
with
clients,
employees
or
regulators;
the
ability
to
complete
acquisitions,
divestitures
and
joint
ventures,
including
the
ability
to
obtain
regulatory
approvals,
the
ability
to
arrange
financing
as
required
and
the
ability
to
satisfy
closing
conditions;
the
performance
of
and
demand
for
the
products
and
services
we
offer,
including
the
level
and
timing
of
redemptions
and
withdrawals
from
our
collateral
pools
and
other
collective
investment
products;
the
possibility
that
our
clients
will
incur
substantial
losses
in
investment
pools
where
we
act
as
agent,
and
the
possibility
of
significant
reductions
in
the
valuation
of
assets;
our
ability
to
attract
deposits
and
other
low-cost,
short-term
funding;
potential
changes
to
the
competitive
environment,
including
changes
due
to
the
effects
of
consolidation,
and
perceptions
of
State
Street
as
a
suitable
service
provider
or
counterparty;
the
level
and
volatility
of
interest
rates
and
the
performance
and
volatility
of
securities,
credit,
currency
and
other
markets
in
the
U.S.
and
internationally;
our
ability
to
measure
the
fair
value
of
the
investment
securities
on
our
consolidated
balance
sheet;
adverse
publicity
or
other
reputational
harm;
our
ability
to
grow
revenue,
attract
and/or
retain
and
compensate
highly
skilled
people,
control
expenses
and
attract
the
capital
necessary
to
achieve
our
business
goals
and
comply
with
regulatory
requirements;
changes
in
accounting
standards
and
practices;
and
changes
in
tax
legislation
and
in
the
interpretation
of
existing
tax
laws
by
U.S.
and
non-U.S.
tax
authorities
that
affect
the
amount
of
taxes
due.
Other
important
factors
that
could
cause
actual
results
to
differ
materially
from
those
indicated
by
any
forward-looking
statements
are
set
forth
in
our
2010
Annual
Report
on
Form
10-K
and
our
subsequent
SEC
filings.
We
encourage
investors
to
read
these
filings,
particularly
the
sections
on
risk
factors,
for
additional
information
with
respect
to
any
forward-looking
statements
and
prior
to
making
any
investment
decision.
The
forward-looking
statements
contained
in
this
presentation
speaks
only
as
of
the
date
hereof,
November
15,
2011,
and
we
do
not
undertake
efforts
to
revise
those
forward-looking
statements
to
reflect
events
after
that
date.
Among
the
initiatives
incorporated
within
Business
Operations
and
Information
Technology
Transformation
program,
we
are
standardizing
several
core
business
and
information
technology
processes,
primarily
through
the
execution
of
Lean
efficiency
principles
and
increased
automation.
We
are
also
creating
a
new
technology
platform,
including
moving
many
core
software
applications
to
a
private
cloud.
In
addition,
we
are
planning
additional
servicing
and
processing
centers
of
excellence
in
globally
distributed
low-cost
locations
to
improve
the
work
allocation
and
responsiveness
of
service
demands
and
have
also
expanded
our
relationships
with
strategic
information
technology
service
providers
to
enhance
efficiencies. |
 4
Overview |
 5
Overview
Key Messages
Focused on Solutions for Institutional Investors
Focused on Solutions for Institutional Investors
Leading Global Market Share and Industry Recognition
Leading Global Market Share and Industry Recognition
Outperforming Key Competitors
Outperforming Key Competitors |
 6
1
Financial
data
presented
on
an
operating
basis.
Operating-basis
information
is
a
non-GAAP
presentation.
For
a
description
of
operating-basis
information
and
related
reconciliations
to
GAAP-basis
information,
see
the
Appendix.
2
12/31/00
–
12/31/10.
Past
performance
is
not
a
guarantee
of
future
results.
Overview
Focused on Solutions for Institutional Investors
•
Fiduciary heritage since 1792
•
Core Business: Managing and Servicing Financial Assets
•
Operating-basis
1
revenue growth of 10% compounded annually
over the 10 years 2000-2010
2
•
AA-
senior debt rating (State Street Bank and Trust Company)
Driving Long-term Shareholder Value |
 7
Overview
Focused on Solutions for Institutional Investors
•
$21.5 trillion
1
in assets under custody
and administration
•
Largest provider of
–
Investment manager
operations
outsourcing
2
–
Alternative
asset
servicing
3
–
Mutual fund custody and accounting
services in the U.S.
4
–
Securities lending
5
•
Trading relationships with 89 of the top 100
global investment managers
Asset
Servicing
–
87%
of
YTD
Revenue
1
Asset
Management
–
13%
of
YTD
Revenue
1
•
$1.9
trillion
6
in
assets
under
management
•
No. 2 worldwide in institutional
asset management
7
•
Investment solutions across the risk /
return spectrum
•
Leader in passive, enhanced and ETFs
POWER OF THE COMBINED FRANCHISE
•
78 of Top 100 Clients Use Both Asset Servicing and Asset Management
•
These 78 Clients Account for about 35% of Total Management Fee Revenue (YTD 2011)
•
State
Street
Provides
Strong
Oversight,
Governance
and
Financial
Strength
1
As
of
9/30/11.
2
Greensted,
Scrip
Issue,
9/11.
3
HFN.net
Q2
2010
HF
Administrator
Survey;
ICFA
Alternative
Fund
Administration
Survey,
May
2011,
The
NASDAQ
Stock
Market,
Inc.
4
Data
Products,
10/1/11.
5
Based
on
company
filings,
9/30/11
6
As
of
September
30,
2011;
AUM
includes
SPDR
®
Gold
Fund
for
which
SSgA
is
not
the
investment
manager
but
acts
as
distribution
agent.
7
P
&
I
12/31/10. |
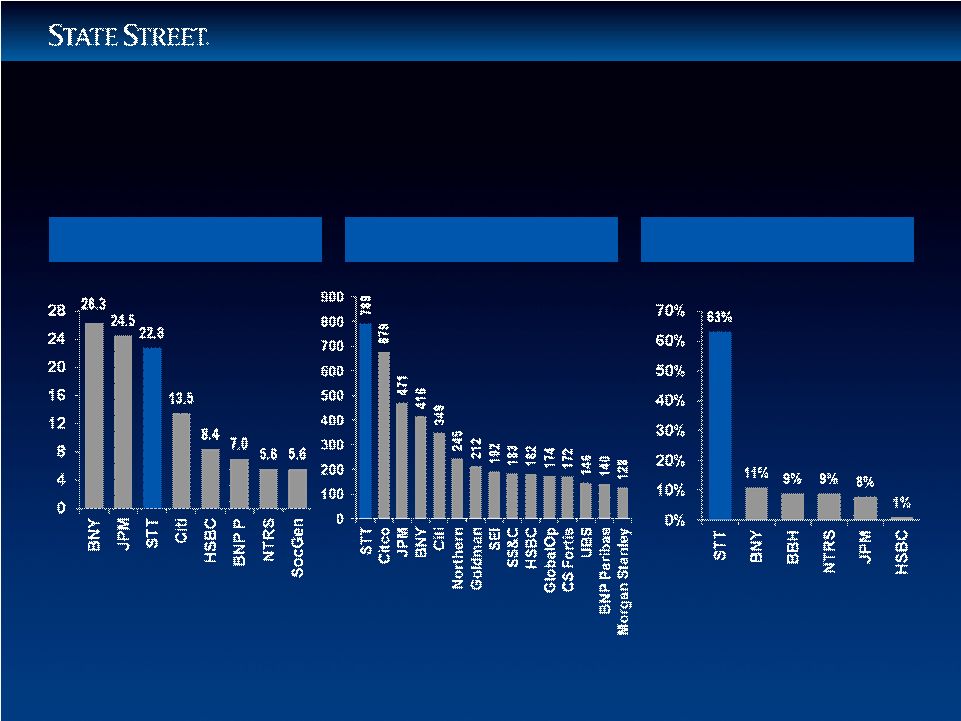 8
% Outsourced Assets
Alternative Assets Under
Administration as of 6/30/11
Source: Greensted Scrip Issue (9/ 2011).
AUA / AUC, $T
Custody Assets Held by
Global Custodians as of 6/30/11
Global Middle Office
Outsourcing as of 6/30/11
Overview
Leading Global Market Share and Industry Recognition
Source: ICFA Annual Fund Admin Survey 2011.
Source: Greensted Scrip Issue (9/2011).
AUA, $B |
 9
AUM, $B
Global Institutional
Assets Managed as of 12/31/10
Average Assets on Loan, $B
Global Securities
Lending as of 9/30/2011
Global ETF
Assets Managed as of 9/30/11
Overview
Leading Global Market Share and Industry Recognition
AUM, $B
Source: Company reports as of 9/30/11 except
BlackRock which is 12/31/10.
Source: Pensions and Investments (5/2011).
SSgA AUM as reported by State Street.
Source: ETF Landscape Report (9/2011).
SSgA AUM as reported by State Street. |
                            10
ETF Manager of the Year
Asia Asset Management
2011 Best of the Best Awards
Outsourcing Provider,
Transfer Agent and Mutual
Fund Administrator of
the Year
International Custody and
Fund Administration
No. 1 in the Americas
Global Investor / isf
2011
Global Custody Survey
Custodian of the Year
2011
European Pensions Awards
World’s Best Bank –
Asset Management
Global Finance
2011 World’s Best Bank Awards
No. 1 Global Custodian
for Institutional Investors
Global Custodian
2010 Global Custody Survey
No. 1 Overall Equity Lender
Global Investor / isf
2011 Equity Lending Survey
Best Liquidity Management
(Currenex)
Profit & Loss
2011 Readers’
Choice Digital
Markets Awards
Best in Securities Lending
The Asset
2011 Triple A Transaction
Banking Awards
Overview
Leading Global Market Share and Industry Recognition |
 11
Overview
Outperforming Key Competitors
1
2011 YTD
STT
BK
NTRS
Pre-tax margin
28.6%
26.2%
25.8%
Return on equity
10.0%
8.0%
9.1%
Net interest margin
1.56%
1.39%
1.26%
Tier 1 common
16.0%
12.5%
11.8%
Tier 1 common (under Basel III)
11.7%
6.5%
11.8%
1
All
data
as
of
9/30/11.
Each
company’s
operating/adjusted
(non-GAAP)
presentation
may
be
calculated
differently
and
therefore
may
not
be
comparable
to
other
companies’
operating/adjusted
(non-GAAP)
presentation.
Please
review
each
company’s
public
filings
and
earnings
reports
for
a
description,
to
the
extent
contained
therein,
of
their
respective
operating/adjusted
presentation.
For
STT,
financial
data
is
presented
on
an
operating
(non-GAAP)
basis,
and
tier
1
common
ratios
include
non-GAAP
data
in
their
calculation
(in
addition
to
Basel
III
ratios
being
made
based
upon
various
estimates).
For
a
description
of
this operating-
basis
presentation,
as
well
as
a
description
of
referenced
ratios
and
related
reconciliations,
see
the
Appendix. |
 12
Jan
Feb
Mar
Apr
May
Jun
Jul
Aug
Sep
Oct
-50%
-40%
-30%
-20%
-10%
0%
10%
20%
YTD 2011 Total Return
Total Returns Significantly Outperformed
Primary Peers and Broader Financials Index
Overview
Outperforming Key Competitors
Bank of New York Mellon Corp.
Northern Trust Corp.
S&P 500 / Financials
State Street Corp.
STT -11.7%
S & P Fin. -14.4%
NTRS -25.6%
BK -28.2%
Source: FactSet |
 13
1/09
4/09
7/09
10/09
1/10
4/10
7/10
10/10
1/11
4/11
7/11
10/11
-80%
-60%
-40%
-20%
0%
20%
40%
3-Year Total Return: 10/31/08-10/31/11
Overview
Outperforming Key Competitors
Bank of New York Mellon Corp.
Northern Trust Corp.
S&P 500 / Financials
State Street Corp.
STT -4.8%
S & P Fin. -8.5%
NTRS -23.1%
BK -32.1%
Source: FactSet
Total Returns Significantly Outperformed
Primary Peers and Broader Financials Index |
 14
14
Business Environment |
 15
Business Environment
Global Headwinds
Higher Capital
Requirements
Rising Cost
of Compliance
and
Regulation
Constrained
Economic
Growth
Low Interest
Rates |
 16
Business Environment
Our Response –
Widening Our Lead
Optimizing
Capital in a
Regulated
Environment
Managing
Risk
Transforming
Operations
and IT
Driving
Growth in
the Core |
 17
Widening Our Lead |
 18
Widening Our Lead
Well Positioned Against Long-term Trends
Globalization
Retirement
Increased Complexity
Alpha / Beta Separation
Regulation and Transparency
Driving
Growth in
the Core |
                   19
YTD
2011
1
$4,340B
Revenues
17,676
Employees
Widening Our Lead
Globalization
YTD
2011
1
$0.537B
Revenues
3,192
Employees
YTD
2011
1
$2,339B
Revenues
8,817
Employees
NORTH AMERICA
EMEA
ASIA PACIFIC
1
As
of
9/30/11.
Financial
data
is
presented
on
an
operating
(non-GAAP)
basis.
For
a
description
of
this
operating-basis
presentation,
and
related
reconciliations,
see
the
Appendix.
Driving
Growth in
the Core
Spanning the Globe with Investment Servicing
and Investment Management |
 20
Widening Our Lead
Globalization –
Expansion through Acquisitions
1
On an operating basis. Operating basis is a non-GAAP presentation.
See Appendix for a description of operating-basis presentation.
Driving
Growth in
the Core
Intesa SanPaolo
Achieved in Aggregate 90% Revenue Retention
All Were Accretive in First Year of Operation¹
Deutsche GSS
MIFA
BIAM |
 21
Widening Our Lead
Globalization
79%
of
New
Revenue
Growth
Comes
From
Existing
Clients
1
1
9 months ended 9/30/11, compared to 9 months ended 9/30/10.
Driving
Growth in
the Core
Average Number of Products Used
Average Length of Relationship
Top 100 Clients
14.1 Products
20.1 Years
Top 1,000 Clients
8.4 Products
11.1 Years |
 22
Investment
Servicing
•
Positioned as market
leader in servicing
solutions for pension
funds
•
Advanced performance
and analytics capabilities
Investment
Management
•
Investment management
solutions for DB and DC
–
Portfolio Solutions
–
Target-date funds
–
Liability-driven
Investing
–
Alternative Strategies
to support allocations
to this asset class
Widening Our Lead
Retirement
Opportunity
•
44% of total assets in retirement plans
globally are now in Defined Contribution
(DC) plans, up from 35% in 2000
1,2
•
DC assets have grown at 7.5% annually
since 2000, approximately 2.5 times
faster than the rate of growth in DB
assets
1,2
•
Pension-plan allocation to alternative
assets has grown to 19% of total assets
from 7% over the last 10 years
1,2
1
As of 12/31/10. 2 Towers Watson, Global Pension Asset Study 2011,
2/2011. Driving
Growth in
the Core |
 23
Widening Our Lead
Increased Complexity
Opportunity
•
Increased product sophistication driving
need for global solutions
•
Increased IT / Operational investment
requirements; market for middle-office
outsourcing set to grow in next three
years
from
about
20%
to
35%
1
•
Increased regulatory requirements
Investment
Servicing
•
No. 1 middle office
administrator globally
with
63%
market
share
2
with
$7.9TN
in
AUA
3
•
Investment in end-to-
end solutions to support
emerging regulatory
changes in OTC
derivatives
Investment
Management
•
Providing strategic
multi-asset solutions
for clients
•
Providing strategic
component parts to
other asset managers to
meet their client needs
1
BCG
Global
Asset
Management
and
Building
on
Success,
2011;
Greensted
Scrip
Issue,
9/2011.
2
Greensted,
Scrip
Issue,
9/2011.
3
As
of
9/30/11.
Driving
Growth in
the Core |
 24
Widening Our Lead
Investing for Growth –
Alpha / Beta Separation
•
Growth opportunities exist in both beta
and alternatives
•
ETF
assets
growing
at
15%
per
annum
1
•
Hedge fund assets expected to grow
with
a
12%
CAGR
from
2011-2014
1
•
Private equity market expected to grow
at
6%
CAGR
from
2011-2014
1
Opportunity
Investment
Servicing
•
No.
1
ETF
servicer
2
•
No. 1 in alternative
investment
servicing
3
Investment
Management
•
SPY and GLD No. 1 and
No. 2, respectively, of
world’s
largest
ETFs
4
•
No. 2 of global passive
management
assets
5
•
Delivering alpha in
quantitative,
fundamental and
alternative strategies
1
BCG
Global
Asset
Management
Building
on
Success
(2011).
2
STT
estimates
based
on
market
size
as
of
10/2011.
3
HFN.net
Q4
2010
HF
Administrator
Survey;
ICFA
Alternative
Fund
Administration
Survey,
5/2011.
4
Bloomberg,10/2011.
5
P
&
I,
5/2011.
Driving
Growth in
the Core |
 25
Goals
•
Position the company for accelerated growth
•
Achieve estimated annual pre-tax run-rate expense savings of
$575MN to $625MN by the end of 2014 for full effect in 2015
•
Achieve, by the end of 2015, a 400bp improvement in
operating-basis pre-tax margin, compared to 2010 operating-
basis
pre-tax
margin,
assuming
all
else
being
equal
2
Widening Our Lead
Program
Overview
1
1
Estimated
annual
pre-tax,
run-rate
expense
savings
and
operating-basis
pre-tax
margin
improvement
relate
only
to
the
Business
Operations
and
Information
Technology
Transformation
program;
actual
operating
expenses
and
operating
margin
of
the
Company
may
increase
or
decrease
due
to
other
factors.
2
Includes
operating-basis
information.
Operating-basis
information
is
a
non-GAAP
presentation.
See
Appendix
for
a
description
of
operating-basis
information.
Transforming
Operations
and IT |
 26
Widening Our Lead
Operations Plan
14 Core Business
14 Core Business
Operations
Operations
Processes are
Processes are
in Scope
in Scope
2012 Milestones
•
Four key operations
transformation levers
–
Process
transformation
–
Automation
–
Consolidation
–
Workforce
optimization
•
Operations
transformation
portfolio includes
160+ initiatives
•
Initiatives have
been sequenced
into master plan
through 2014
•
Establish two additional
global Centers of
Excellence for a total of
seven overall
•
Achieve 20% targeted
automation benefits
•
Establish two new
low-cost locations
to balance our
global footprint
Transforming
Operations
and IT |
 27
Widening Our Lead
IT Plan
Private
Cloud
Industrial-strength
Application Development
Key Program Benefits
Proprietary Real-time
Information
•
Automation /
capacity on demand
•
Accelerated time
to market
•
Integrated security
environment
•
Real-time data
infrastructure
•
Advanced platform
for product
innovation
•
Strengthened
client service
Transforming
Operations
and IT
2012 Milestones
•
Scale cloud computing
platform to enable
major migrations in
2013 and 2014
•
Realize 20% of the
expected benefits from
our IT application
portfolio rationalization
•
Substantially complete
transition to previously
announced strategic
servicing relationships |
 28
Widening Our Lead
Estimated Annual, Pre-tax, Run-rate Expense Savings
$MN
2011
2012
2013
2014
2015
Business Operations Transformation
$150
$250
$370
$430
$440
Information Technology
Transformation
5
20
90
150
160
Net Benefits Before Non-recurring
Project-related Expenses
155
270
460
580
600
Less: Non-recurring
Project-related Expenses
75
100
70
40
0
Annual Pre-tax, Run-rate
Expense Savings
$80
$170
$390
$540
$600
1
The
full
effect
of
the
annual
pre-tax,
run-rate
savings
is
not
expected
to
be
experienced
until
2015.
Chart
data
based
on
the
approximate
mid-point
of
the
range
of
the
estimated
annual
pre-tax,
run-rate
expense
savings
of
$575MN-$625MN
at
the
end
of
2014,
for
full
effect
in
2015;
estimated
savings
for
individual
years
may
vary
up
or
down
based
on
the
execution
of
the
Business
Operations
and
Information
Technology
Transformation
program.
Annual
pre-tax,
run-rate
expense
savings
relate
only
to
the
Business
Operations
and
Information
Technology
Transformation
program;
actual
operating
expenses
of
the
Company
may
increase
or
decrease
due
to
other
factors.
Transforming
Operations
and IT |
 29
Widening Our Lead
Strong Enterprise-wide Governance
Culture
Values
Alignment
Governance
Risk Management Objectives
Embedded into Business Unit
and Individual Goals
Managing
Risk
Overarching Structure Sets
Risk Appetite and Risk
Policies Globally
•
Dedicated Risk Teams in All Business and Geographies
•
Comprehensive Stress and Scenario Testing
•
Deep Expertise in Credit, Market and Operational Risk
•
Risk Exposures Monitored and Measured Globally
Execution |
 30
Widening Our Lead
Strong Ratios
State Street Corporation
“Well
Capitalized”¹
9/30/11
Actual under Basel I
9/30/11
Adjusted to Reflect
Basel
III
Proposal
5
Tier 1 leverage
5.0%²
7.8%
6.0%
Tier 1 capital
6.0%
17.9%
12.8%
Tier
1
common
ratio³
----
16.0%
11.7%
Total capital
10.0%
19.5%
14.4%
Tangible
common
equity
4
----
7.0%
7.0%
Optimizing
Capital in a
Regulated
Environment
1
Except as noted in note 4 below, minimum “Well Capitalized” as defined by Federal regulators
under Basel I.
2 Minimum “Well Capitalized,” as defined by Federal regulators, applies to State
Street Bank and Trust only and therefore stated only as a reference point.
3 The tier 1 common ratio is not required by GAAP or on a recurring basis by bank
regulations. See Appendix for a description of this ratio and related reconciliations.
4 As defined by State Street. The Tangible Common Equity ratio is not required by GAAP or
by bank regulations. See Appendix for a description of this ratio and related reconciliations. 5 Calculated
based on State Street’s estimates, based upon published statements of the Basel Committee and the Federal Reserve, of the effects of the requirements under Basel III
affecting capital. See Appendix for a description of the specified capital ratios and related
reconciliations of these ratios to ratios calculated under presently applicable requirements.
|
 31
Widening Our Lead
Performance in 2011
Capital
Deployment to
Shareholders
•
Median payout ratio for those banks that participated in the
CCAR stress test and were able to increase dividends and
repurchase
shares
was
58.6%
of
consensus
earnings
1
•
Median payout ratio for all banks that were allowed to return
capital in some form to shareholders was about 19.8% of
consensus
earnings
1
1 Percentages represent the payout ratios calculated on the March 1, 2011
consensus IBES estimates for 2011 operating-basis earnings. 2 Percentages
represent the payout ratios calculated on the March 1, 2011 consensus First Call
estimates for 2011 operating-basis earnings. Optimizing
Capital in a
Regulated
Environment
•
Increased
quarterly
dividend
to
$0.18
per
share
(~
20%
of
consensus
earnings)
2
•
Board
authorized
a
share
repurchase
of
$675
million
(~
37%
of
consensus
earnings)
2 |
 32
Widening Our Lead
Philosophy
Share
Buybacks
•
Expect to request in January 2012 a share purchase plan in
keeping with the limits imposed by the Federal Reserve
Dividend
•
Expect to target a 20%-25% payout ratio
Acquisitions
•
Intend to be opportunistic; Pressure on European banks may
accelerate prospects
•
Rigorous financial analysis and hurdle rates must be achieved
Committed to Returning Capital to Shareholders
Optimizing
Capital in a
Regulated
Environment |
 33
Summary |
 34
Optimizing
Capital in a
Regulated
Environment
Managing
Risk
Transforming
Operations
and IT
Driving
Growth in
the Core
Summary
No. 1 or No. 2 Position
in Key Growth Markets
Financial Results
Outperforming Peers
Most Diversified
Global Footprint
Strongest Capital of
Peer Group
Driving Long-term Shareholder Value |
 35 |
 36 |
 37
Appendix
Operating-basis (Non-GAAP) Financial Measures
This
presentation
includes
financial
information
presented
on
an
operating
basis.
Operating-basis
financial
information
is
a
non-GAAP
presentation.
Management
measures
and
compares
certain
financial
information
on
an
operating
basis,
as
it
believes
that
this
presentation
supports
meaningful
comparisons
from
period
to
period
and
the
analysis
of
comparable
financial
trends
with
respect
to
State
Street’s
normal
ongoing
business
operations.
Management
believes
that
operating-basis
financial
information,
which
reports
revenue
from
non-taxable
sources
on
a
fully
taxable-equivalent
basis
and
excludes
the
impact
of
revenue
and
expenses
outside
of
the
normal
course
of
business,
facilitates
an
investor’s
understanding
and
analysis
of
State
Street’s
underlying
financial
performance
and
trends
in
addition
to
financial
information
prepared
and
reported
in
accordance
with
GAAP.
Non-GAAP
financial
measures
should
be
considered
in
addition
to,
not
as
substitute
for
or
superior
to,
financial
measures
determined
in
accordance
with
GAAP. |