Attached files
| file | filename |
|---|---|
| 8-K - FORM 8-K - Nationstar Mortgage LLC | y05329e8vk.htm |
Exhibit 99.1
| Nationstar Mortgage LLC Quarterly Financial Review - Q3 2011November 16, 2011 |
| Forward Looking Statements This presentation contains forward-looking statements within the meaning of the U.S. federal securities laws. Forward-looking statements include, without limitation, statements concerning plans, objectives, goals, projections, strategies, future events or performance, and underlying assumptions and other statements, which are not statements of historical facts. When used in this discussion, the words "anticipate," "appears," "foresee," "intend," "should," "expect," "estimate," "project," "plan," "may," "could," "will," "are likely" and similar expressions are intended to identify forward-looking statements. These statements involve predictions of our future financial condition, performance, plans and strategies, and are thus dependent on a number of factors including, without limitation, assumptions and data that may be imprecise or incorrect. Specific factors that may impact performance or other predictions of future actions have, in many but not all cases, been identified in connection with specific forward-looking statements. Forward-looking statements are subject to risks and uncertainties. We caution you not to place undue reliance on these forward-looking statements that speak only as of the date they were made. We do not undertake any obligation to publicly release any revisions to these forward-looking statements to reflect events or circumstances after the date of this presentation or to reflect the occurrence of unanticipated events. All information in this presentation is qualified by, and should be considered in connection with the information contained in our Form S-4 Registration Statement under the Securities Act of 1933 filed with the Securities and Exchange Commission (SEC) on August 11, 2011, and our Quarterly Report on Form 10-Q filed with the SEC on November 14, 2011, and any other public filings, including the "Risk Factors" contained therein. |
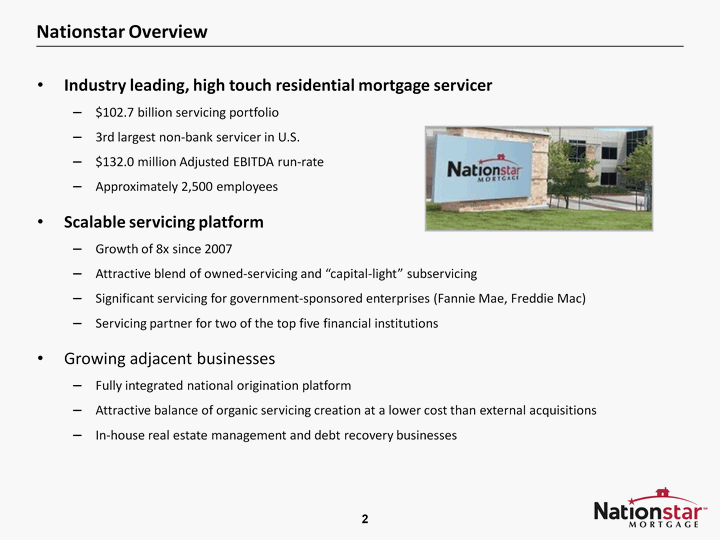
| Nationstar Overview Industry leading, high touch residential mortgage servicer $102.7 billion servicing portfolio3rd largest non-bank servicer in U.S.$132.0 million Adjusted EBITDA run-rateApproximately 2,500 employees Scalable servicing platform Growth of 8x since 2007Attractive blend of owned-servicing and "capital-light" subservicingSignificant servicing for government-sponsored enterprises (Fannie Mae, Freddie Mac)Servicing partner for two of the top five financial institutionsGrowing adjacent businessesFully integrated na tional origination platformAttractive balance of organic servicing creation at a lower cost than external acquisitionsIn-house real estate management and debt recovery businesses |

| Business Highlights |
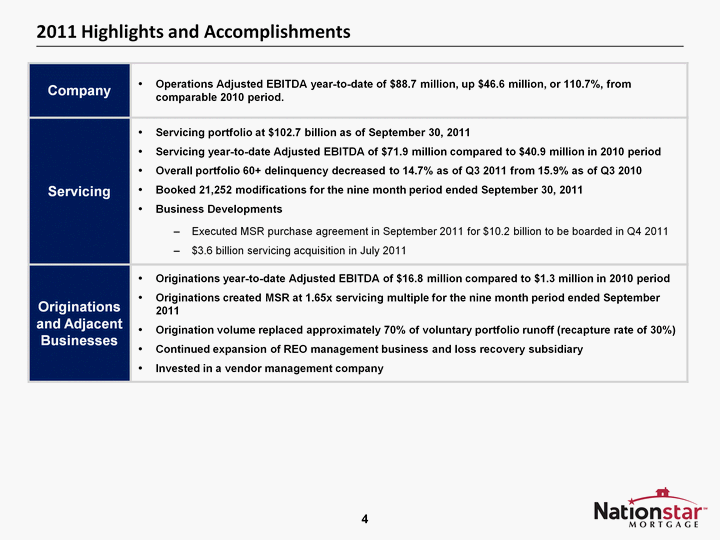
| Company Operations Adjusted EBITDA year-to-date of $88.7 million, up $46.6 million, or 110.7%, from comparable 2010 period. Servicing Servicing portfolio at $102.7 billion as of September 30, 2011 Servicing year-to-date Adjusted EBITDA of $71.9 million compared to $40.9 million in 2010 period Overall portfolio 60+ delinquency decreased to 14.7% as of Q3 2011 from 15.9% as of Q3 2010 Booked 21,252 modifications for the nine month period ended September 30, 2011 Business Developments Executed MSR purchase agreement in September 2011 for $10.2 billion to be boarded in Q4 2011 $3.6 billion servicing acquisition in July 2011 Originations and Adjacent Businesses Originations year-to-date Adjusted EBITDA of $16.8 million compared to $1.3 million in 2010 period Originations created MSR at 1.65x servicing multiple for the nine month period ended September 2011 Origination volume replaced approximately 70% of voluntary portfolio runoff (recapture rate of 30%) Continued expansion of REO management business and loss recovery subsidiary Invested in a vendor management company 2011 Highlights and Accomplishments |
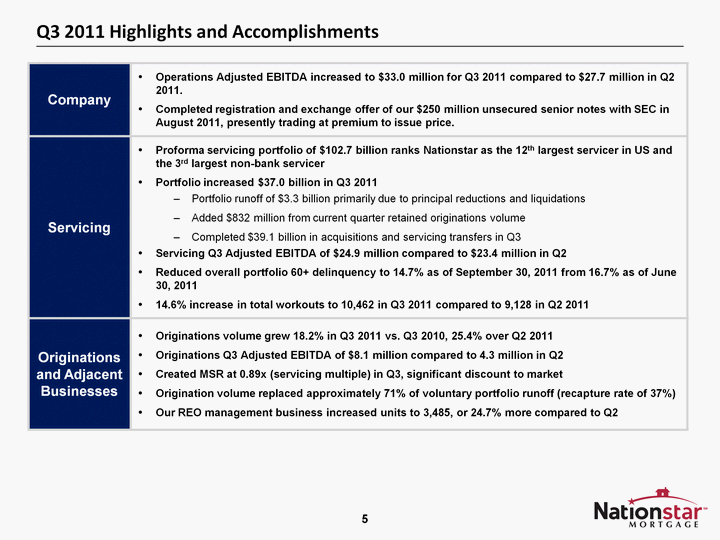
| Company Operations Adjusted EBITDA increased to $33.0 million for Q3 2011 compared to $27.7 million in Q2 2011. Completed registration and exchange offer of our $250 million unsecured senior notes with SEC in August 2011, presently trading at premium to issue price. Servicing Proforma servicing portfolio of $102.7 billion ranks Nationstar as the 12th largest servicer in US and the 3rd largest non-bank servicer Portfolio increased $37.0 billion in Q3 2011 Portfolio runoff of $3.3 billion primarily due to principal reductions and liquidations Added $832 million from current quarter retained originations volume Completed $39.1 billion in acquisitions and servicing transfers in Q3 Servicing Q3 Adjusted EBITDA of $24.9 million compared to $23.4 million in Q2 Reduced overall portfolio 60+ delinquency to 14.7% as of September 30, 2011 from 16.7% as of June 30, 2011 14.6% increase in total workouts to 10,462 in Q3 2011 compared to 9,128 in Q2 2011 Originations and Adjacent Businesses Originations volume grew 18.2% in Q3 2011 vs. Q3 2010, 25.4% over Q2 2011 Originations Q3 Adjusted EBITDA of $8.1 million compared to 4.3 million in Q2 Created MSR at 0.89x (servicing multiple) in Q3, significant discount to market Origination volume replaced approximately 71% of voluntary portfolio runoff (recapture rate of 37%) Our REO management business increased units to 3,485, or 24.7% more compared to Q2 Q3 2011 Highlights and Accomplishments |
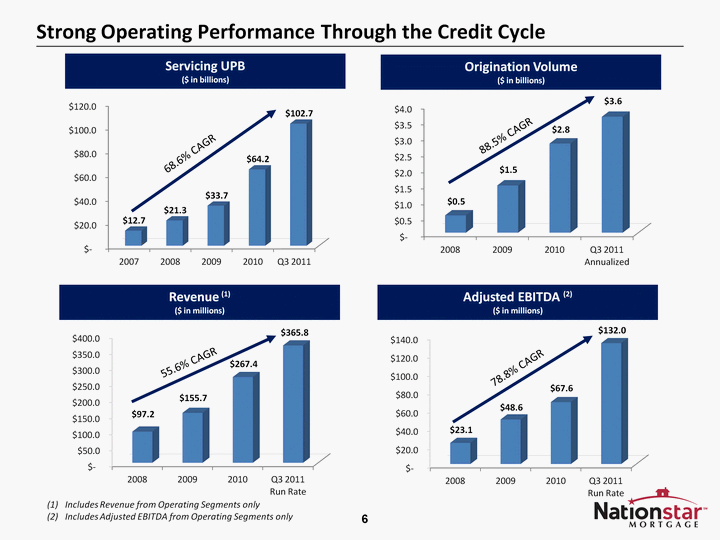
| (CHART) (CHART) (CHART) (CHART) Strong Operating Performance Through the Credit Cycle Servicing UPB ($ in billions) Origination Volume ($ in billions) Revenue (1) ($ in millions) Adjusted EBITDA (2) ($ in millions) Includes Revenue from Operating Segments onlyIncludes Adjusted EBITDA from Operating Segments only 68.6% CAGR 88.5% CAGR 55.6% CAGR 78.8% CAGR |
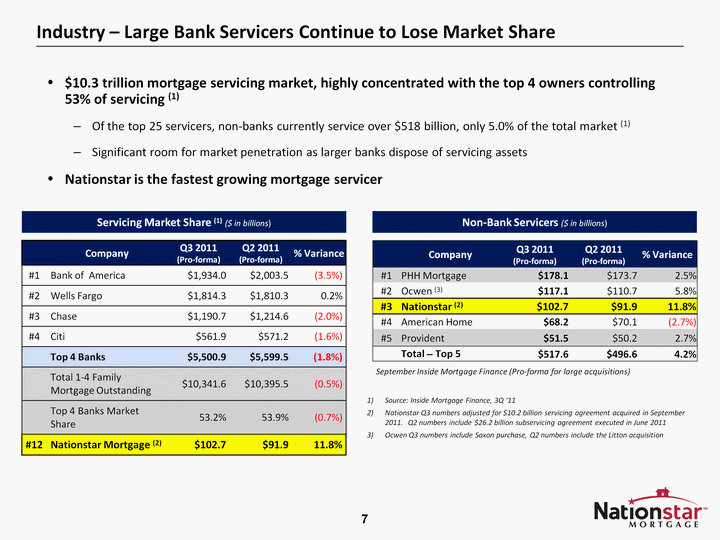
| Industry - Large Bank Servicers Continue to Lose Market Share $10.3 trillion mortgage servicing market, highly concentrated with the top 4 owners controlling 53% of servicing (1)Of the top 25 servicers, non-banks currently service over $518 billion, only 5.0% of the total market (1)Significant room for market penetration as larger banks dispose of servicing assetsNationstar is the fastest growing mortgage servicer Servicing Market Share (1) ($ in billions) Company Q3 2011 (Pro-forma) Q2 2011 (Pro-forma) % Variance #1 PHH Mortgage $178.1 $173.7 2.5% #2 Ocwen (3) $117.1 $110.7 5.8% #3 Nationstar (2) $102.7 $91.9 11.8% #4 American Home $68.2 $70.1 (2.7%) #5 Provident $51.5 $50.2 2.7% Total - Top 5 $517.6 $496.6 4.2% Source: Inside Mortgage Finance, 3Q '11Nationstar Q3 numbers adjusted for $10.2 billion servicing agreement acquired in September 2011. Q2 numbers include $26.2 billion subservicing agreement executed in June 2011Ocwen Q3 numbers include Saxon purchase, Q2 numbers include the Litton acquisition Company Q3 2011 (Pro-forma) Q2 2011 (Pro-forma) % Variance #1 Bank of America $1,934.0 $2,003.5 (3.5%) #2 Wells Fargo $1,814.3 $1,810.3 0.2% #3 Chase $1,190.7 $1,214.6 (2.0%) #4 Citi $561.9 $571.2 (1.6%) Top 4 Banks $5,500.9 $5,599.5 (1.8%) Total 1-4 Family Mortgage Outstanding $10,341.6 $10,395.5 (0.5%) Top 4 Banks Market Share 53.2% 53.9% (0.7%) #12 Nationstar Mortgage (2) $102.7 $91.9 11.8% September Inside Mortgage Finance (Pro-forma for large acquisitions) Non-Bank Servicers ($ in billions) |
| Operations Overview |
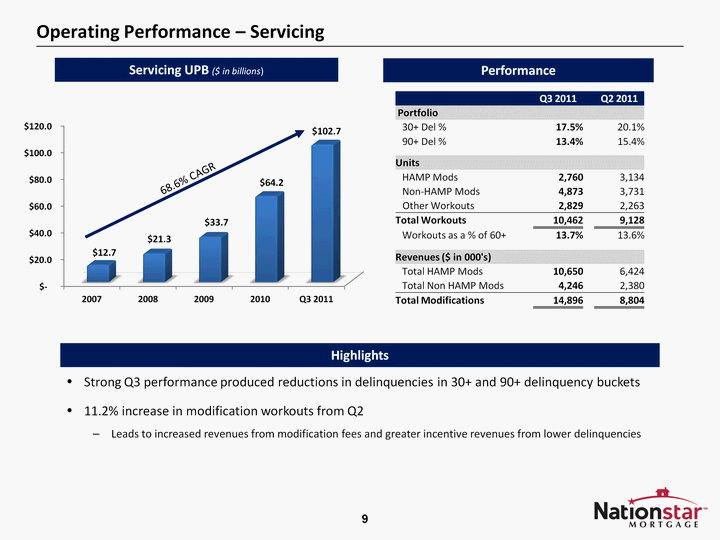
| Operating Performance - Servicing Performance Servicing UPB ($ in billions) Highlights Strong Q3 performance produced reductions in delinquencies in 30+ and 90+ delinquency buckets11.2% increase in modification workouts from Q2Leads to increased revenues from modification fees and greater incentive revenues from lower delinquencies(CHART) Q3 2011 Q2 2011 Portfolio 30+ Del % 17.5% 20.1% 90+ Del % 13.4% 15.4% Units HAMP Mods 2,760 3,134 Non-HAMP Mods 4,873 3,731 Other Workouts 2,829 2,263 Total Workouts 10,462 9,128 Workouts as a % of 60+ 13.7% 13.6% Revenues ($ in 000's) Total HAMP Mods 10,650 6,424 Total Non HAMP Mods 4,246 2,380 Total Modifications 14,896 8,804 68.6% CAGR |
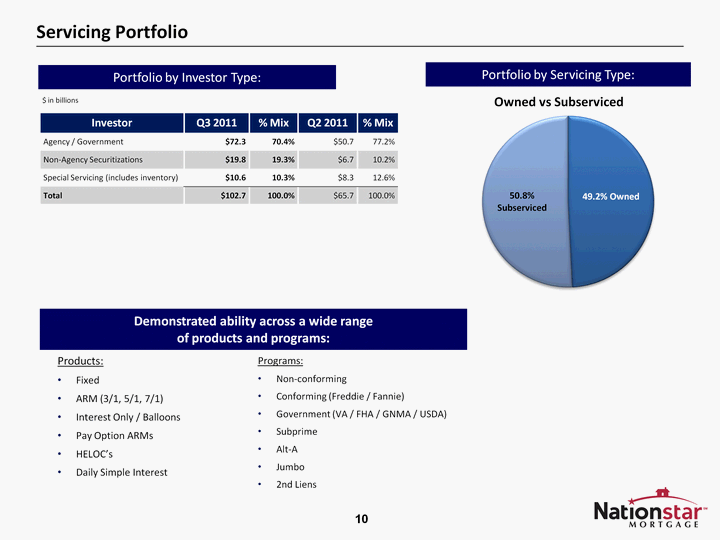
| (CHART) Servicing Portfolio Demonstrated ability across a wide range of products and programs: Products:FixedARM (3/1, 5/1, 7/1)Interest Only / BalloonsPay Option ARMsHELOC'sDaily Simple Interest Programs:Non-conformingConforming (Freddie / Fannie)Government (VA / FHA / GNMA / USDA)SubprimeAlt-AJumbo2nd Liens $ in billions Investor Q3 2011 % Mix Q2 2011 % Mix Agency / Government $72.3 70.4% $50.7 77.2% Non-Agency Securitizations $19.8 19.3% $6.7 10.2% Special Servicing (includes inventory) $10.6 10.3% $8.3 12.6% Total $102.7 100.0% $65.7 100.0% Portfolio by Investor Type: Portfolio by Servicing Type: |
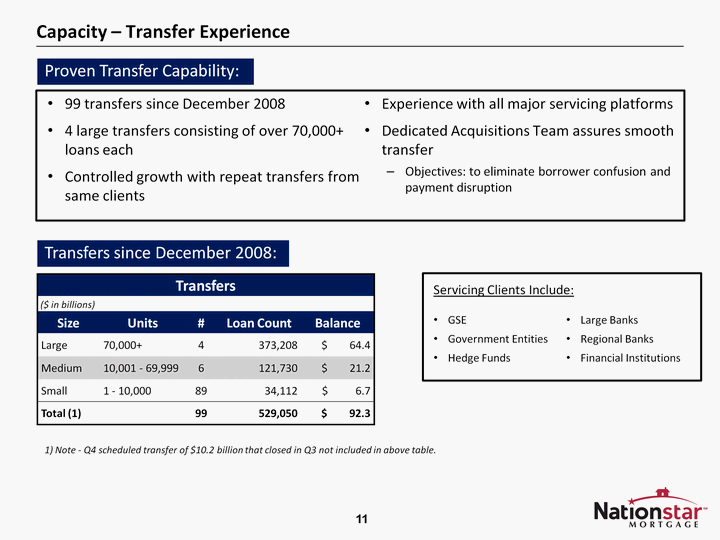
| 99 transfers since December 20084 large transfers consisting of over 70,000+ loans eachControlled growth with repeat transfers from same clientsExperience with all major servicing platformsDedicated Acquisitions Team assures smooth transferObjectives: to eliminate borrower confusion and payment disruption Transfers since December 2008: Capacity - Transfer Experience Transfers Transfers Transfers Transfers Transfers ($ in billions) ($ in billions) Size Units # Loan Count Balance Large 70,000+ 4 373,208 $ 64.4 Medium 10,001 - 69,999 6 121,730 $ 21.2 Small 1 - 10,000 89 34,112 $ 6.7 Total (1) 99 529,050 $ 92.3 1) Note - Q4 scheduled transfer of $10.2 billion that closed in Q3 not included in above table. Proven Transfer Capability: GSEGovernment EntitiesHedge FundsLarge BanksRegional BanksFinancial Institutions Servicing Clients Include: |
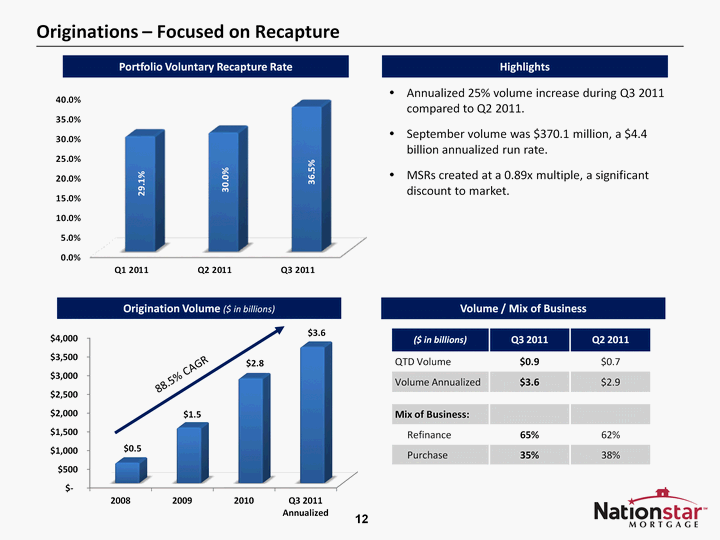
| (CHART) Originations - Focused on Recapture Origination Volume ($ in billions) Volume / Mix of Business Highlights Annualized 25% volume increase during Q3 2011 compared to Q2 2011.September volume was $370.1 million, a $4.4 billion annualized run rate.MSRs created at a 0.89x multiple, a significant discount to market. 88.5% CAGR ($ in billions) Q3 2011 Q2 2011 QTD Volume $0.9 $0.7 Volume Annualized $3.6 $2.9 Mix of Business: Refinance 65% 62% Purchase 35% 38% Portfolio Voluntary Recapture Rate |

| Financial Update |
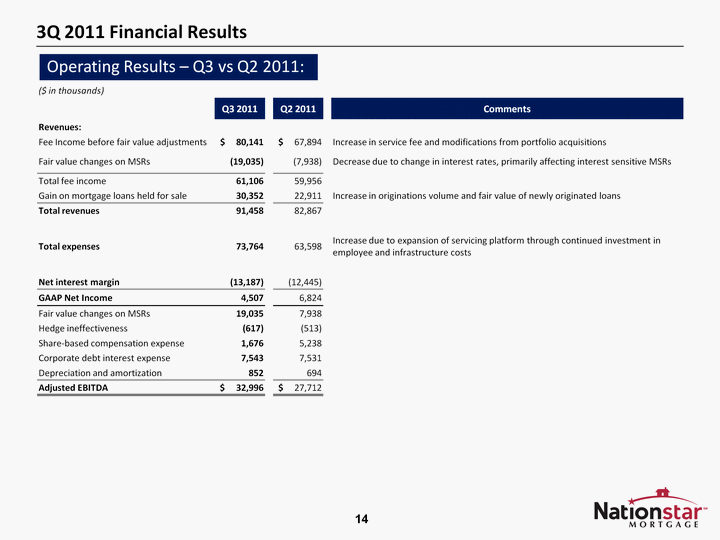
| 3Q 2011 Financial Results ($ in thousands) Q3 2011 Q2 2011 Comments Revenues: Fee Income before fair value adjustments $ 80,141 $ 67,894 Increase in service fee and modifications from portfolio acquisitions Fair value changes on MSRs (19,035) (7,938) Decrease due to change in interest rates, primarily affecting interest sensitive MSRs Total fee income 61,106 59,956 Gain on mortgage loans held for sale 30,352 22,911 Increase in originations volume and fair value of newly originated loans Total revenues 91,458 82,867 Total expenses 73,764 63,598 Increase due to expansion of servicing platform through continued investment in employee and infrastructure costs Net interest margin (13,187) (12,445) GAAP Net Income 4,507 6,824 Fair value changes on MSRs 19,035 7,938 Hedge ineffectiveness (617) (513) Share-based compensation expense 1,676 5,238 Corporate debt interest expense 7,543 7,531 Depreciation and amortization 852 694 Adjusted EBITDA $ 32,996 $ 27,712 Operating Results - Q3 vs Q2 2011: |
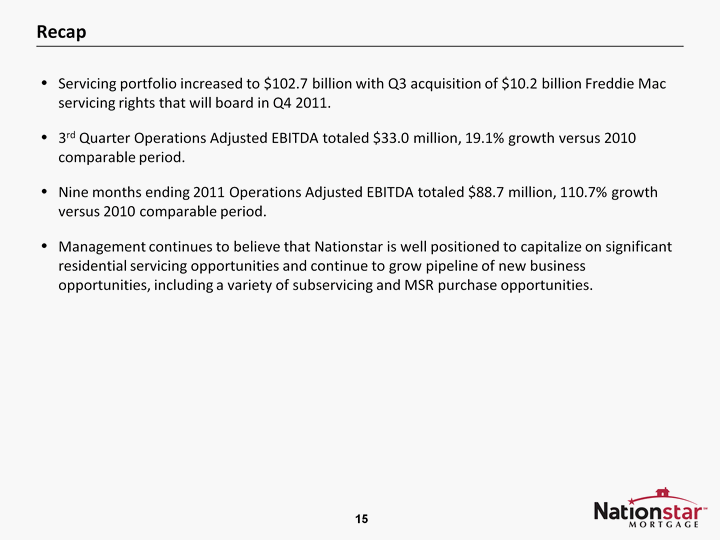
| Recap Servicing portfolio increased to $102.7 billion with Q3 acquisition of $10.2 billion Freddie Mac servicing rights that will board in Q4 2011.3rd Quarter Operations Adjusted EBITDA totaled $33.0 million, 19.1% growth versus 2010 comparable period. Nine months ending 2011 Operations Adjusted EBITDA totaled $88.7 million, 110.7% growth versus 2010 comparable period. Management continues to believe that Nationstar is well positioned to capitalize on significant residential servicing opportunities and continue to grow pipeline of new business opportunities, including a variety of subservicing and MSR purchase opportunities. |
| Appendix |
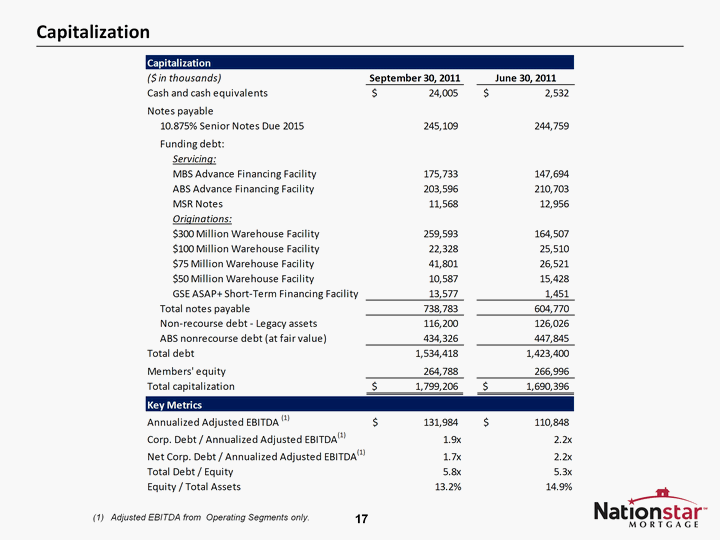
| Capitalization Adjusted EBITDA from Operating Segments only. |
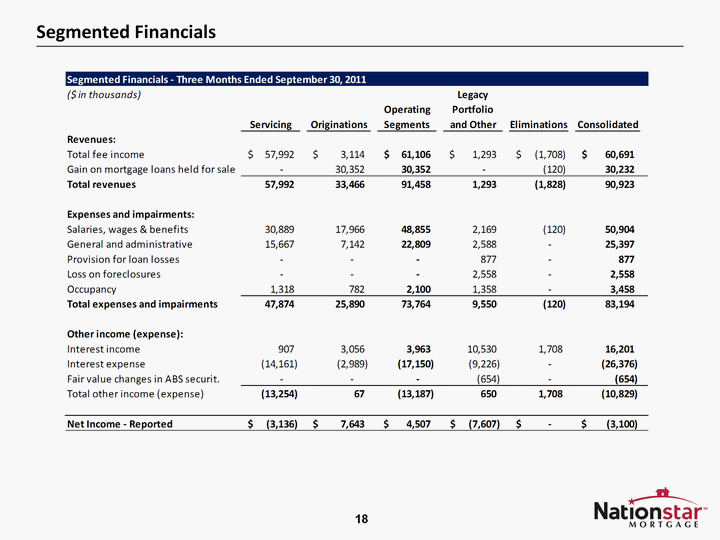
| Segmented Financials |
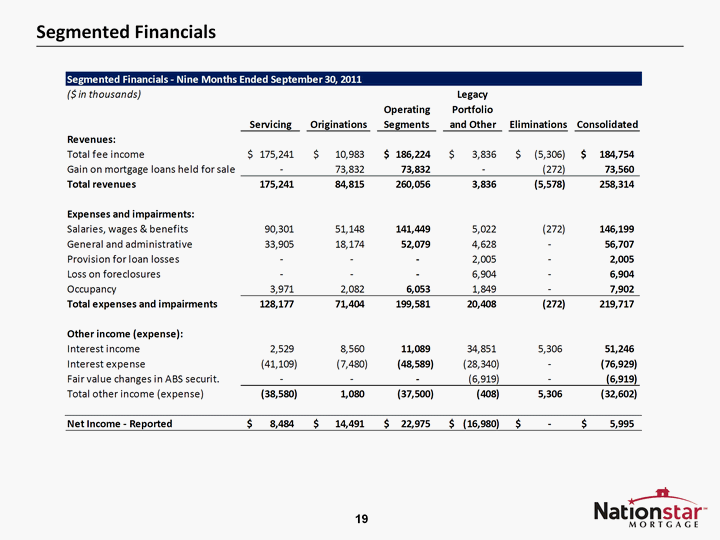
| Segmented Financials |
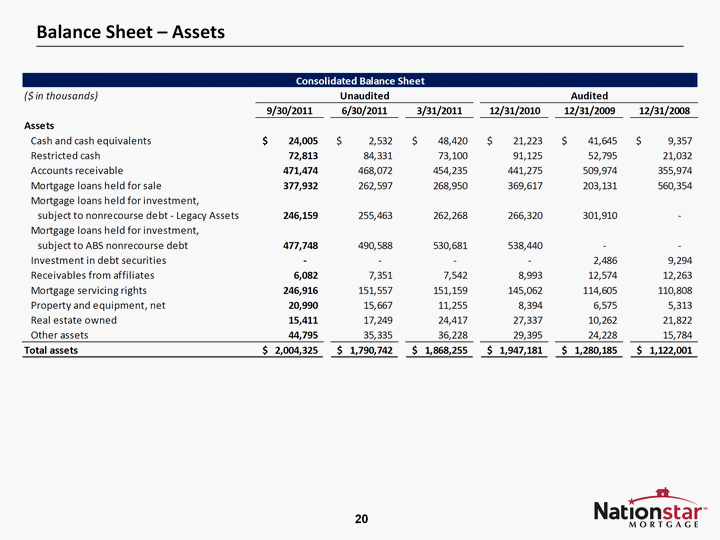
| Balance Sheet - Assets |
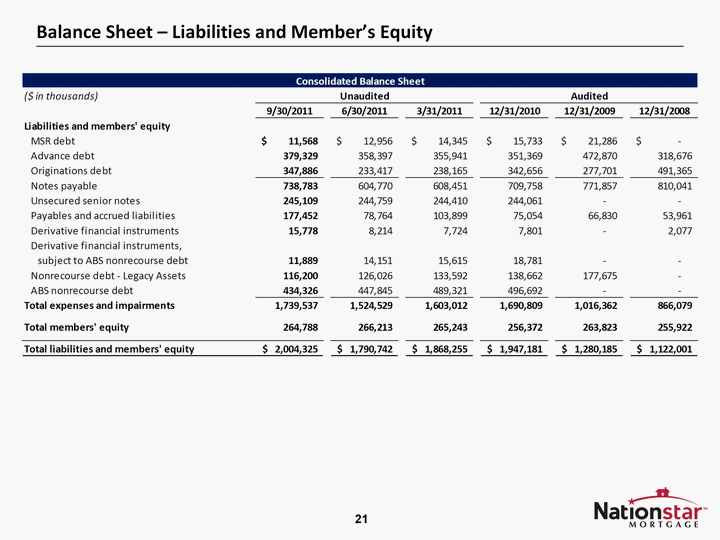
| Balance Sheet - Liabilities and Member's Equity |
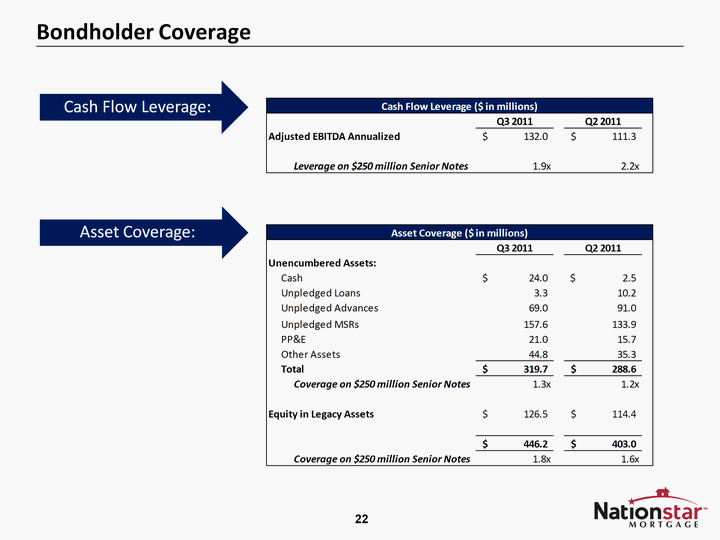
| Bondholder Coverage Asset Coverage: Cash Flow Leverage: |
