Attached files
| file | filename |
|---|---|
| 8-K - KAMAN CORPORATION FORM 8-K DATED NOVEMBER 15, 2011 - KAMAN Corp | form8-k.htm |

Kaman Corporation (NASDAQ-GS: KAMN)
Kaman Corporation (NASDAQ-GS: KAMN)
Investor Presentation
November 15, 2011

2
Investment Summary
§ Significant long-term organic growth opportunities in Aerospace
and Industrial Distribution
and Industrial Distribution
§ High margin Aerospace business anchored by market leading
position in specialty bearings
position in specialty bearings
§ Defense platforms in Aerospace provide solid revenue visibility
§ Industrial Distribution business achieving good organic growth and
gaining scale via recent acquisitions
gaining scale via recent acquisitions
§ Investing in new product development, new product applications,
acquisitions and technology for long-term growth
acquisitions and technology for long-term growth
§ Strong balance sheet to drive growth and strategic initiatives
§ New, experienced management team
3
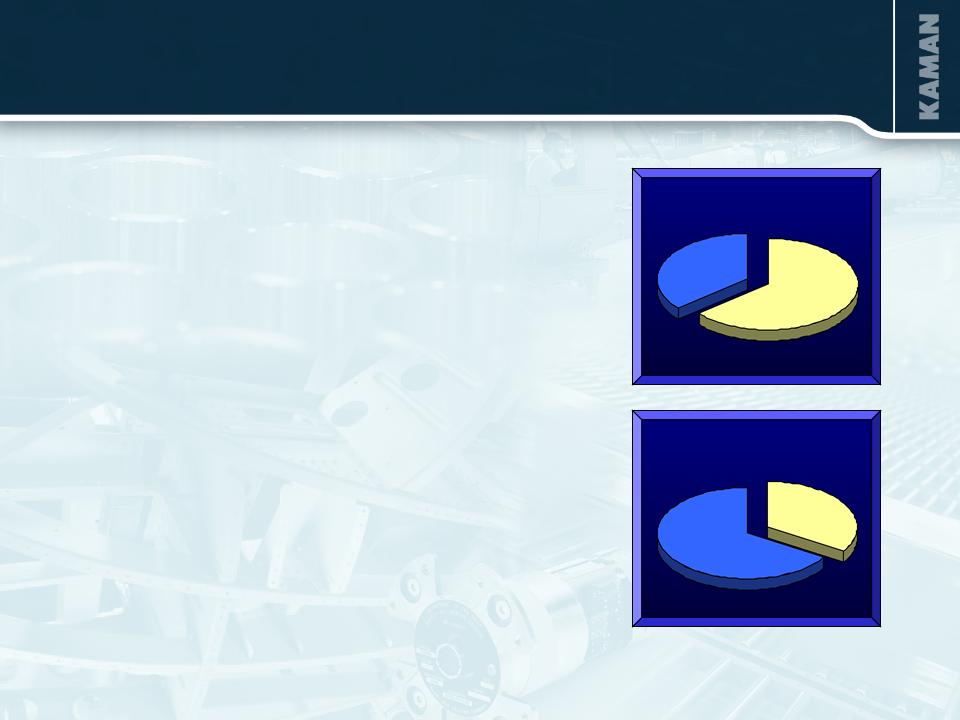
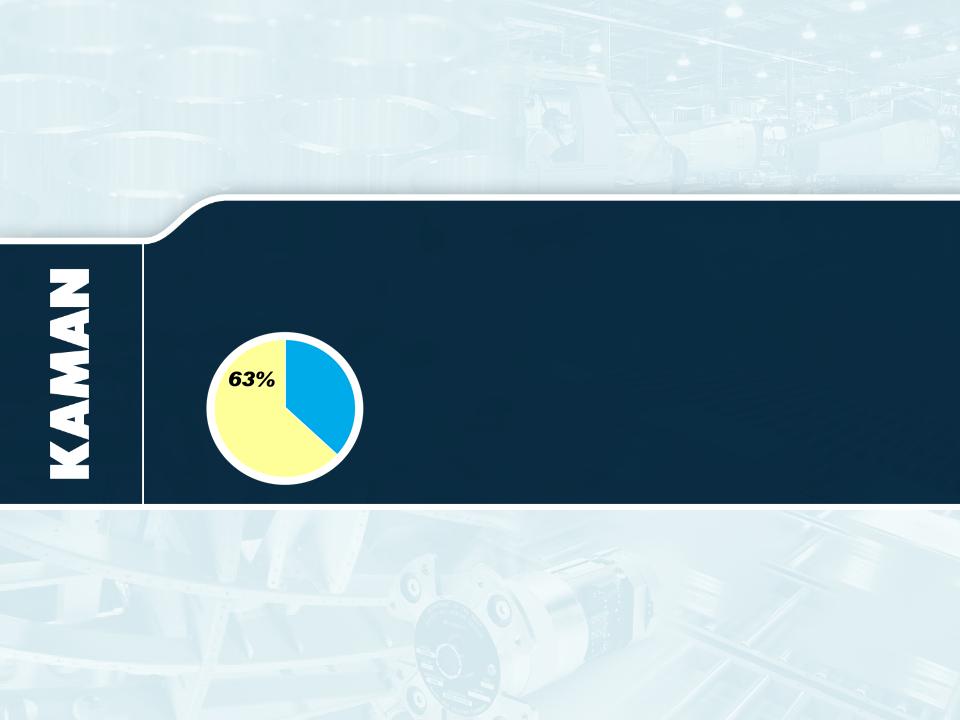
Distribution
63%
Aerospace
37%
2010 Sales
§ Kaman Corporation is a diversified company that conducts
business in the aerospace and industrial distribution markets
business in the aerospace and industrial distribution markets
§ The Company has two segments
– Industrial Distribution
• Third largest distributor in the power transmission / motion
control market
control market
• Distributes over four million SKUs to over 50K customers
via 227 branches
– Aerospace
• Manufacturer and subcontractor in the global commercial
and military aerospace and defense market
and military aerospace and defense market
• Diverse customer base of government divisions and blue
chip customers
chip customers
§ Publicly listed on NASDAQ with a market capitalization of
$838 million as of November 10, 2011
$838 million as of November 10, 2011
§ 2011 Expected sales of $1.5 billion; 4,700 Employees
Corporate Overview
(1) Operating profit after depreciation and before interest and corporate charges
Distribution
31%
Aerospace
69%
2010 Segment
Operating Income (1)

4
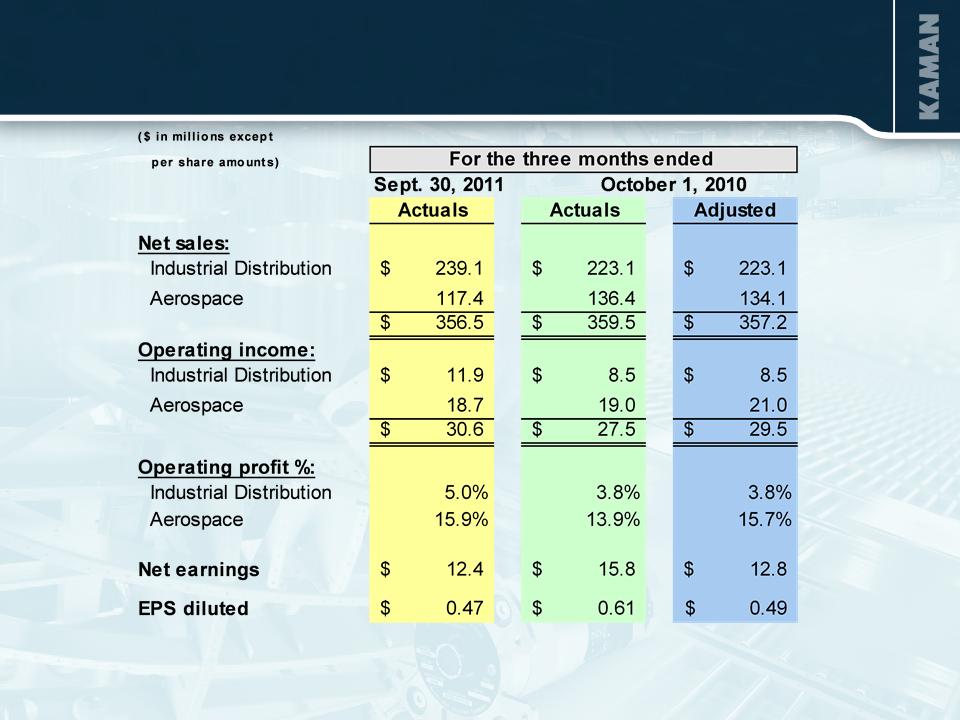
|
|
Nine Months
YTD
10/01/2010
|
Nine Months
YTD
09/30/2011
|
Change
|
|
Sales
|
$ 953
|
$ 1,119
|
+ 17.4%
|
|
Earnings per share
|
$ 0.79(1)
|
$ 1.41(2)
|
+ 78.5%
|
|
Free cash flow
|
$ 12.6
|
$ (3.9)
|
- 131.0%
|
|
Market capitalization
|
$ 670
|
$ 734
|
+ 9.6%
|
|
Price per share
|
$ 25.83
|
$ 27.85
|
+ 7.8%
|
(In millions except per share amounts)
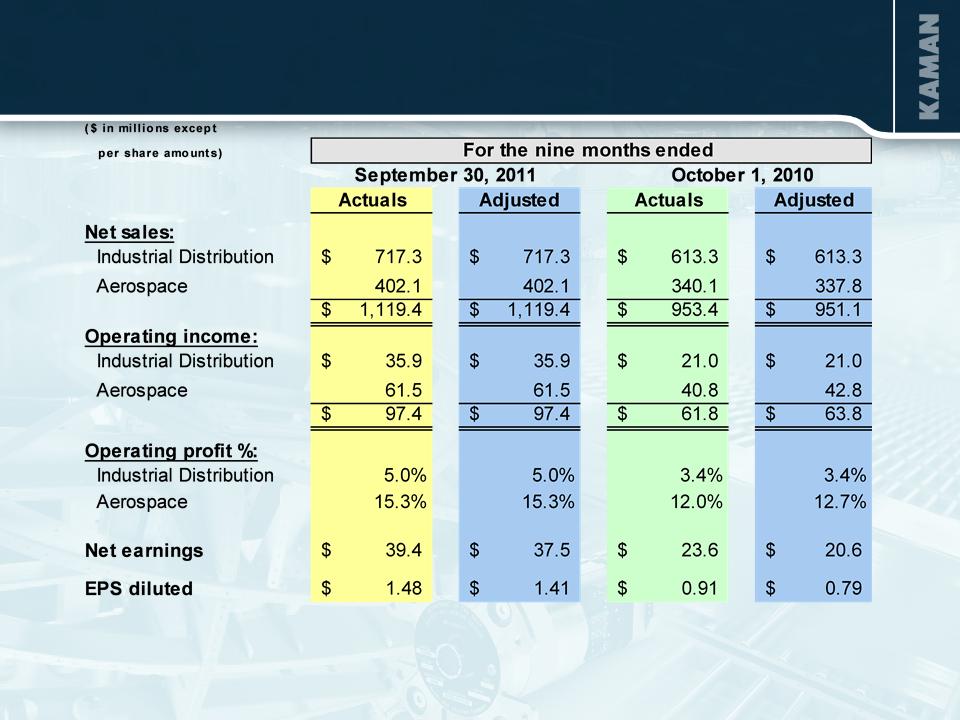
(1) Adjusted - excludes look back interest benefit of $6.6 million pretax ($0.17 per share per share, net of tax)
and an aerospace contract settlement of $2.0 million pretax ($.05 per share, net of tax).
(2) Adjusted - excludes $2.4 million pretax ($0.07 per share, net of tax) benefit associated with the death
of a former executive
Key Metrics
5
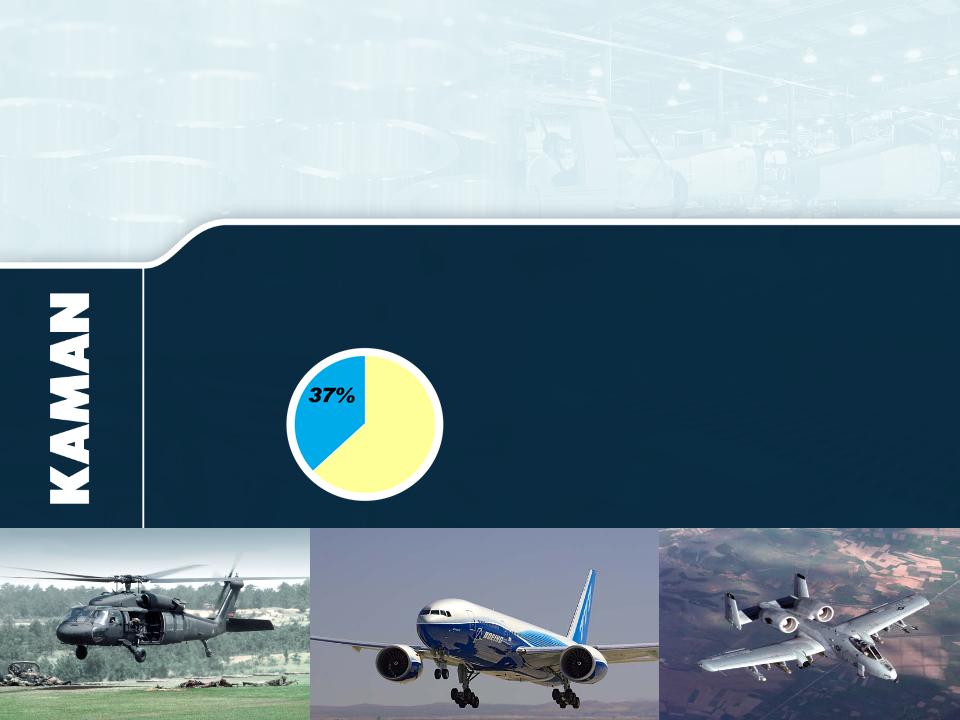
AEROSPACE
2011 Sales $560 Million (expected)

6
Aerospace
OBJECTIVE:
§ $1 billion in sales by 2014 / margins in the “high teens”
STRATEGY:
§ DEPTH - Size/financial strength to address larger, integrated work
packages from primes/OEM’s and Tier 1’s
packages from primes/OEM’s and Tier 1’s
§ DIVERSITY - More balanced portfolio thru increased commercial
content
content
§ DIFFERENTIATION - Continue to move from build-to-print to design-
and-build for higher margins and more defensible positions
and-build for higher margins and more defensible positions
§ DEVELOPMENT - Increased, focused investments in our people and
infrastructure to increase capabilities and support improved
performance
infrastructure to increase capabilities and support improved
performance

7
Acquisition of Vermont Composites
§ Acquired November 4, 2011
§ A leader in the design and manufacture of composite
aerostructures and advanced composite medical equipment
aerostructures and advanced composite medical equipment
§ Major platforms:
- V-22 Osprey
- P-8 Poseidon
- C-130 Hercules
- MH-60 BLACK HAWK
- Various UAV’s
§ Expected 2011 annual sales of $32 million
§ 230 employees

8
Aerospace Business Drivers
§ Continued outsourcing trend by OEMs and Super Tier 1s to increase
flexibility and lower costs
flexibility and lower costs
§ High margin specialty bearing and aerostructure businesses
positioned to capitalize from significant ramp in commercial build
rates at Boeing and Airbus
positioned to capitalize from significant ramp in commercial build
rates at Boeing and Airbus
§ Defense platforms provide exposure to key vertical lift and reset
programs
programs
§ Legacy prime contractor capabilities provide attractive outsourcing
alternatives to today’s helicopter and fixed wing aircraft OEMs
alternatives to today’s helicopter and fixed wing aircraft OEMs
9
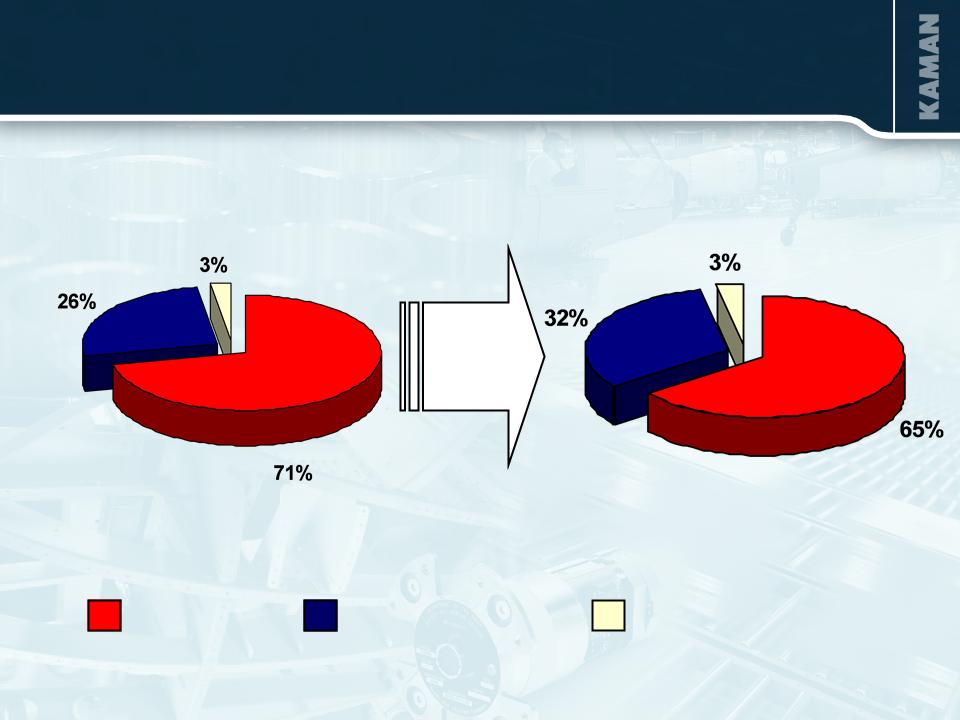
Defense
Commercial
Business/Regional
2010
$487M
2011 Expected
$560M
+≈15%
Aerospace Sales
10
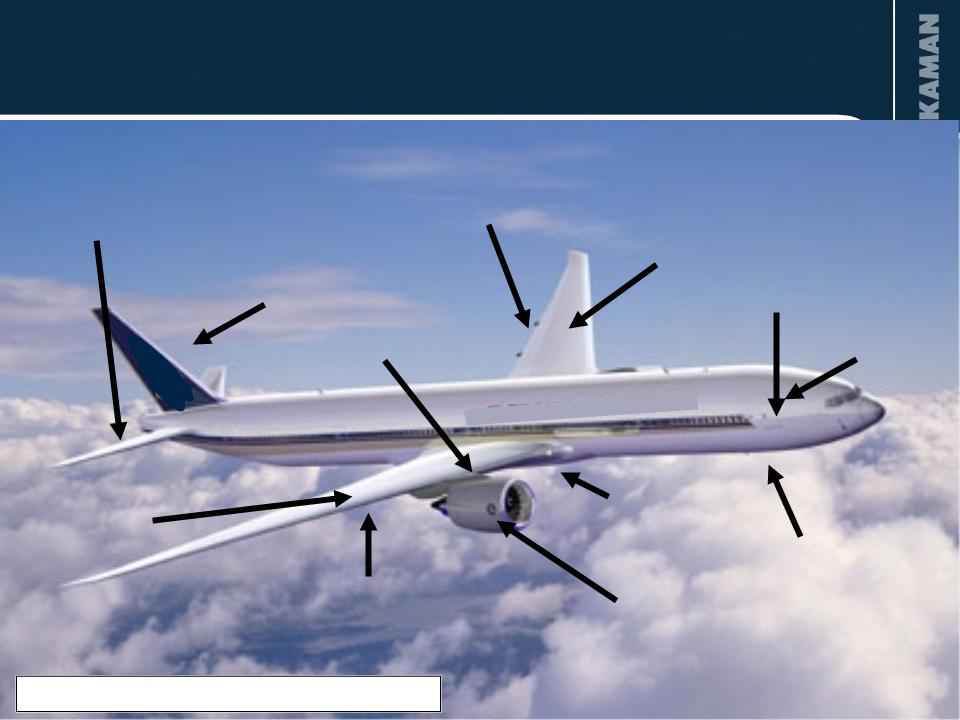
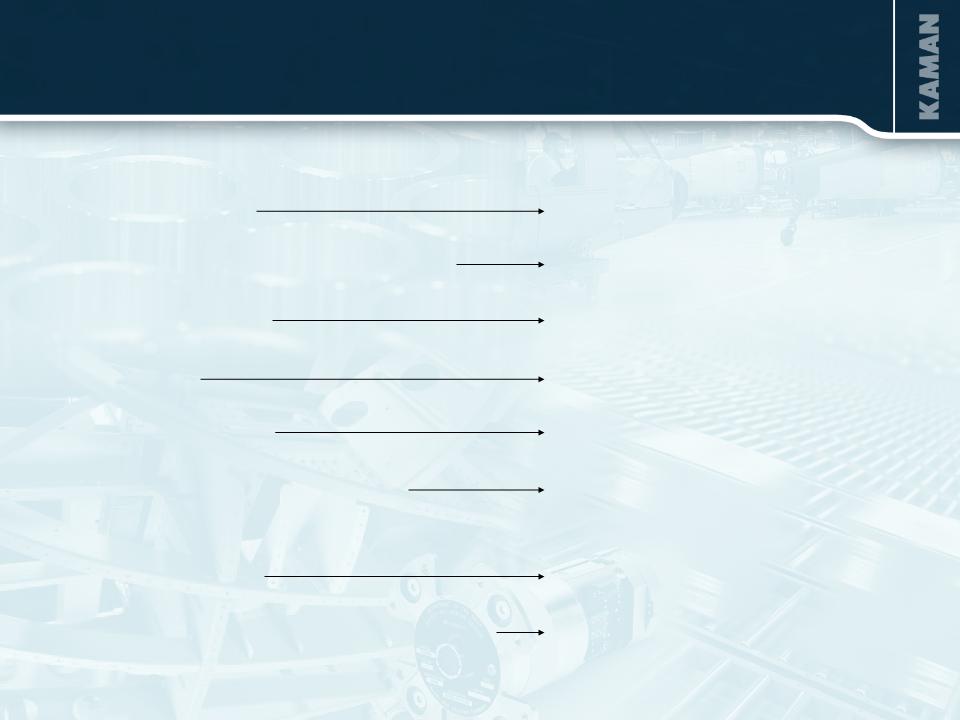
Fixed trailing edge
Fuel tank access doors
Top covers
Red denotes bearing products
Nose landing gear
Rudder
Main landing gear
Flaps
Horizontal stabilizer
Door assemblies
Engine/thrust reverser
Aircraft Programs/Capabilities
Flight controls
Doors
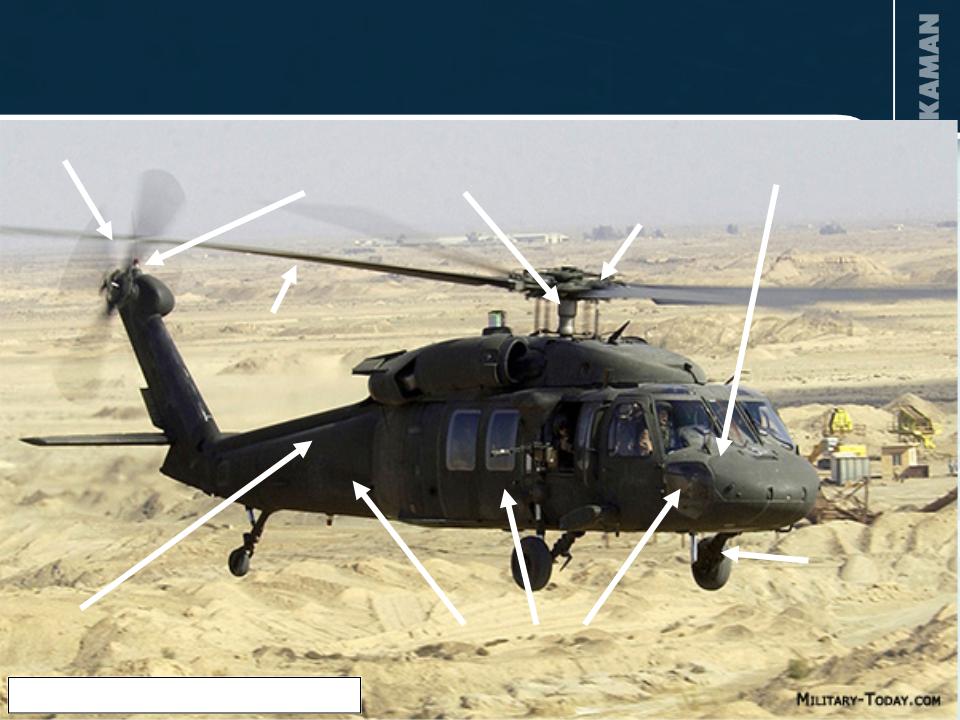
11
Manufacture of cockpit
Blade erosion coating
Manufacture and assembly
of tail rotor pylon
of tail rotor pylon
Manufacture, sub assembly
and joining of fuselage
and joining of fuselage
Blade manufacture,
repair and overhaul
repair and overhaul
Driveline couplings
Bushings
Flight control bearings
Aircraft Programs/Capabilities
Red denotes bearing products
12
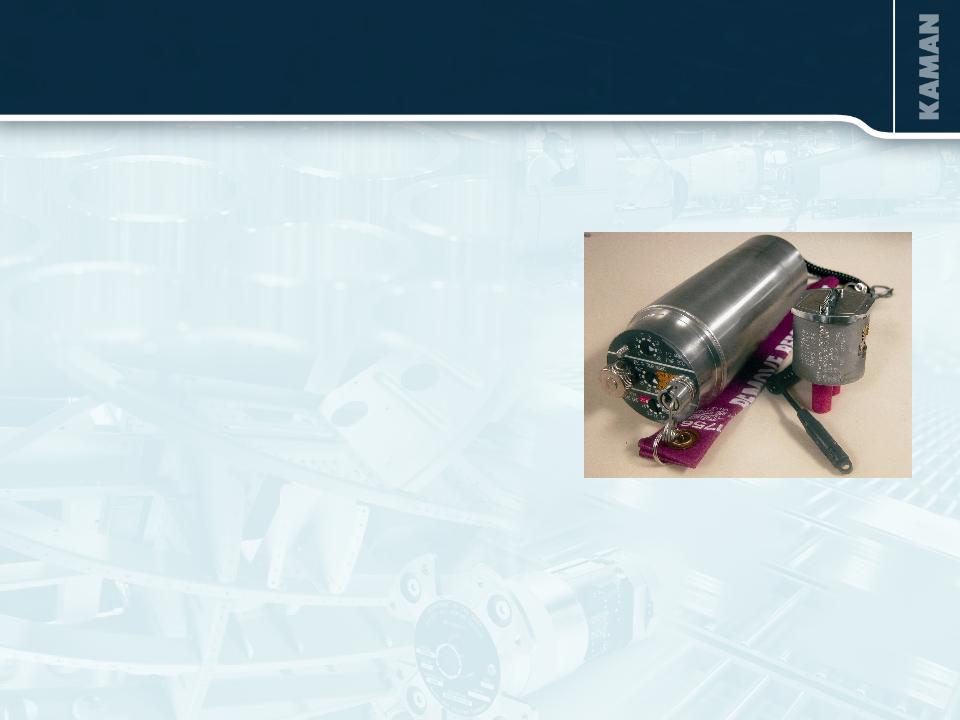
Joint Programmable Fuze (JPF) Program
§ High volume bomb fuze (safe and arming device)
§ USAF bomb fuze of choice
§ Utilized by nineteen other nations
§ Kaman is sole source manufacturer
§ Q3 testing issues
- Delayed deliveries into Q4
- Resumed Lot Acceptance Testing
in early November
13
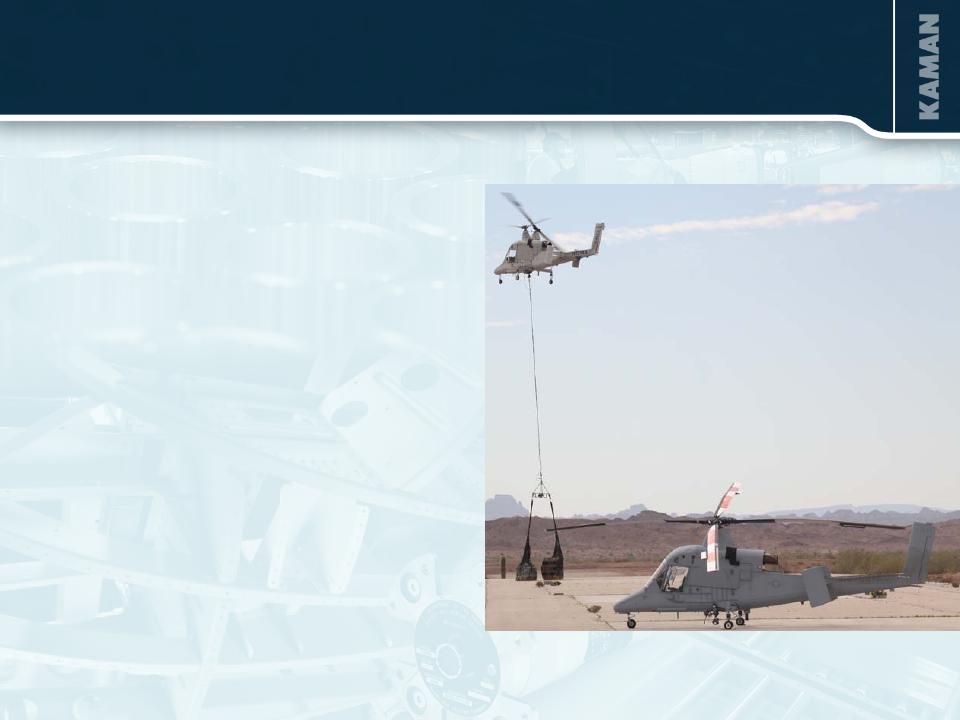
§ Teamed with Lockheed Martin to
develop an unmanned military version
of the Kaman K-MAX commercial
helicopter
develop an unmanned military version
of the Kaman K-MAX commercial
helicopter
§ Lockheed Martin / Kaman team working
under a $45.8 million contract for the
evaluation of unmanned aircraft
systems by the USMC
under a $45.8 million contract for the
evaluation of unmanned aircraft
systems by the USMC
- Two aircraft delivered under this
program to the U.S. military
program to the U.S. military
- Successfully completed a five-day
Quick Reaction Assessment (QRA)
in August 2011
Quick Reaction Assessment (QRA)
in August 2011
- USMC announced plans to deploy
the two aircraft to Afghanistan
the two aircraft to Afghanistan
§ Lockheed Martin awarded $47 million
Army contract for unmanned K-MAX
development
Army contract for unmanned K-MAX
development
Unmanned K-MAX®

14
Aerospace - Budget Impact on Defense
Programs
Programs
§ Backlog is comprised largely of programs that are unaffected by the
proposed budget cuts
proposed budget cuts
– UH-60 BLACK HAWK Program - stable demand
– Joint Programmable Fuze - backlog into 2013, foreign demand, continued
sole source
sole source
– Joint Strike Fighter - new business
– A-10 - reset, new business
– AH-1Z - new business
§ C-17 has a firm backlog into 2013
§ Canceled programs had minimal overall impact to the company
– Nuclear ballistic missile defense
– Naval surface ships
– F-22
– Future Combat System

15
|
|
Projected Deliveries
|
||||
|
|
2011
|
|
2014
|
|
% Increase
|
|
Boeing 777
|
75
|
|
100
|
|
+ 33%
|
|
Boeing 747
|
15
|
|
24
|
|
+ 60%
|
|
Boeing 737
|
376
|
|
484
|
|
+ 29%
|
|
Boeing 787
|
11
|
|
117
|
|
+ 964%
|
|
Airbus A320
|
409
|
|
454
|
|
+ 11%
|
|
Airbus A380
|
24
|
|
28
|
|
+ 17%
|
|
Airbus A350
|
0
|
|
21
|
|
-
|
Source: Jefferies Estimates
Positioned to Benefit from Ramp in
Commercial Production
Commercial Production
16
Other Growth Programs
§ A-10 re-wing
§ F-35 (Joint Strike Fighter)
§ Bell Helicopter
– AH-1Z
– Commercial
§ Learjet 85

17
18
NOW
FUTURE/VISION
Aerospace Strategic Transition
$560 Million sales $1 Billion sales
15.3% to 15.5% Operating margin “High Teens” operating margin
60% Build-to-print 70% Design-and-build
65% Defense 50% Defense/50% Commercial
Tier II/III Supplier Super Tier II
Small, independent businesses Integrated, coordinated,
synergistic business
synergistic business
Primarily domestic Multi-national
Competing on cost and manufacturing Competing on design-and-build
capability manufacturing capability, and
Intellectual Property
capability
manufacturing capability, and
Intellectual Property
manufacturing capability, and
Intellectual Property

19
INDUSTRIAL DISTRIBUTION
2011 Sales $950 Million (Expected)

20
§ Third largest industrial distribution firm serving $15 billion of the $23
billion power transmission / motion control market.
billion power transmission / motion control market.
§ 227 branches and 5 distribution centers
§ Major product categories:
– Bearings
– Mechanical and electrical power transmission
– Fluid Power
– Motion control
– Automation
– Material handling
§ Metrics:
– $470,000 sales per employee (2010)
– 2,000 employees (approximately one third outside sales)
– 4.0 million SKUs
– 50,000+ customers
Industrial Distribution Overview

21
Industrial Distribution
OBJECTIVE:
§ $1.5 billion in sales - 7% operating profit margin by 2014
STRATEGY:
§ SCALE/GROWTH - Broaden product offering organically and through
acquisitions. Expand geographic footprint to enhance position in the
national accounts market
acquisitions. Expand geographic footprint to enhance position in the
national accounts market
§ PRODUCTIVITY - Execute organizational realignment and implement
multi-faceted technology investments
multi-faceted technology investments
§ PROFITABILITY - Recognize sales and cost synergies from the six
acquisitions completed in 2010 and 2011. Enhance margins through new
higher margin product lines, a focus on pricing management and
leverage increased purchasing scale
acquisitions completed in 2010 and 2011. Enhance margins through new
higher margin product lines, a focus on pricing management and
leverage increased purchasing scale
22
Executing Strategy and Building Network

23
§ STRONG ORGANIC GROWTH
– Q311 sales rose by 7.2% over the prior year period to $239 million
– OEM markets continue strong growth (up 28%)
– MRO markets are solid
– Market strength across geographies, customers and end markets
– October 2011 sales were up 6.6% over the prior year
§ ACQUISITIONS ACCELERATING TOP LINE AND BUILDING SCALE
– Added geographic coverage, product line expansions, strong franchises
– Six acquisitions completed in 2010 and 2011
– Minarik and Allied acquisitions have been twice as accretive as expected
Growth is Well Rounded
Q311 Operating profit margin was 5.0%,
the seventh consecutive quarter of year over year improvement

24
Acquisition of Target Electronic Supply, Inc.
§ Acquired September 2, 2011
§ Expected 2012 sales of about $20 million
§ A leader in the motion control systems market in New England with
branches in MA, CT and NH
branches in MA, CT and NH
§ Adds motion control systems capabilities complementing Kaman’s
power transmission and Minarik’s automation offerings in New
England
power transmission and Minarik’s automation offerings in New
England
§ Adds additional scale to drive cost efficiencies and increase
leverage
leverage

25
Industrial Distribution Opportunities
§ Broaden product offering organically and through acquisition to win
additional business from existing customers and gain market share
additional business from existing customers and gain market share
§ Enhance margins through new higher margin product lines, a focus
on pricing management and leverage from higher sales
on pricing management and leverage from higher sales
§ Recognize sales and cost synergies from the six acquisitions
completed in 2010 and 2011
completed in 2010 and 2011
§ Expand geographic footprint through additional acquisitions to
enhance Kaman’s position in the competition for national accounts
enhance Kaman’s position in the competition for national accounts
§ Improve productivity through technology investments to enhance
return on sales
return on sales

26
Kaman Investment Merits
§ A Leading Market Position in Both Business Segments
§ Continued Focus on Profit Optimization, Increasing Cash
Flows and Strengthening Competitive Position
Flows and Strengthening Competitive Position
§ Strong Liquidity and Conservative Financial Profile
- Investment Grade Rating (BBB-/Stable)
§ Disciplined and Focused Acquisition Strategy
§ New, experienced Management Team

27
Q&A

28
APPENDIX
29
FINANCIAL SUMMARY
37%
2010 Sales $1.32 Billion
30
(1)
(2)
(3)
(3)
(1) Excludes a sales adjustment of $2.3 million related to a contract pricing settlement
(2) Excludes a $2.0 million pretax adjustment related to a contract pricing settlement
(3) Excludes the adjustment in note (2), which was $0.05 per share, net of tax; and a look back
interest benefit of $6.6 million pretax ($0.17 per share, net of tax)
Financial Highlights - Q3
31
(1) Excludes a sales adjustment of $2.3 million related to a contract pricing settlement
(2) Excludes a $2.0 million pretax adjustment related to a contract pricing settlement
(3) Excludes the adjustment in note (2), which was $0.05, net of tax; and a look back interest
benefit of $6.6 million pretax ($0.17 per share, net of tax)
(4) Excludes $2.4 million pretax ($0.07 per share, net of tax) benefit associated with the death of a former executive
(1)
(2)
(3)
(3)
(4)
(4)
Financial Highlights - Nine Months YTD
32
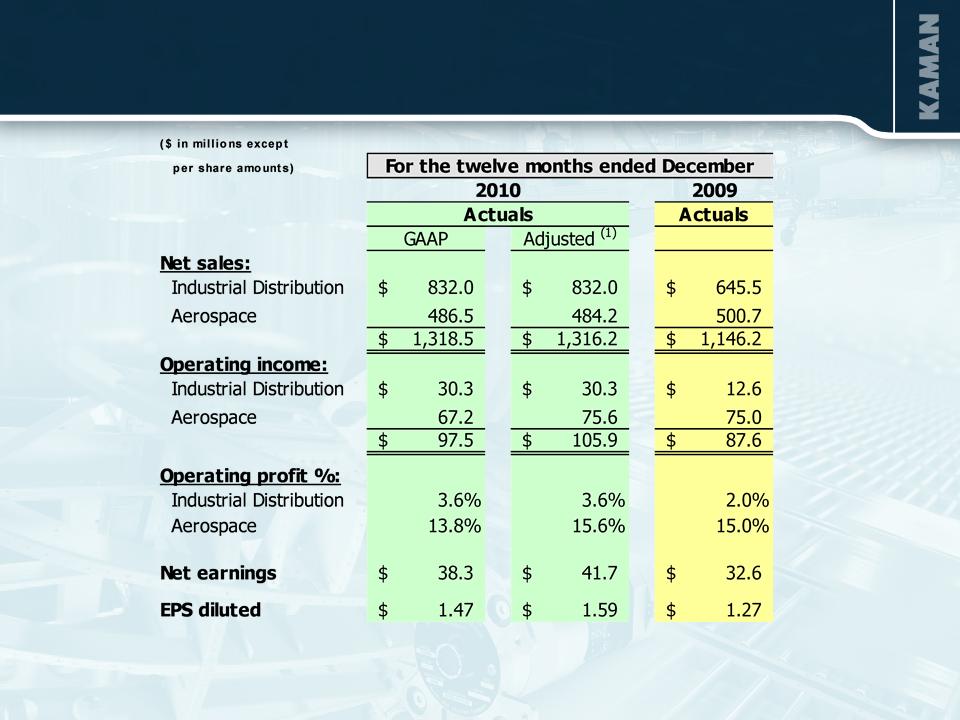
(1)Adjusted - excludes $6.4 million goodwill impairment, $2.0 million aerospace contract settlement and
$6.6 look-back interest benefit
Financial Highlights - Full Year 2010

33
|
(In Millions)
|
As of 9/30/2011
|
As of 12/31/10
|
As of 12/31/09
|
|
Cash and Cash Equivalents
|
$ 15.2
|
$ 32.2
|
$ 18.0
|
|
Notes Payable and Long-term Debt
|
$ 149.7
|
$ 148.4
|
$ 63.6
|
|
Shareholders’ Equity
|
$ 399.4
|
$ 362.7
|
$ 312.9
|
|
Debt as % of Total Capitalization
|
27.3%
|
29.0%
|
16.9%
|
|
Capital Expenditures
|
$ 19.41
|
$ 21.5
|
$ 13.6
|
|
Depreciation & Amortization
|
$ 16.61
|
$ 20.5
|
$ 16.1
|
1 For the nine months ended 9/30/2011
Balance Sheet and Capital Factors

34
Forward Looking Statement
This presentation contains forward-looking information relating to the Company's business and prospects, including the Aerospace and
Industrial Distribution businesses, operating cash flow, and other matters that involve a number of uncertainties that may cause actual results
to differ materially from expectations. Those uncertainties include, but are not limited to: 1) the successful conclusion of competitions for
government programs and thereafter contract negotiations with government authorities, both foreign and domestic; 2) political conditions in
countries where the Company does or intends to do business; 3) standard government contract provisions permitting renegotiation of terms
and termination for the convenience of the government; 4) satisfactory conclusion to government inquiries or investigations regarding
government programs; 5) domestic and foreign economic and competitive conditions in markets served by the Company, particularly the
defense, commercial aviation and industrial production markets; 6) risks associated with successful implementation and ramp up of significant
new programs; 7) potential difficulties associated with variable acceptance test results, given sensitive production materials and extreme test
parameters; 8) management's success in increasing the volume of profitable work at the Wichita facility; 9) successful resale of the SH-2G(I)
aircraft, equipment and spare parts; 10) receipt and successful execution of production orders for the JPF U.S. government contract, including
the exercise of all contract options and receipt of orders from allied militaries, as all have been assumed in connection with goodwill
impairment evaluations; 11) satisfactory resolution of (i) the Company's litigation relating to the FMU-143 program and (ii) the Wichita
subpoena matter; 12) continued support of the existing K-MAX® helicopter fleet, including sale of existing K-MAX® spare parts inventory; 13)
cost estimates associated with environmental remediation activities at the Bloomfield, Moosup and New Hartford, CT facilities and our U.K.
facilities; 14) profitable integration of acquired businesses into the Company's operations; 15) changes in supplier sales or vendor incentive
policies; 16) the effects of price increases or decreases; 17) the effects of pension regulations, pension plan assumptions and future
contributions; 18) future levels of indebtedness and capital expenditures; 19) continued availability of raw materials and other commodities in
adequate supplies and the effect of increased costs for such items; 20) the effects of currency exchange rates and foreign competition on
future operations; 21) changes in laws and regulations, taxes, interest rates, inflation rates and general business conditions; 22) future
repurchases and/or issuances of common stock; and 23) other risks and uncertainties set forth in the Company's annual, quarterly and
current reports, proxy statements and other filings with the SEC. Any forward-looking information provided in this presentation should be
considered with these factors in mind. The Company assumes no obligation to update any forward-looking statements contained in this
presentation.
Contact: Eric Remington
V.P., Investor Relations
(860) 243-6334
Eric.Remington@kaman.com