Attached files
| file | filename |
|---|---|
| 8-K - FORM 8-K - FOREST CITY ENTERPRISES INC | d254382d8k.htm |
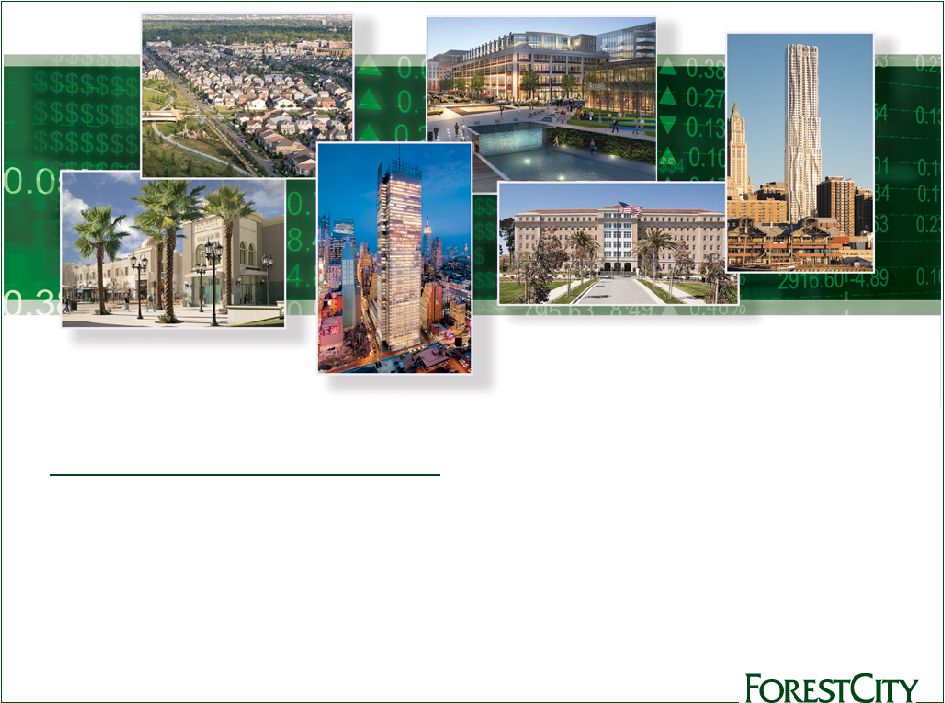 Investor
Update November 2011
Exhibit 99.1 |
 2
|
 Information
Related to Forward-Looking Statements Statements made in this presentation that state
the Company’s or management's intentions, hopes, beliefs, expectations or
predictions of the future are forward-looking statements. It is important to note
that the Company's future events and actual results, financial or otherwise, could
differ materially from those projected in such forward-looking statements. Additional
information
concerning
factors
that
could
cause
future
events
or
actual
results
to
differ
materially from those in the forward-looking statements are included in the “Risk
Factors” section of the Company's SEC filings, including, but not limited
to, the Company's Annual Report
and quarterly reports. You are cautioned not to place undue reliance on such
forward-looking statements.
Use of non-GAAP measures
We frequently use the non-GAAP measures of earnings before depreciation, amortization and
deferred taxes (“EBDT”), comparable net operating income (“NOI”)
and measures based on the pro-rata consolidation method
(“pro-rata”) to explain operating performance and assist investors in
evaluating our business. For a more thorough discussion of our use of EBDT, NOI and
pro-rata measures, including how we reconcile these measures to their GAAP counterparts,
please refer to the Supplemental Packages furnished to the SEC on Form 8-K.
Copies of our quarterly and annual Supplemental Packages can be found on our website at
www.forestcity.net, or on the SEC’s website at www.sec.gov.
3 |
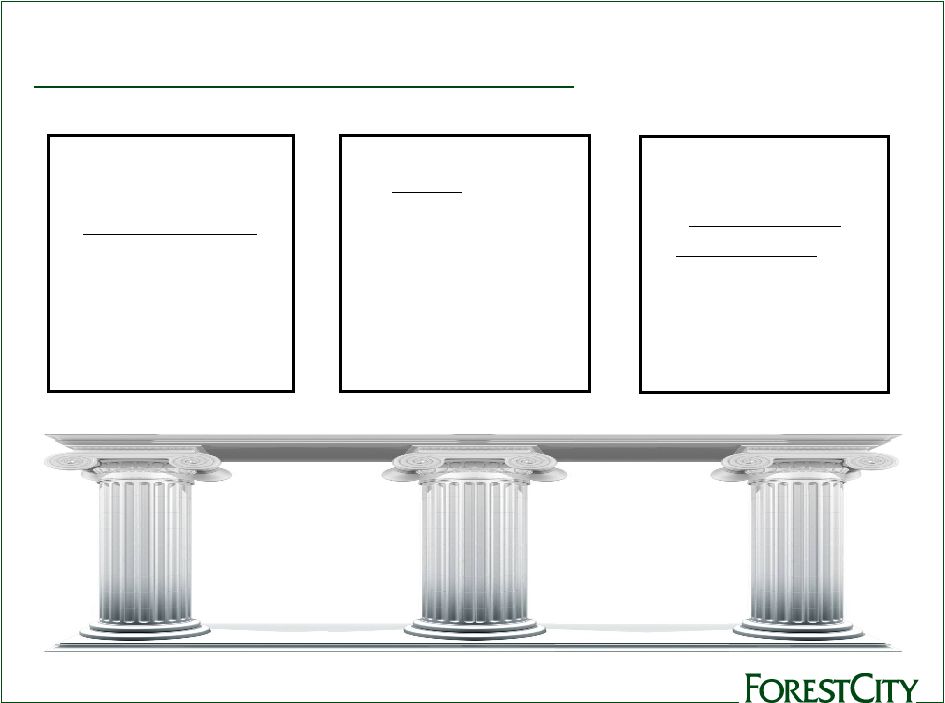 Our Strategic
Foundation 4
Develop
unique,
differentiated real estate
that fuels growth, creates
a “sense of place”
and
builds communities in
strong core markets
Be a value-added
owner and operator
of a diverse portfolio of
profitable real estate
assets
Build a
strong, sustaining
capital structure
and
balance sheet that
allow us to further
create value and
profitable growth |
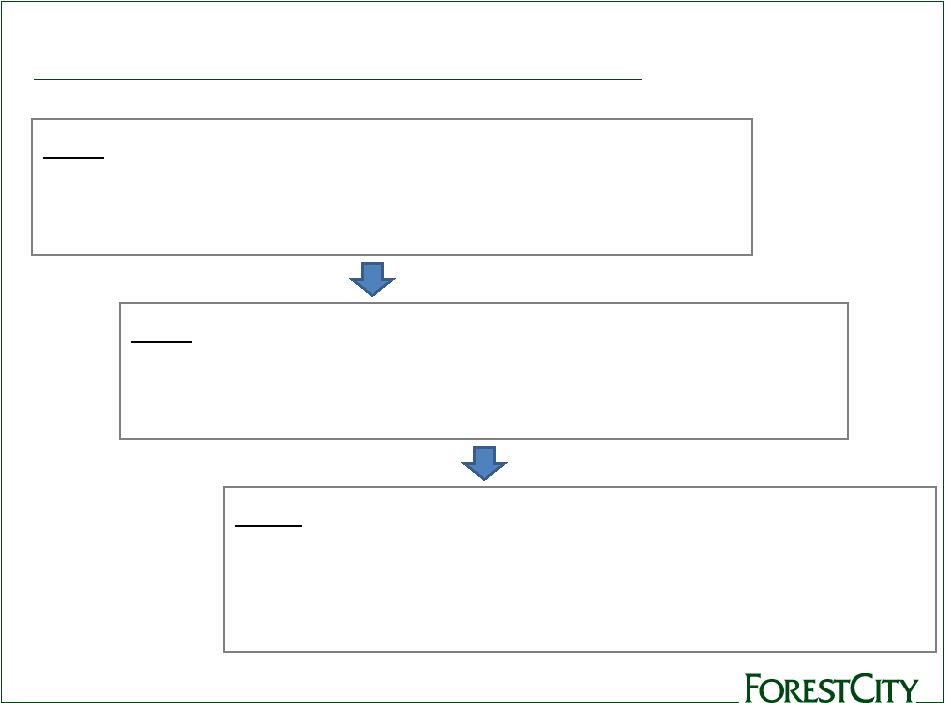 Investment
Profile: “Core-PLUS” 5
Core
Products:
•
Diverse portfolio of 220+ income-producing assets
•
Apartment, office, retail, life science, mixed use, military housing
•
Consistent NOI growth, stable occupancy, low tenant concentration
Core
Markets:
•
Gateway cities with strong growth/demographics, barriers to entry
•
76% + of assets in New York, D.C., Boston, Chicago, Denver, California
•
Selective expansion in new growth markets, including Texas
PLUS:
•
Signature development capability to fuel future growth
•
Substantial entitlement at large, mixed-use projects in core markets
•
Expertise in public/private partnerships, urban infill, adaptive reuse
•
90-year+ track record, 50 years as a public company |
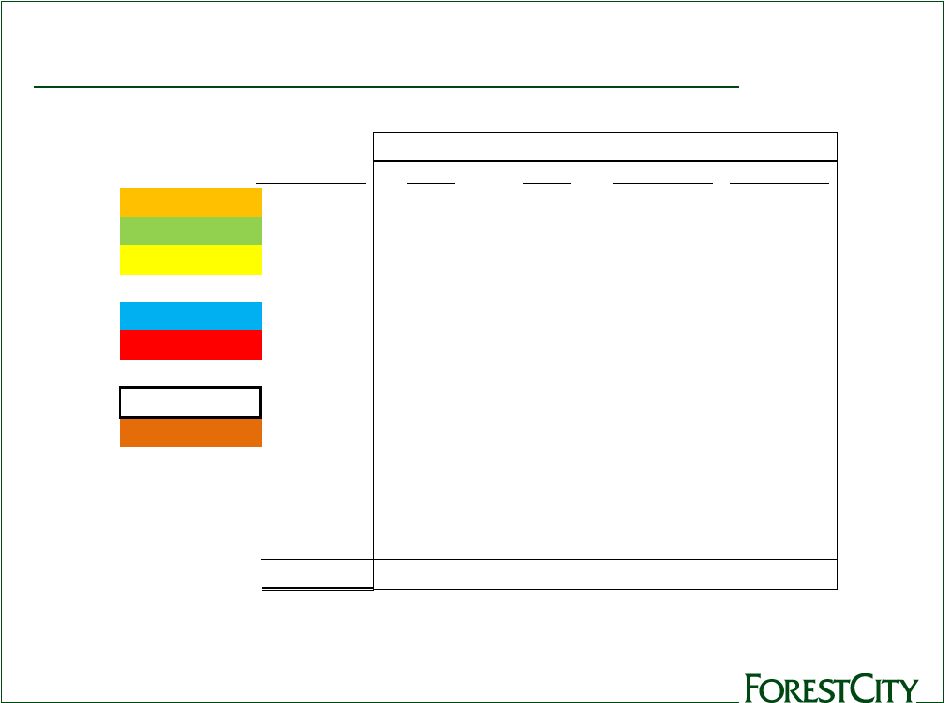
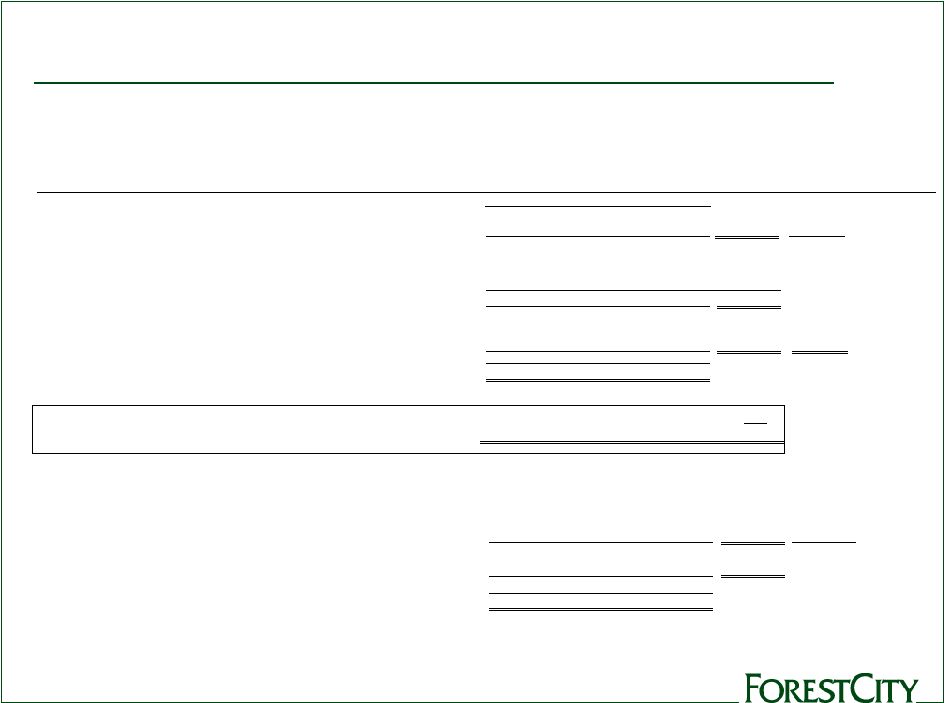
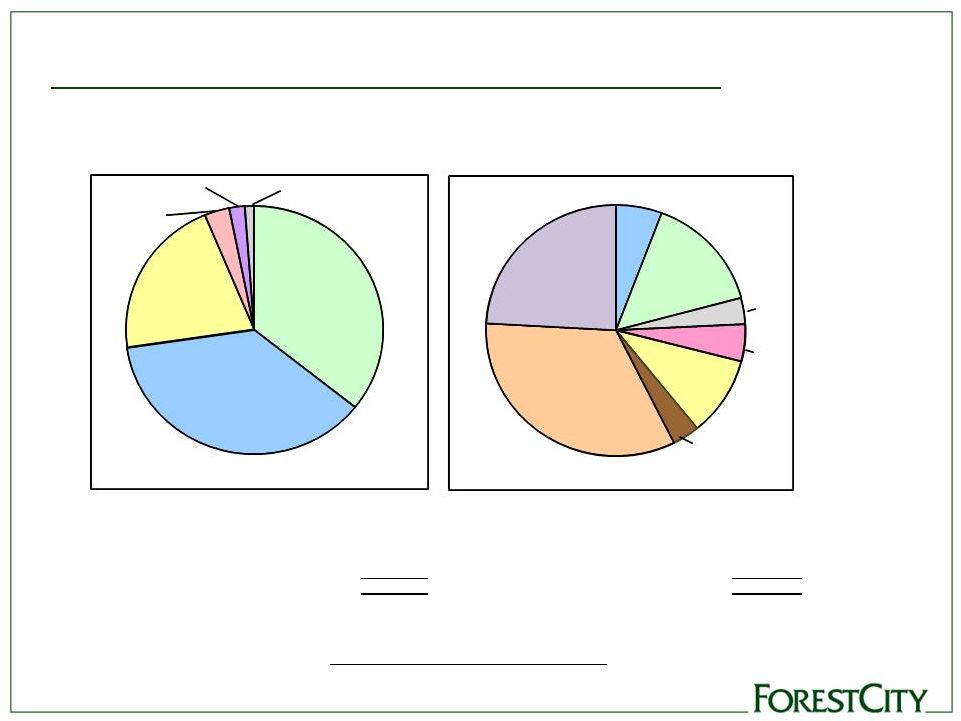 Balanced,
Diverse NOI Sources NOI by Product Type:
345,942
$
NOI by Market:
345,942
$
Casino Land Sale
42,622
Casino Land Sale
42,622
The Nets
(3,686)
The Nets
(3,686)
Corporate Activities
(25,035)
Corporate Activities
(25,035)
Other
(1)
(4,968)
Other
(1)
(4,968)
Grand Total NOI
354,875
$
Grand Total NOI
354,875
$
(1) Includes write-offs of abandoned development projects,
non-capitalizable development costs and unallocated
management
and
service
company
overhead,
net
of
historic
and
new
market
tax
credit
income.
(2) Includes subsidized senior housing.
Six Months Ended July 31, 2011
Six Months Ended July 31, 2011
Net Operating Income
(3)
by Product Type
Net Operating Income
(3)
by Core Market
Pro-Rata Consolidation
(dollars in thousands)
Office
$128,027
36.9%
Apartments
(2)
$72,656
21.0%
Military
Housing
$10,929
3.2%
Retail
$123,442
35.7%
Hotels
$6,769
2.0%
Land
$4,119
1.2%
Boston
$19,789
5.7%
California
$52,136
15.1%
Denver
$16,509
4.8%
Chicago
$11,914
3.4%
New York
$114,948
33.3%
Non-Core
Markets
$83,435
24.1%
Washington,
D.C.
$35,344
10.2%
Philadelphia
$11,867
3.4%
Pro-Rata Consolidation
(dollars in thousands)
for Supplemental Packages for the periods referenced above, which provide reconciliation of NOI to its
nearest GAAP equivalent. Refer
to
the
Investors
section
of
Forest
City’s
web
site
(http://ir.forestcity.net/phoenix.zhtml?c=88464&p=IROL-reportsother)
(3)
6 |
 NOI by Market
and Product Type 7
(1)
Includes Senior Housing, Military Housing and Supported Living
(2)
Includes Hotels and Land Sales
2011 Q2 NOI
Split Between Products
% of TOTAL
Office
Retail
Apartments
1
Land/Other
2
New York
33%
67%
26%
7%
0%
California
15%
10%
69%
21%
0%
Washington DC
10%
34%
42%
24%
0%
Cleveland
8%
35%
9%
50%
6%
Boston
6%
77%
0%
23%
0%
Denver
5%
3%
35%
25%
37%
Pittsburgh
5%
17%
51%
5%
27%
Chicago
3%
20%
29%
51%
0%
Philadelphia
3%
21%
25%
54%
0%
Hawaii
3%
0%
0%
100%
0%
Florida
2%
0%
68%
32%
0%
Las Vegas
2%
0%
100%
0%
0%
Other
5%
7%
54%
58%
-19%
100%
37%
36%
24%
3% |
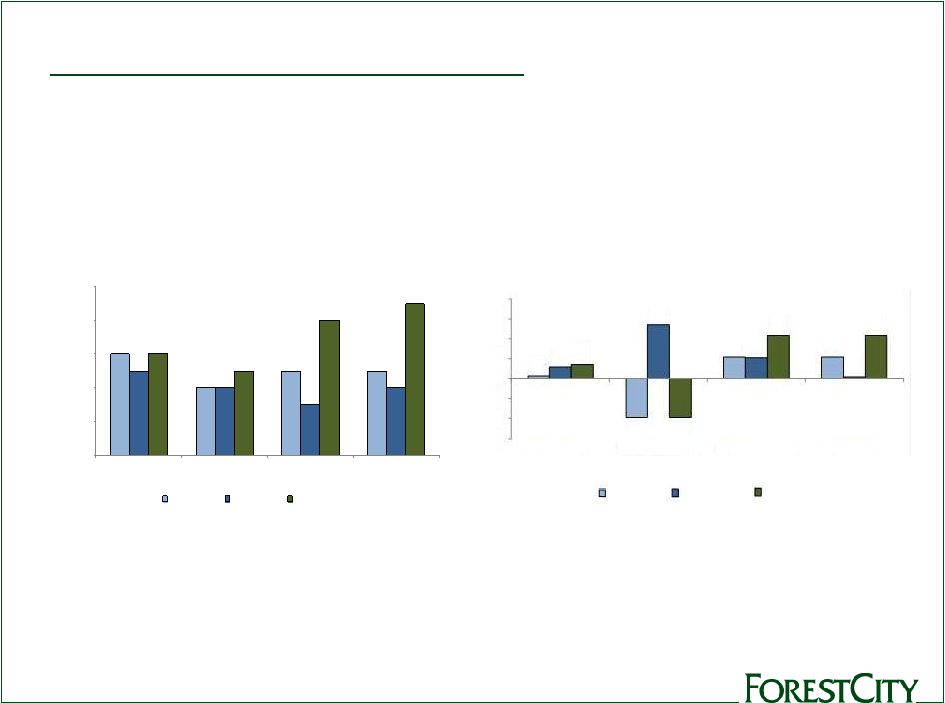 Average
Comparable
Occupancy
%
Consistent Operations
Comparable
NOI
Growth
–
Year-over-Year,
Pro
Rata
%
Source: Supplemental Packages for the six months ended July 31 2011, and the year ended
January 31,2011, 2010, and 2009. 8
Consistent Operations
2010 portfolio performance was in the top quartile industry-wide for all
major product types: office, retail and apartment.
(1) Prior periods have been recasted to exclude subsidized senior housing. The
Company believes this change will improve disclosure by allowing investors to see
results for the conventional apartment portfolio separated from those of the limited-dividend senior-housing properties.
92
90
91
91
91
90
89
90
92
91
94
95
86
88
90
92
94
96
YTD 1/31/09
YTD 1/31/10
YTD 1/31/11
YTD 7/31/11
Retail
Office
Residential (1)
8.0
4.0
2.0
-
(2.0)
(4.0)
(6.0)
6.0
Twelve months ended
1/31/09
Twelve months ended
1/31/10
Twelve months ended
1/31/11
Six months ended
7/31/11
0.3
1.2
4.3
(3.9)
(3.9)
5.4
1.4
2.2
0.2
4.3
2.1
2.2
Retail
Office
Residential (1)
8 |
 Consistent
Operations EBDT per Share Since 2001
($ per share)
(1) (2)
(2)
Consistent Operations
Total EBDT Since 2001
($ in millions)
(1)
168.0
194.4
212.4
245.0
270.5
285.0
265.7
218.9
301.1
309.9
-
50
100
150
200
250
300
350
2001
2002
2003
2004
2005
2006
2007
2008
2009
2010
1.77
1.94
2.10
2.41
2.64
2.73
2.47
2.05
2.00
1.59
-
0.50
1.00
1.50
2.00
2.50
3.00
2001
2002
2003
2004
2005
2006
2007
2008
2009
2010
Per–share data reflects new Class A common shares and the “if-converted”
effect of convertible debt and convertible preferred stock issued in 2009 and
2010.
(1)
Refer to the Investors section of Forest City’s web site
(http://ir.forestcity.net/phoenix.zhtml?c=88464&p=IROL-reportsother) for
Supplemental Packages for the periods referenced above, which provide reconciliation of EBDT
to its nearest GAAP equivalent. 9 |
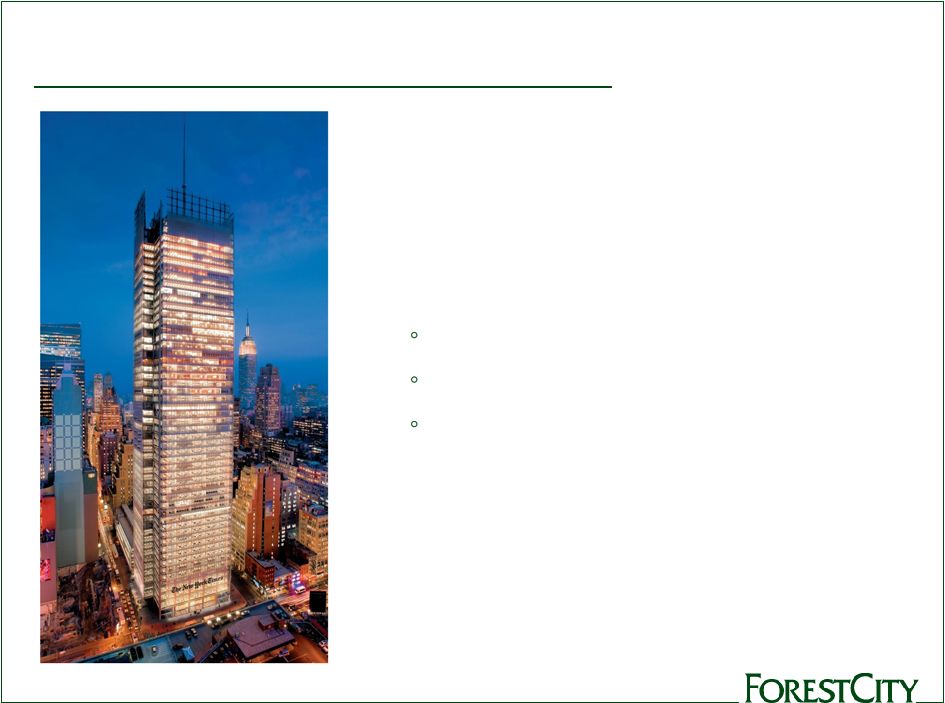 Portfolio
Highlights - Office
•
50 properties, 13.6M s.f. in conventional and
life science office
•
Concentrations in New York and Boston
•
Key properties:
New York Times, Manhattan (shown)
MetroTech Center, Brooklyn
University Park at MIT, Cambridge
10 |
 Portfolio
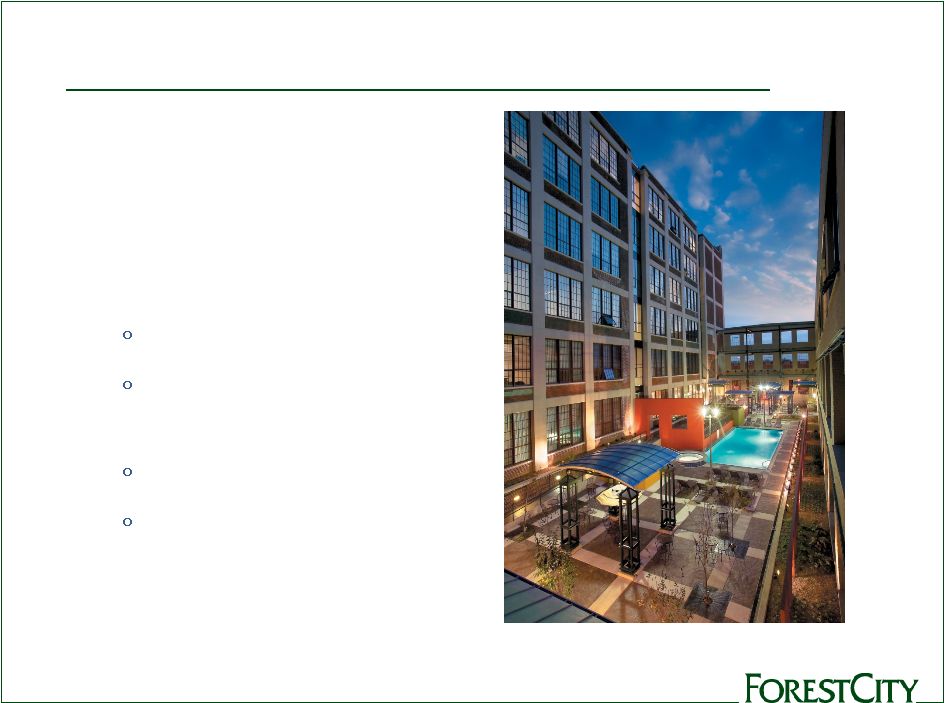
Highlights - Apartments
•
121 apartment communities,
34,000 total units; 14,100
military housing units
(1)
•
Key properties:
DKLB BKLN, Brooklyn
River Lofts at Tobacco
Row, Richmond (shown)
Metro 417, Los Angeles
Presidio Landmark,
San Francisco
11
(1) Includes Air Force -
Southern Group –
closed on September 30, 2011 |
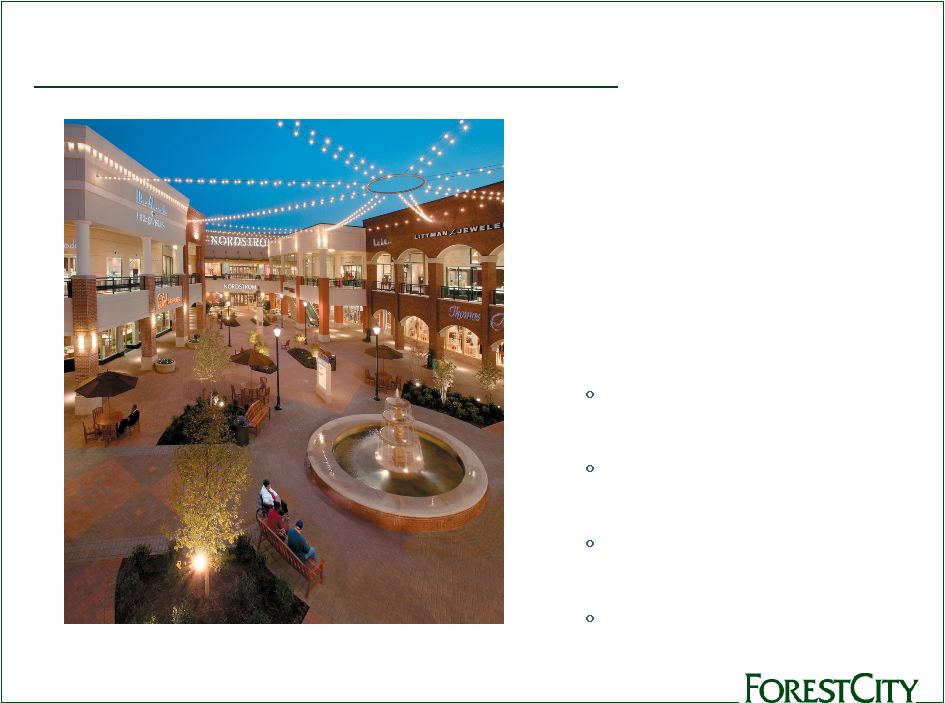 Portfolio
Highlights – Retail
•
46 centers, 26.5M total s.f.,
16.0M GLA
•
Enclosed regional malls,
open-air lifestyle centers,
big-box/power centers,
specialty centers
•
Key properties:
San Francisco Centre/
The Emporium
Short Pump Town Center,
Richmond (shown)
East River Plaza,
Manhattan
Victoria Gardens, Rancho
Cucamonga, CA
12 |
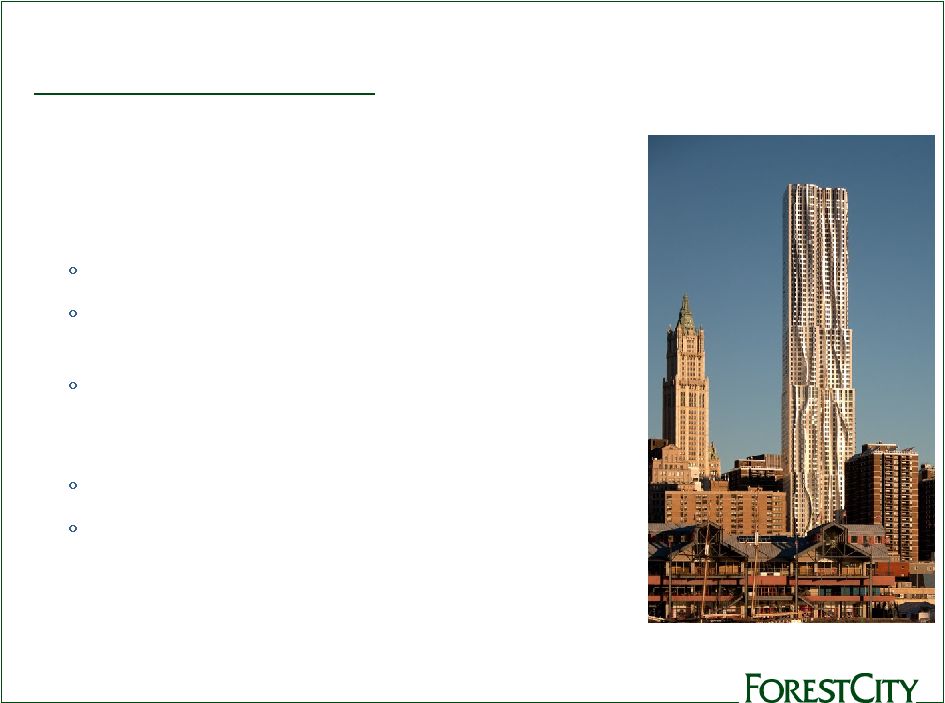 Recent
Opening •
8 Spruce Street,
* New York City (Lower Manhattan).
Frank Gehry-designed apartment tower. 76 stories,
903 market-rate units.
Tallest residential high-rise in the Western Hemisphere
“…
one of the most beautiful towers downtown.”
-
Paul Goldenberg, The New Yorker
“…
the
finest
skyscraper
to
rise
in
New
York
since
Eero
Saarinen’s CBS building went up 46 years ago.”
-
Nicholai Ourousoff, The New York Times
450+ executed leases after <200 days of active leasing
Lower floors include a K-8 public school and an
ambulatory care center for the New York Downtown
Hospital
13
* Over 680 units are open, remaining units on upper floors are under construction |
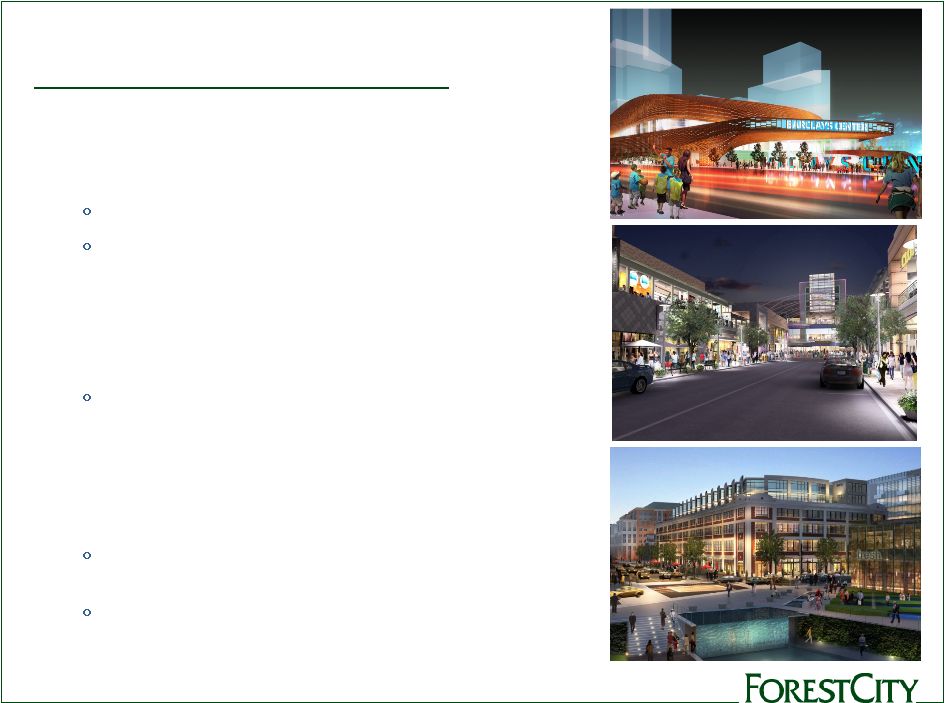 Under
Construction •
Barclays Center Arena,
Brooklyn
State-of-the-art sports and entertainment venue
Future home of the NBA Nets
First phase of the Atlantic Yards mixed-use project, which
will feature more that 6,400 housing units, approximately
250K s.f. of retail, and more than 8 acres of open space.
•
Westchester’s
Ridge
Hill,
Yonkers,
NY
1.3M s.f. mixed-use retail project
Currently opening in phases, culminating in Lord + Taylor
grand opening of a new 80K s.f store in February 2012.
•
Foundry
Lofts,
Washington,
D.C.
First
residential building at The Yards mixed-use project in Southeast D.C.
170 loft-style apartments in an adaptive reuse of a former
Navy Yard industrial building.
Leasing commenced in August, 2011
14 |
 Value
Creation: University Park, Cambridge 15 |
 Value
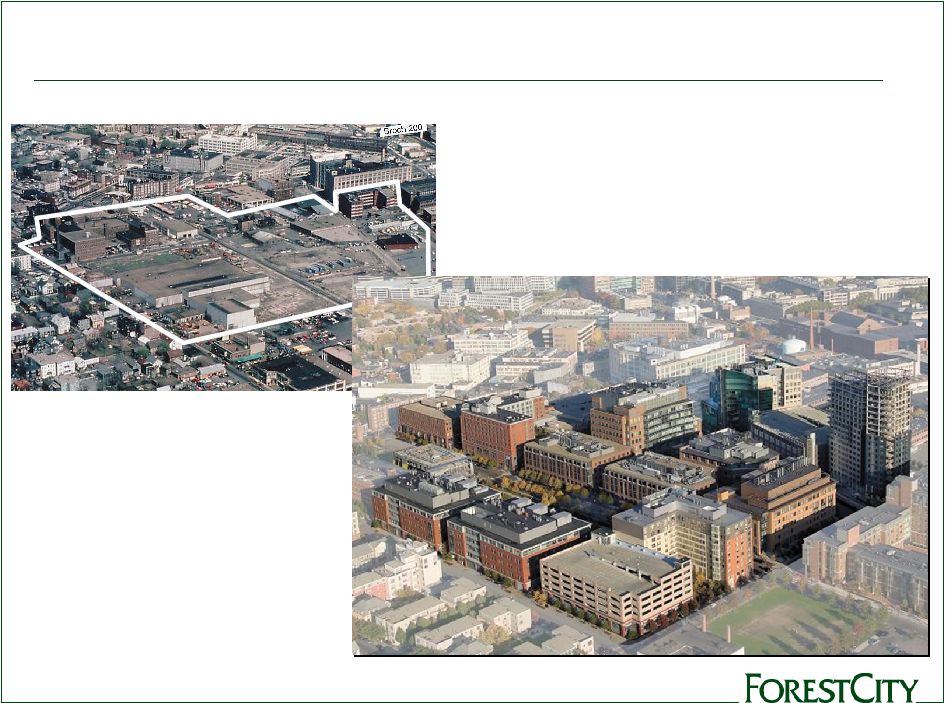
Creation: MetroTech Center, Brooklyn 16 |
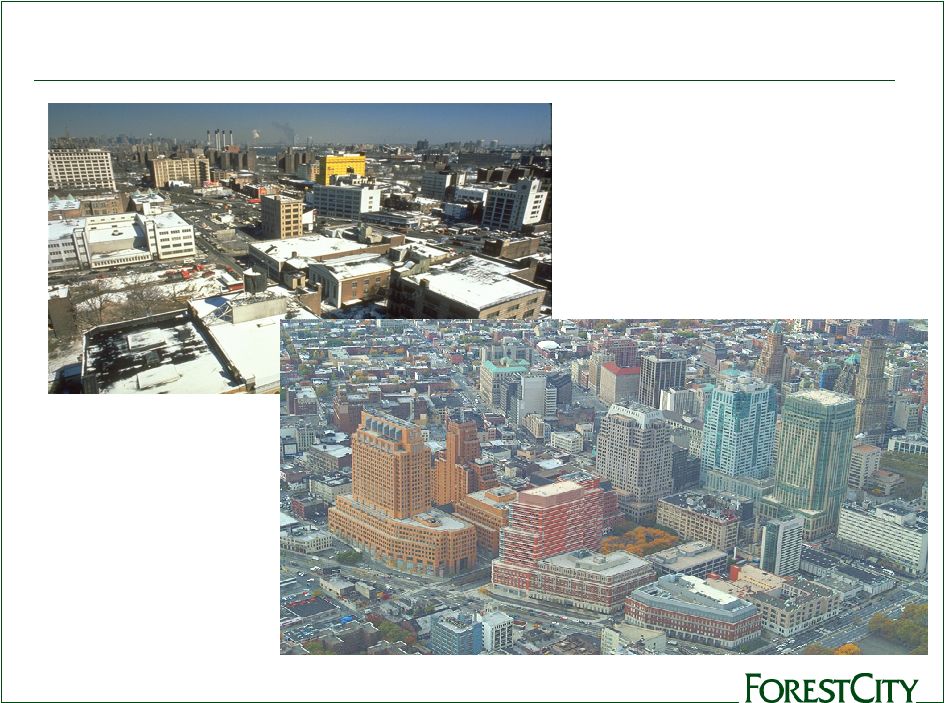
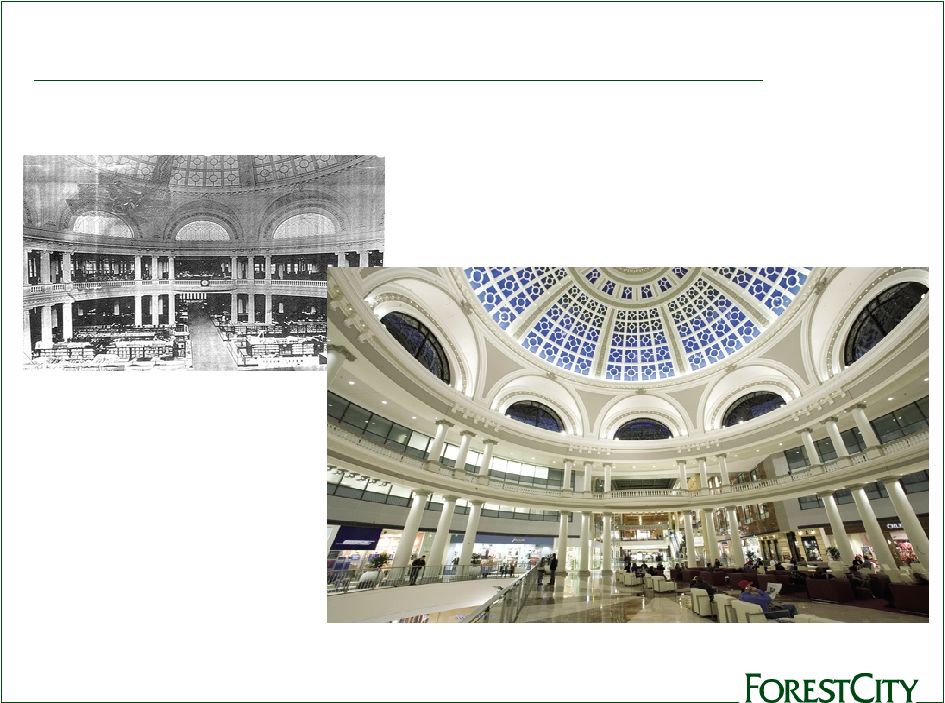 Value
Creation: San Francisco Centre 17 |
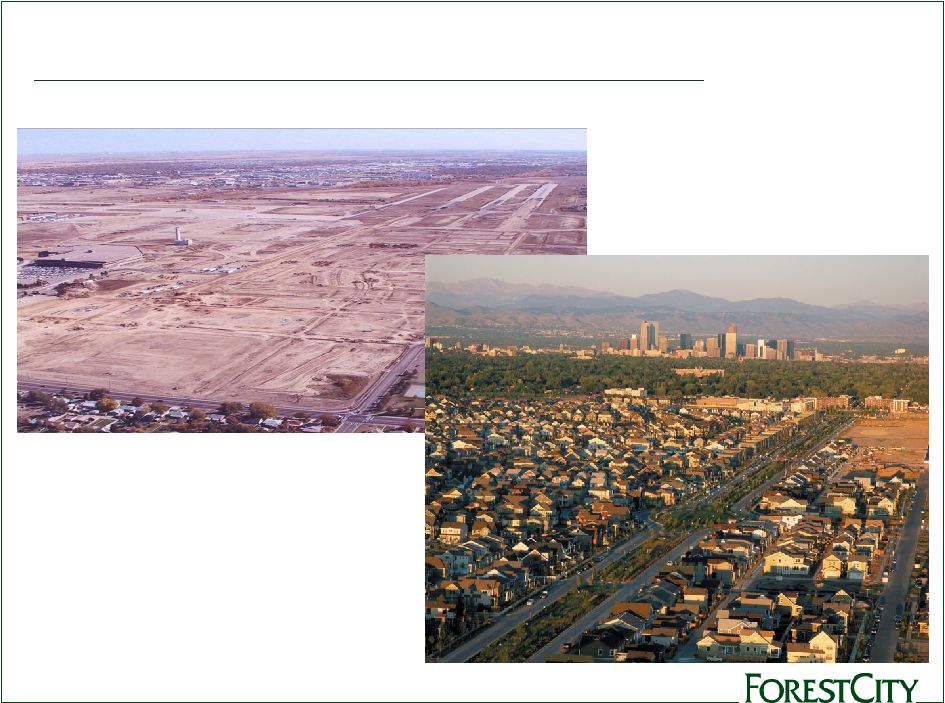 Value
Creation: Stapleton, Denver 18 |
 Appendix
2012-2015 Strategic Plan
20
Asset Sales
21
Recourse Debt Maturities
22
Lease Expirations
23
Pipeline
25
Sustainability
32
19 |
 2012-2015
Strategic Plan Key Themes:
•
Increase shareholder value by:
Greater
focus
on
the
core,
both
markets
and
products
Continuing
to
improve
the
balance
sheet
and
reduce risk
Driving
operational
excellence
through
all
aspects
of our company
20 |
 Asset
Sales ($ in millions)
21
Cash
Net
Annualized
Cap
EBDT Year
EBDT/
Count
Proceeds
Sales Price
NOI
rate
Prior to Sale
Proceeds
Leverage
Total (10 Yr + YTD 2011: 2001-2011)
95
1,274.5
3,070.7
205.6
6.7%
97.0
7.6%
58%
Total (10 Yr: 2001-2010)
76
1,033.0
2,426.6
163.0
6.7%
73.6
7.1%
57%
Total (7 Yr: 2004-2010)
62
932.3
2,168.4
142.0
6.5%
63.4
6.8%
57%
Total (5 Yr: 2006-2010)
45
728.6
1,644.1
109.9
6.7%
50.3
6.9%
56% |
 Addressing
Recourse Debt Maturities 22 |
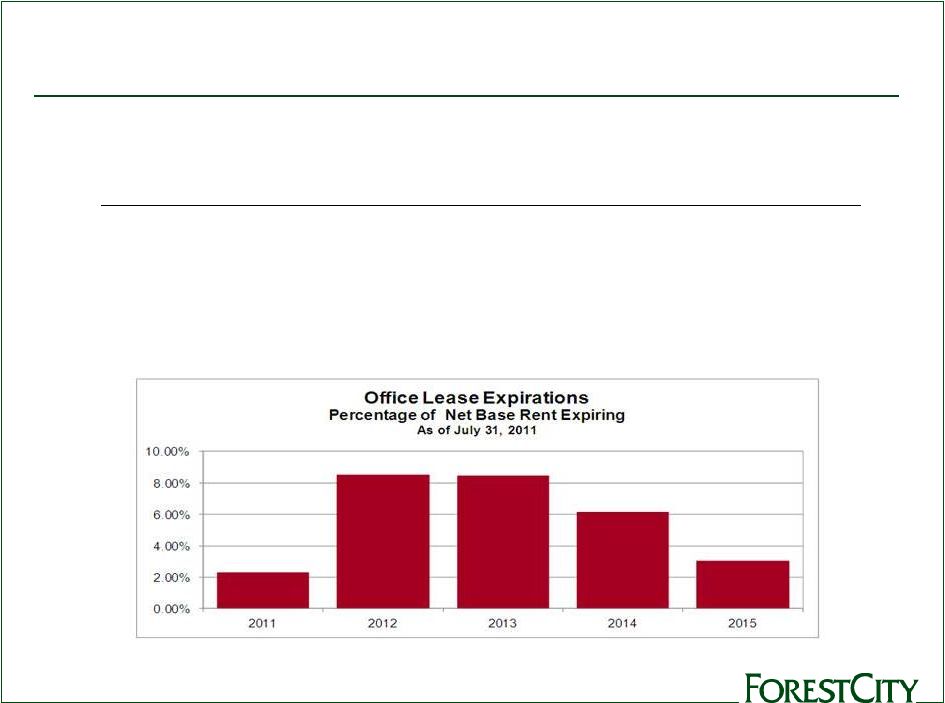 Office Lease
Expirations (as of July 31, 2011) 23
Expiration
Year
Number of
Expiring
Leases
Square Feet of
Expiring Leases
Percentage of
Total Leased
GLA
Net
Base Rent
Expiring
Percentage of
Total Base Rent
Average Base
Rent Per Square
Feet Expiring
2011
53
363,105
3.27 %
$
6,853,161
2.33 %
$
19.93
2012
92
989,473
8.91
25,054,936
8.50
31.42
2013
92
1,162,933
10.48
24,912,299
8.46
22.29
2014
63
968,391
8.72
18,067,606
6.13
30.44
2015
44
480,655
4.33
8,882,261
3.02
21.28 |
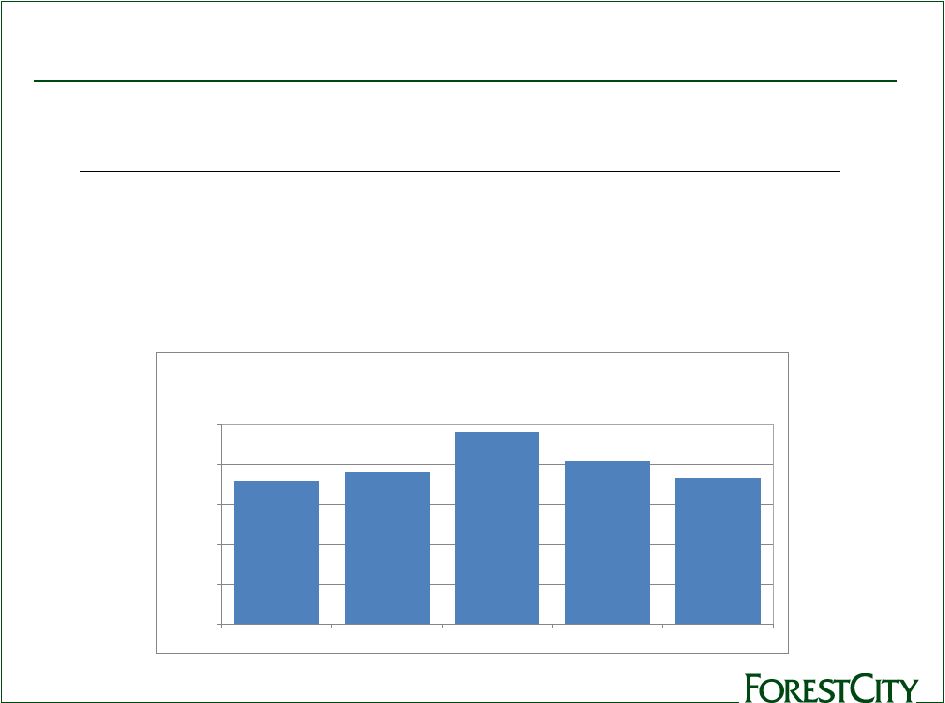 Retail Lease
Expirations (as of July 31, 2011) 24
0.00%
2.00%
4.00%
6.00%
8.00%
10.00%
2011
2012
2013
2014
2015
Retail Lease Expirations
Percentage of Net Base Rent Expiring
As of July 31, 2011
Expiration
Year
Number of
Expiring
Leases
Square Feet of
Expiring Leases
Percentage of
Total Leased
GLA
Net
Base Rent
Expiring
Percentage of
Total Base Rent
Average Base
Rent Per Square
Feet Expiring
2011
250
778,326
6.11 %
$
18,207,261
7.21 %
$
30.45
2012
271
950,123
7.46
19,349,688
7.66
27.94
2013
308
1,128,314
8.86
24,321,749
9.63
27.20
2014
258
1,107,037
8.69
20,677,933
8.19
27.39
2015
203
832,758
6.54
18,533,723
7.34
29.29 |
 Pipeline:
Projects Opened or Acquired 25
Note:
See
pages
33
-
34
in
the
Supplemental
Package
for
the
quarter
ended
July
31,
2011
for
footnotes.
Openings and Acquisitions as of July 31, 2011
Cost at FCE
Date
Pro-Rata
Cost at Full
Total Cost
Pro-Rata Share
Sq. ft./
Gross
Dev (D)
Opened /
FCE Legal
FCE % (a)
Consolidation
at 100%
(Non-GAAP) (c)
No. of
Leasable
Property
Location
Acq (A)
Acquired
Ownership % (a)
(1)
(GAAP) (b)
(2)
(1) X (2)
Units
Area
2011 (2)
Retail Centers:
Westchester's Ridge Hill (d)
Yonkers, NY
D
Q2-11/12
70.0%
100.0%
$
0.0 0.0
$
0.0 176,000
176,000
Residential:
Manhattan, NY
D
Q1-11/12
35.7%
51.0%
$
0.0 0.0
$
0.0 682
(in millions)
$
$
8 Spruce Street (leasable units only) (d) (f) |
 Pipeline:
Projects Under Construction 26
Note:
See
page
33
-
34
in
the
Supplemental
Package
for
the
quarter
ended
July
31,
2011
for
footnotes.
Projects Under Construction as of July 31, 2011 (4)
Projects Under Construction Subsequent to July 31, 2011 (2)
Cost at FCE
Pro-Rata
Cost at Full
Total Cost
Pro-Rata Share
Sq. ft./
Gross
Anticipated
FCE Legal
FCE % (a)
Consolidation
at 100%
(Non-GAAP) (c)
No. of
Leasable
Lease
Property
Location
Opening
Ownership % (a)
(1)
(GAAP) (b)
(2)
(1) X (2)
Units
Area
Commitment %
Retail Centers:
Westchester's Ridge Hill (e)
Yonkers, NY
Q2-11/12
70.0%
100.0%
842.4
$
842.4
$
842.4
$
1,336,000
1,336,000
(l)
52%
Residential:
8 Spruce Street (f) (j)
Manhattan, NY
Q1-11/12
35.7%
51.0%
0.0
875.7
$
446.6
$
903
51% (m)
Foundry Lofts
Washington, D.C.
Q3-11
100.0%
100.0%
61.4
61.4
61.4
170
61.4
$
937.1
$
508.0
$
1,073
Arena:
Barclays Center
Brooklyn, NY
Q3-12
33.8% (n)
33.8%
(n)
904.3
$
904.3
$
305.9
$
670,000
18,000 seats
(o)
56% (p)
Total Under Construction (k)
1,808.1
$
2,683.8
$
1,656.3
$
Fee Development:
Sq.ft.
Las Vegas City Hall
Las Vegas, NV
Q1-12
-
(q)
-
(q)
$
0.0
146.2
$
$
0.0 270,000
(in millions)
Retail Centers:
The Yards -
Boilermaker Shop
Washington, D.C.
Q3-12
100.0%
100.0%
19.4
$
19.4
$
19.4
$
41,000
41,000
73% (r)
Residential:
Novella Apartments
Denver, CO
Q3-12
90.0%
90.0%
10.1
$
10.1
$
9.1
$
85
Total Projects Under Construction Subsequent to July 31, 2011
29.5
$
29.5
$
28.5
$
$ |
 Pipeline:
Equity Requirements 27
Equity
Requirements
for
Projects
Under
Construction
(a)
As of July 31, 2011
Less
Plus
Unconsolidated
Full
Less
Unconsolidated
Pro-Rata
Investments
Consolidation
Noncontrolling
Investments
Consolidation
100%
at 100%
(GAAP) (b)
Interest
at Pro-Rata
(Non-GAAP) (c)
Total Cost Under Construction
2,683.8
$
875.7
$
1,808.1
$
598.4
$
446.6
$
1,656.3
$
Total Loan Draws and Other Sources
at Completion (d)
1,668.2
539.0
1,129.2
376.5
263.1
1,015.8
Net Equity at Completion
1,015.6
336.7
678.9
221.9
183.5
640.5
Net Costs Incurred to Date
(e)
1,870.4
734.5
1,135.9
281.7
382.8
1,237.0
Loan Draws and Other Sources to Date
(e)
935.3
424.4
510.9
59.8
225.8
676.9
Net Equity to Date
(e)
935.1
310.1
625.0
221.9
157.0
560.1
% of Total Equity
92%
92%
87%
Remaining Costs
813.4
141.2
672.2
316.7
63.8
419.3
Remaining Loan Draws and Other Sources
732.9
114.6
618.3
316.7
37.3
338.9
Remaining Equity
80.5
$
26.6
$
53.9
$
-
$
26.5
$
80.4
$
% of Total Equity
8%
8%
13%
(dollars in millions)
(a)
This schedule includes only the four properties listed on the previous
page. This does not include costs associated with phased-in units, operating property renovations and military housing.
(b)
Amounts are presented on the full consolidation method of accounting, a
GAAP measure. Under full consolidation, costs are reported as consolidated at 100 percent if we are deemed to have control
or to be the primary beneficiary of our investments in the variable
interest entity ("VIE"). (c)
Cost at pro-rata share represents Forest City's share of cost,
based on the Company's pro-rata ownership of each property (a non-GAAP measure). Under the pro-rata consolidation method of
accounting the Company determines its pro-rata share by multiplying
its pro-rata ownership by the total cost of the applicable property.
(d)
"Other Sources" includes estimates of third party subsidies and
tax credit proceeds. The timing and the amounts may differ from our estimates.
(e)
Reflects activity through July 31, 2011
|
 Projects
Opened or Acquired: prior two years 28
Note:
See
page
33
-
34
in
the
Supplemental
Package
for
the
quarter
ended
July
31,
2011
for
footnotes.
Cost at FCE
Date
Pro-Rata
Cost at Full
Total Cost
Pro-Rata Share
Sq. ft./
Gross
Dev (D)
Opened /
FCE Legal
FCE % (a)
Consolidation
at 100%
(Non-GAAP) (c)
No. of
Leasable
Lease
Property
Location
Acq (A)
Acquired
Ownership % (a)
(1)
(GAAP) (b)
(2)
(1) X (2)
Units
Area
Commitment %
Prior Two Years Openings
(7)
Retail Centers:
Village at Gulfstream Park (f)
Hallandale Beach, FL
D
Q1-10
50.0%
50.0%
0.0
198.9
$
99.5
$
511,000
511,000
70%
East River Plaza (f)
Manhattan, NY
D
Q4-09/Q2-10
35.0%
50.0%
0.0
390.6
195.3
527,000
527,000
90%
Promenade in Temecula Expansion
Temecula, CA
D
Q1-09
75.0%
100.0%
113.4
113.4
113.4
127,000
127,000
89%
113.4
$
702.9
$
408.2
$
1,165,000
1,165,000
Office:
Waterfront Station
-
East 4th & West 4th Buildings (g)
Washington, D.C.
D
Q1-10
45.0%
45.0%
245.9
$
245.9
$
110.7
$
631,000
99%
Residential: (h)
Presidio Landmark
San Francisco, CA
D
Q3-10
100.0%
100.0%
96.5
$
96.5
$
96.5
$
161
70% (r)
North Church Towers
Parma Heights, OH
A
Q3-09
100.0%
100.0%
5.1
5.1
5.1
399
86%
DKLB BKLN (f)
Brooklyn, NY
D
Q4-09/Q2-10
40.8%
51.0%
0.0
161.8
82.5
365
96%
101.6
$
263.4
$
184.1
$
925
Total Prior Two Years Openings (i)
460.9
$
1,212.2
$
703.0
$
Recap of Total Prior Two Years
Openings Total 2010
342.4
$
931.9
$
502.0
$
Total 2009
118.5
280.3
201.0
Total Prior Two Years Openings (i)
460.9
$
1,212.2
$
703.0
$
$ |
 Projects Under
Development (full descriptions) 29
Projects Under Development
As of July 31, 2011
Below is a summary of our active large scale development projects,
which have yet to commence construction, often referred to as
our "shadow pipeline" which are crucial to our long-
term growth. While we cannot make any assurances on the timing or
delivery of these projects, our track record speaks to our ability to bring large, complex, projects to fruition when
there is demand and available construction financing. The
projects listed below represent pro-rata costs of $738.1 million ($918.2 million at full consolidation) of Projects Under
Development ("PUD") on our balance sheet and pro-rata
mortgage debt of $145.2 million ($184.7 million at full consolidation).
1)
Atlantic
Yards
-
Brooklyn,
NY
Atlantic Yards is adjacent to the state-of-the art arena, the
Barclays Center, which is designed by the award-winning firms Ellerbe Becket and SHoP Architects and is currently under
construction. In addition, Atlantic Yards will feature more than
6,400 units of housing, including over 2,200 affordable units,
approximately 250,000 square feet of retail space, and more than
8 acres of landscaped open space. 2)
LiveWork
Las
Vegas
-
Las
Vegas,
NV
LiveWork Las Vegas is a mixed-use project on a 13.5-acre parcel
in downtown Las Vegas. At full build-out, the project will have a new 260,000-square-foot City Hall for Las Vegas
and is also expected to include up to 1 million square feet of office
space and approximately 300,000 square feet of retail. The City
Hall is owned by the city of Las Vegas and is a fee-
development project.
3)
The
Yards
-
Washington,
D.C.
The Yards is a 42-acre mixed-use project, located in the
neighborhood of the Washington Nationals baseball park in Southeast D.C. The full development is expected to include up to
2,700 residential units, 1.8 million square feet of office space, and
300,000 square feet of retail and dining space. The Yards
features a 5.5-acre publicly funded public park that is a
gathering place and recreational focus for the community. The
first residential building, Foundry Lofts, which is under construction and expected to open in Q3-11.
4) The Science + Technology Park at Johns Hopkins -
Baltimore, MD
The 31-acre Science + Technology Park at Johns Hopkins is a new
center for collaborative research directly adjacent to the world-renowned Johns Hopkins medical and research
complex. Initial plans call for 1.1 million square feet in
five buildings, with future phases that could support additional
expansion. In 2008, the Company opened the first of those
buildings, 855 North Wolfe Street, a 279,000-square-foot office
building anchored by the Johns Hopkins School of Medicine’s Institute for Basic Biomedical Sciences.
5) Colorado Science + Technology Park at Fitzsimons -
Aurora, CO
The 184-acre Colorado Science + Technology Park at Fitzsimons is
becoming a hub for the biotechnology industry in the Rocky Mountain region. Anchored by the University of
Colorado at Denver Health Science Center, the University of Colorado
Hospital and The Denver Children’s Hospital, the park will offer cost-effective lease rates; build-to-suit office and
research sites; and flexible lab and office layouts in a
cutting-edge research park. The park is also adjacent to Forest City’s 4,700-acre Stapleton mixed-used development.
6) Waterfront Station -
Washington, D.C.
Located in Southwest Washington, D.C., Waterfront Station is adjacent
to the Waterfront/Southeastern University MetroRail station. Waterfront Station is expected to include 660,000
square feet of office space, an estimated 400 residential units and
40,000 square feet of stores and restaurants. 7) 300 Massachusetts
Avenue - Cambridge, MA
Located in the science and technology hub of Cambridge, MA, the 300
Massachusetts Avenue block represents an expansion of University Park @ MIT. In a 50/50 partnership with
MIT, Forest City is presently focused on a project that reflects
a development program of approximately 260,000 square feet of lab and
office space. Potential redevelopment of the entire block is
possible with the acquisition of adjacent parcels in future phases, and would result in an approximately 400,000
square foot project. |
 Military
Housing 30
Military Housing as of July 31, 2011
Anticipated
FCE
Cost at Full
Total Cost
No.
Property
Location
Opening
Pro-Rata %
Consolidation
at 100%
of Units
Military Housing -
Openings (2)
Navy, Hawaii Increment III
Honolulu, HI
2007-Q1-11
*
$
0.0 464.8
$
2,520
Marines, Hawaii Increment II
Honolulu, HI
2007-Q2-11
*
0.0
292.7
1,175
Total Openings
$
0.0 757.5
$
3,695
Military Housing Under Construction (5)
Pacific Northwest Communities
Seattle, WA
2007-2011
*
$
0.0 280.5
$
2,985
Navy Midwest
Chicago, IL
2006-2012
*
0.0
200.3
1,401
Midwest Millington
Memphis, TN
2008-2012
*
0.0
33.1
318
Air Force Academy
Colorado Springs, CO
2007-2013
50.0%
0.0
69.5
427
Hawaii Phase IV
Kaneohe, HI
2007-2014
*
0.0
475.1
1,141
Total Under Construction
$
0.0 1,058.5
$
6,272
Total Military Housing
$
0.0 1,816.0
$
9,967
* The Company's share of residual cash flow ranges from 0-20%
during the life cycle of the project. Commitment executed
(in millions)
Below
is
a
summary
of
our
equity
method
investments
for
Military
Housing
Development
projects.
The
Company
provides
development,
construction
and
management
services
for
these
projects
and
receives
agreed
upon
fees
for
these
services.
The
following
phases
still
have
a
percentage
of
units
opened
and
under
construction:
Air
Force
–
Southern
Group
was
awarded
on
August
30,
2010.
This
project
is
expected
to
include
2,185
end
state
units
at
four
Air
Force
bases
in
Sumter,
SC,
Manchester,
TN,
Charleston,
SC
and
Biloxi,
MS.
There
are
330
financially
excluded
units
that
will
not
be
encumbered
by
debt
and
which
may
be
removed
from
the
end
state
at
the
sole
discretion
of
the
Air
Force.
The
financial
closing
of
the
project
was
executed
on
September
30,
2011,
with
property
management
and
construction
beginning
on
October
1,
2011.
Development
fees
related
to
our
military
housing
projects
are
earned
based
on
a
contractual
percentage
of
the
actual
development
costs
incurred.
We
also
recognize
additional
development
incentive
fees
upon
successful
completion
of
certain
criteria,
such
as
incentives
to
realize
development
cost
savings,
encourage
small
and
local
business
participation,
comply
with
specified
safety
standards
and
other
project
management
incentives
as
specified
in
the
development
agreements.
NOI
from
development
and
development
incentive
fees
is
$788,000
and
$1,925,000
for
the
three
and
six
months
ended
July
31,
2011
respectively,
and
$1,705,000
and
$3,318,000
for
the
three
and
six
months
ended
July
31,
2010,
respectively.
Construction
management
fees
are
earned
based
on
a
contractual
percentage
of
the
actual
construction
costs
incurred.
We
also
recognize
certain
construction
incentive
fees
based
upon
successful
completion
of
certain
criteria
as
set
forth
in
the
construction
contracts.
NOI
from
construction
and
incentive
fees
is
$738,000
and
$1,918,000
for
the
three
and
six
months
ended
July
31,
2011,
respectively,
and
$1,465,000
and
$3,060,000
recognized
during
the
three
and
six
months
ended
July
31,
2010,
respectively.
Property
management
and
asset
management
fees
are
earned
based
on
a
contractual
percentage
of
the
annual
net
rental
income
and
annual
operating
income,
respectively,
that
is
generated
by
the
military
housing
privatization
projects
as
defined
in
the
agreements.
We
also
recognize
certain
property
management
incentive
fees
based
upon
successful
completion
of
certain
criteria
as
set
forth
in
the
property
management
agreements.
Property
management,
management
incentive
and
asset
management
fees
generated
NOI
of
$2,418,000
and
$5,647,000
during
the
three
and
six
months
ended
July
31,
2011,
respectively,
and
$3,120,000
and
$6,242,000
during
the
three
and
six
months
ended
July
31,
2010,
respectively. |
 Land
Holdings 31
Land Held for Development or Sale as of July 31, 2011
Gross
Saleable
Option
Location
Acres (1)
Acres (2)
Acres (3)
Stapleton -
Denver, CO
213
141
1,358
Mesa del Sol -
Albuquerque, NM
3,011
1,647
5,731
Central Station -
Chicago, IL
30
30
-
Texas
2,798
1,553
-
North Carolina
1,225
1,001
788
Ohio
967
652
470
Arizona
663
489
-
Other
884
698
-
Total
9,791
6,211
8,347
The Land Development Group acquires and sells raw land and sells
fully-entitled developed lots to residential, commercial, and industrial customers.
The Land Development Group also owns and develops raw land into
master-planned communities, mixed-use projects and other residential developments.
Below is a summary of our large Land Development Group projects.
(1) Represent all acres currently owned including those used for
roadways, open spaces and parks. (2) Saleable acres represent the total of all acres currently owned
that will be available for sales. The Land Development Group may choose to
further develop some of the acres into completed sublots prior to sale. (3) Option acres are those acres that the Land Development Group has a
formal option to acquire. Typically these options are in the form of
purchase agreements with contingencies for the satisfaction of due diligence reviews. |
 Sustainability
at Forest City 32
•
Leadership
30+ projects certified or seeking certification (LEED, Energy Star, others)
Approx. 17% of total portfolio is certified (based on cost at pro-rata)
A leader in breath of LEED certifications by project type:
•
New Construction
•
Existing Buildings
•
Core & Shell
•
Neighborhood Development
•
Homes
•
Value-add
Leveraging portfolio opportunities for energy generation/sale, reduced cost
Forest City included in Calvert Social Index since September, 2010
•
Commitment
A core value since 2003
Dedicated Energy & Sustainability Group provides enterprise-wide direction
Accountability and verification –
all projects prepare a sustainability “scorecard” |
 End
33 |