Attached files
| file | filename |
|---|---|
| 8-K - FORM 8-K - Cooper-Standard Holdings Inc. | d256608d8k.htm |
 Cooper Standard 3Q 2011
Third Quarter 2011 Earnings Call
November 15, 2011
Exhibit 99.1 |
 cooperstandard
Introduction & Agenda
•
Introduction:
Glenn
Dong,
Treasurer
•
Executive
Overview:
Jim
McElya,
CEO
•
Business
Highlights:
Keith
Stephenson,
COO
•
Financial
Review
&
Updated
Guidance:
Allen
Campbell,
CFO
•
Questions & Answers
2 |
 cooperstandard
Safe Harbor
3
This presentation includes forward-looking statements, reflecting current
analysis and expectations, based on what are believed to be reasonable
assumptions. Forward-looking statements may involve known and unknown risks,
uncertainties and other factors, which may cause actual results to differ
materially from those projected, stated or implied, depending on many
factors, including, without limitation: the inability to compare the company’s financial
condition
or
results
historically
due
to
fresh
start
accounting;
the
ability
to
maintain
contracts
and
suppliers
and
customer relationships; limitations on flexibility in operating our business
contained in our debt agreements; our dependence on the automotive industry;
availability and cost of raw materials; our exposure to natural disasters; our
dependence on certain major customers; competition in the automotive industry;
sovereign and other risks related to our conducting operations outside the
United States; the uncertainty of our ability to achieve expected cost
reduction savings; our exposure to product liability and warranty claims; labor
conditions; our vulnerability to changes
in
interest
rates;
our
ability
to
meet
customers’
needs
for
new
and
improved
products
in
a
timely
manner;
our ability to attract and retain key personnel; potential conflicts of interest
between our owners and us; our legal rights to our intellectual property
portfolio; our pension plans; and environmental and other regulations. There may
be other factors that may cause the company’s actual results to differ
materially from those projected in any forward-looking statement.
Accordingly, there can be no assurance that Cooper Standard will meet future results,
performance or achievements expressed or implied by such forward-looking
statements. This paragraph is included to provide a safe harbor for
forward-looking statements, which are not generally required to be publicly revised as
circumstances change and which Cooper Standard does not intend to update.
There may be other factors that may cause the company’s actual results to
differ materially from those projected in any forward-looking
statements. Cooper Standard undertakes no obligation to update or revise forward-looking
statements to reflect events or circumstances that arise after the date such
statements were made or to reflect the occurrence of unanticipated events.
|
 cooperstandard
Safe Harbor
4
In addition to historical information, certain statements contained herein are
forward-looking statements within the meaning of federal securities
laws, and Cooper Standard Automotive (Cooper Standard) intends that such forward-
looking statements be subject to the safe-harbor created thereby. These
forward-looking statements include statements concerning the
company’s plans, objectives, goals, strategies, future events, future revenue or
performance, capital expenditures, financing needs, plans or intentions relating to
acquisitions, business trends, the impact of
“fresh-start” accounting, the impact of the company’s
bankruptcy on its future performance and other information
that
is
not
historical
information.
When
used
herein,
the
words
“estimates,”
“expects,”
“anticipates,”
“projects,”
“plans,”
“intends,”
“believes,”
“forecasts,”
or
future
or
conditional
verbs,
such
as
“will,”
“should,”
“could,”
or “may,”
and variations of such words or similar expressions are intended to identify
forward-looking statements. All forward-looking statements,
including, without limitation, management’s examination of historical operating
trends and data, are based upon Cooper Standard’s current expectations and
various assumptions. Cooper Standard’s expectations, beliefs and
projections are expressed in good faith and Cooper Standard believes there is
a reasonable basis for them. However, no assurances can be made that these
expectations, beliefs and projections will be achieved. Forward-looking
statements are not guarantees of future performance and are subject to
significant risks and uncertainties that may cause actual results or achievements to be materially different from
the future results or achievements expressed or implied by the forward-looking
statements. |
 Jim
McElya Chairman & CEO
Executive Overview
3Q 2011 |
 cooperstandard
Executive Overview:
Third Quarter 2011 Review
•
Continued revenue and earnings growth:
–
3Q sales growth of 21%
–
3Q adjusted EBITDA margin of 10.4%
•
Resulting from:
–
Increase in North American volumes
–
FMEA joint venture agreement
–
Favorable lean savings impact
•
Offsetting:
–
Higher raw material costs
–
Unfavorable FX contracts
6 |
 cooperstandard
7
Executive Overview:
Industry Trends
•
Detroit 3 Union contracts ratified
•
North American volumes holding strong
•
Softness in Europe and South America
•
Raw materials remain challenging
•
Japanese OEMs continue slow recovery |
 cooperstandard
Executive Overview:
Strategic Progress
•
Growth strategy confirmed
•
Technology investments
•
Footprint continues to expand
8 |
 Business Highlights
3Q 2011
Keith Stephenson
Chief Operating Officer |
 cooperstandard
10
Business Highlights
•
Managing specific market challenges
•
Further expansion in emerging markets
•
Increasing value add for sealing product line
•
Business wins
–
Awards in 3Q |
 cooperstandard
11
Continued Expansion in Emerging Markets
Craiova, Romania
Chennai, India
Nakornratchasima, Thailand
Sao Paulo, Brazil |
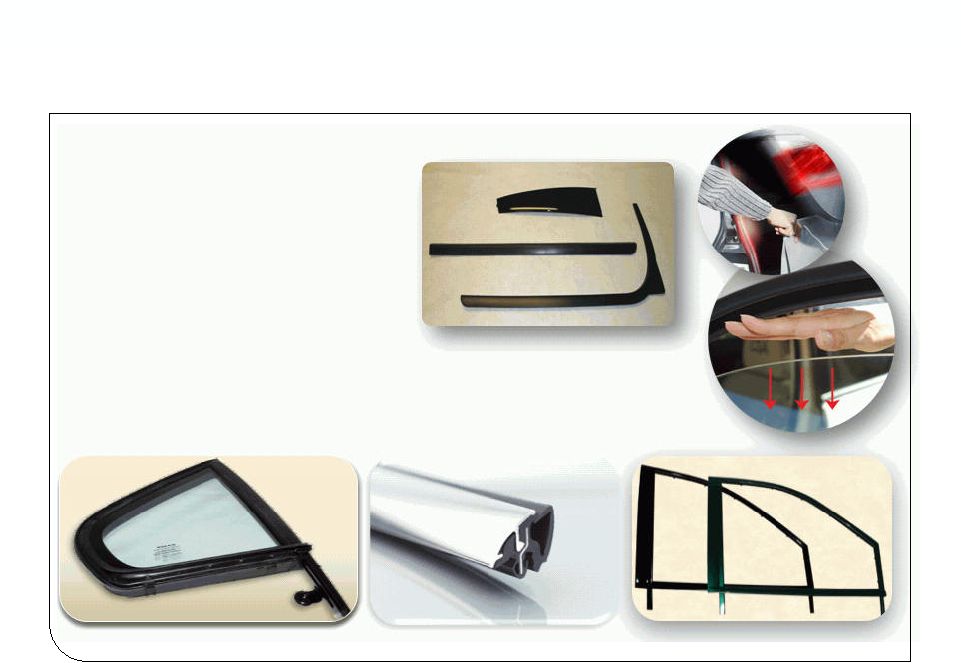 cooperstandard
Increased Value Add Sealing Systems
12
•
Hardcoat Trim
•
Bright Trim
•
Glass Encapsulation
•
Obstacle Detection System (ODS) |
 cooperstandard
Business Wins Featuring New Technology
13
Product
Application
Throttle Valve
High Feature V-6 Engine
New Generation Pump
Global Electric Vehicle
Fuel Rails
North American Truck Program
Glass Run Seals
Top Selling European Vehicle
Obstacle Detection Systems
Commercialized Application in Europe and
North America |
 Financial Overview
3Q 2011
Allen Campbell
Chief Financial Officer |
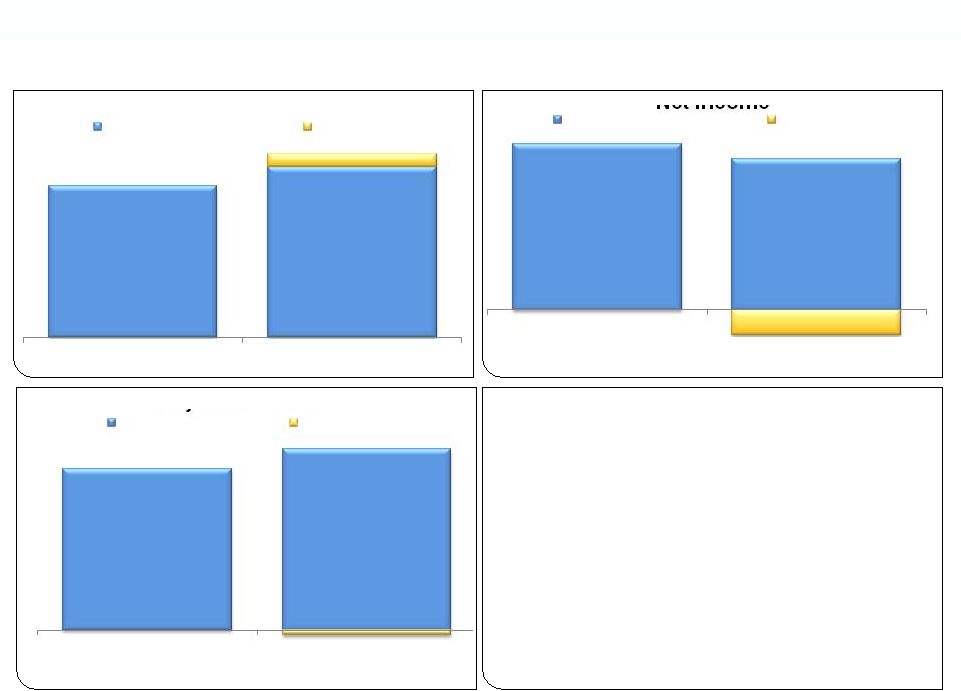
 cooperstandard
3Q and Year-to-Date 2011 Performance
15
$ Millions
Q3 2010
Q3 2011
Net Sales
$585.7
$708.5
Operating Profit
$ 28.8
$ 33.7
Gross Profit
$102.1
$ 108.6
YTD 2010
YTD 2011
$1,810.4
$2,157.8
$ 116.5
$ 102.3
$ 312.8
$ 353.0
Net Income
$ 20.8
$ 15.7
$ 305.5
$ 79.6
Adjusted EBITDA
(excluding qtr. one times)
$ 73.4
$ 214.8
$ 257.5
$ 67.2
% Margin
10.4%
11.9%
11.5%
11.9%
SGA
$ 68.6
$ 64.4
$ 183.8
$ 190.9 |
 cooperstandard
EBITDA and Adjusted EBITDA Reconciliation
16
$ USD Millions
2010
2011
Net Income
$305.5
$ 79.6
Provision for income tax expense
45.3
EBITDA
$482.1
$ 228.6
Restructuring*
7.1
48.1
Adjusted EBITDA
$ 214.8
$ 257.5
26.8
9 Months Ended September 30
Net interest expense
58.7
30.2
Depreciation and amortization
72.6
92.0
Inventory write-up
3.8
Stock compensation
8.3
EDITDA and Adjusted EBITDA are Non-GAAP measures. Reference comments on slide 21
*Net of Minority Interest impact in France JV
Non-controlling interest restructuring
(19.0)
Acquisition Costs
--
2.2
--
Net gain on partial sale of joint venture
8.1
0.7
--
(11.4)
Reorganization/fresh start
(303.4)
--
Foreign exchange losses
17.1
--
3 Months Ended September 30
3Q -
2011
$15.7
8.0
$65.0
6.5
$ 73.4
9.6
31.7
3.0
0.2
(1.3)
--
--
--
--
th
th |
 cooperstandard
Cash Flow 3Q 2011
17
Cash balance as of June 30
313.5
$
Cash generated
(27.2)
Cash balance as of September 30
286.3
$
($ in Millions)
Q3 - 2011
YTD - 2011
Cash from business
43.0
$
146.1
$
Pension funding
(2.9)
(31.4)
Changes in operating assets & liabilities
(20.8)
(68.9)
Cash from operations
19.3
$
45.8
$
Capital expenditures
(24.8)
(70.3)
Cash from operations less CAPEX
(5.5)
$
(24.5)
$
Acquisition of business, plus cash acquired
-
30.9
Proceeds from partial sale of joint venture
-
16.0
Investment in affiliate
(10.5)
(10.5)
Dividends
(1.8)
(5.4)
Financing activities
(5.1)
(7.7)
Foreign exchange/other
(4.3)
(7.0)
Net cash used
(27.2)
$
(8.2)
$
|
 cooperstandard
18
3Q 2011 Comparisons
Reported
Same Quarter Prior
Year
Reported
Noteworthy Items
FX on Sales
$28.5
FX Swing
$ 8.2
Unrealized Loss on JV Forward Contract
$ 5.5
Raw Material Prices
$51.1
$708.5
$(3.2)
$15.7
$(2.2)
$73.4
Same Quarter Prior
Year
Net Sales
Net Income
Adjusted EBITDA
$585.7
$657.4
Same Quarter Prior Year
Reported
Legacy Business
Acquisitions
$67.2
$75.6
Legacy Business
Acquisitions
$20.8
$18.9
Legacy Business
Acquisitions |
 cooperstandard
19
2011 Guidance -
Reaffirmed
•
Sales: $2.8 billion -
$2.9 billion
•
Capital
expenditures:
$100
million
-
•
Cash
restructuring:
$50
million
-
$60 million
•
Cash
taxes:
$25
million
-
$30 million
$110
million |
 cooperstandard
Non-GAAP Financial Measures
20
Management considers EBITDA and adjusted EBITDA as key indicators of the
Company’s operating performance and believes that these and similar measures
are widely used by investors, securities analysts and other interested
parties in evaluating the Company’s performance. Adjusted EBITDA is
defined as net income adjusted to reflect income tax expense, interest
expense net of interest income, depreciation and amortization and certain
non-recurring items that management does not consider to be reflective
of the Company’s core operating performance. When analyzing the
Company’s operating performance, investors should use EBITDA and
adjusted EBITDA in addition to, and not as alternatives for, net income,
operating income, or any other performance measure derived in accordance with
GAAP, or as an alternative to cash flow from operating activities as a
measure of the Company’s performance. EBITDA and adjusted EBITDA have
limitations as analytical
tools
and
should
not
be
considered
in
isolation
or
as
substitutes
for
analysis of the Company’s results of operations as reported under GAAP. Other
companies may report EBITDA and adjusted EBITDA differently and therefore
Cooper Standard’s results may not be comparable to other similarly
titled measures of other companies. In addition, in evaluating adjusted
EBITDA, it should be noted that
in
the
future
Cooper
Standard
may
incur
expenses
similar
to
or
in
excess
of
the
adjustments in the above presentation. This presentation of adjusted EBITDA
should not be construed as an inference that Cooper Standard’s future results
will be unaffected by unusual or non-recurring items.
|
 Questions & Answers |
 cooperstandard
3Q 2011 Summary
•
Continue to successfully navigate changing
business environment
•
Strong organic growth due to rising volumes
and increased efficiency
•
Effectively managing raw material costs
•
Acquisitions and investments position us well
globally
22 |