Attached files
| file | filename |
|---|---|
| EXCEL - IDEA: XBRL DOCUMENT - UNITED MORTGAGE TRUST | Financial_Report.xls |
| EX-31.1 - EXHIBIT 31.1 - UNITED MORTGAGE TRUST | v237873_ex31-1.htm |
| EX-31.2 - EXHIBIT 31.2 - UNITED MORTGAGE TRUST | v237873_ex31-2.htm |
UNITED STATES
SECURITIES AND EXCHANGE COMMISSION
Washington, D.C. 20549
FORM 10-Q
x QUARTERLY REPORT PURSUANT TO SECTION 13 OR 15(d) OF
THE SECURITIES EXCHANGE ACT OF 1934
For the quarterly period ended September 30, 2011
o TRANSITION REPORT PURSUANT TO SECTION 13 OR 15(d) OF
THE SECURITIES EXCHANGE ACT OF 1934
For the transition period from _________ to _________
Commission file number: 000-32409
UNITED MORTGAGE TRUST
(Exact name of registrant as specified in its charter)
|
Maryland
|
75-6493585
|
|
(State or other jurisdiction of incorporation or organization)
|
(I.R.S. Employer Identification No.)
|
1301 Municipal Way, Suite 220
Grapevine, Texas 76051
(Address of principal executive offices)(Zip Code)
(214) 237-9305
(Registrant’s telephone number, including area code)
Indicate by check mark whether the registrant (1) has filed all reports required to be filed by Section 13 or 15(d) of the Securities Exchange Act of 1934 during the preceding 12 months (or for such shorter period that the registrant was required to file such reports), and (2) has been subject to such filing requirements for the past 90 days. Yes x No o
Indicate by check mark whether the registrant has submitted electronically and posted on its corporate Web site, if any, every Interactive Data File required to be submitted and posted pursuant to Rule 405 of Regulation S-T (Section 232.405 of this chapter during the preceding 12 months (or for such shorter period that the registrant was required to submit and post such files). Yes x No o
Indicate by check mark whether the registrant is a large accelerated filer, an accelerated filer, a non-accelerated filer, or a smaller reporting company. See the definitions of “large accelerated filer,” “accelerated filer” and “smaller reporting company” in Rule 12b-2 of the Exchange Act
Large accelerated filer o Accelerated filer o Non-accelerated filer o (Do not check if a smaller reporting company)
x Smaller Reporting Company
Indicate by check mark whether the registrant is a shell company (as defined in Rule 12b-2 of the Exchange Act)
Yes o No x
The number of shares outstanding of the Registrant’s shares of beneficial interest, par value $0.01 per share, as of the close of business on November 14, 2011 was 6,437,615.
UNITED MORTGAGE TRUST
INDEX
PART I - FINANCIAL INFORMATION
|
Page
|
||
|
ITEM 1.
|
Financial Statements
|
|
|
Consolidated Balance Sheets as of September 30, 2011 (unaudited) and December 31, 2010
|
3
|
|
|
Consolidated Statements of Income for the three months and nine months ended September 30, 2011 and September 30, 2010 (unaudited)
|
4
|
|
|
Consolidated Statements of Cash Flows for the nine months ended September 30, 2011 and September 30, 2010 (unaudited)
|
5
|
|
|
Notes to Consolidated Financial Statements (unaudited)
|
7
|
|
|
ITEM 2.
|
Management’s Discussion and Analysis of Financial Condition and Results of Operations
|
17
|
|
ITEM 3.
|
Quantitative and Qualitative Disclosures about Market Risk
|
34
|
|
ITEM 4T.
|
Controls and Procedures
|
34
|
|
PART II - OTHER INFORMATION
|
||
|
ITEM 1.
|
Legal Proceedings
|
35
|
|
ITEM 2.
|
Unregistered Sales of Equity Securities and Use of Proceeds
|
35
|
|
ITEM 3.
|
Defaults Upon Senior Securities
|
35
|
|
ITEM 4.
|
Removed and Reserved
|
35
|
|
ITEM 5.
|
Other Information
|
36
|
|
ITEM 6.
|
Exhibits
|
36
|
|
Signatures
|
38
|
|
2
UNITED MORTGAGE TRUST
CONSOLIDATED BALANCE SHEETS
|
September 30,
2011
|
December 31,
2010
|
|||||||
|
(unaudited)
|
(audited)
|
|||||||
|
Assets
|
||||||||
|
Cash and cash equivalents
|
$ | 255,885 | $ | 7,325 | ||||
|
Mortgage investments:
|
||||||||
|
Investment in trust receivable
|
1,127,998 | 1,243,638 | ||||||
|
Investment in residential mortgages
|
4,943,125 | 5,557,396 | ||||||
|
Interim mortgages, affiliates
|
17,177,638 | 24,638,389 | ||||||
|
Interim mortgages
|
35,886 | 248,585 | ||||||
|
Allowance for loan losses
|
(446,636 | ) | (459,361 | ) | ||||
|
Total mortgage investments
|
22,838,011 | 31,228,647 | ||||||
|
Line of credit receivable, affiliates
|
78,297,066 | 69,714,261 | ||||||
|
Line of credit receivable
|
3,921,643 | 4,755,129 | ||||||
|
Accrued interest receivable
|
1,172,263 | 981,994 | ||||||
|
Accrued interest receivable, affiliates
|
5,632,907 | 12,721,070 | ||||||
|
Reserves – accrued interest receivable
|
(2,075,881 | ) | (1,399,431 | ) | ||||
|
Recourse obligations, affiliates
|
18,370,968 | 18,321,173 | ||||||
|
Real estate owned, net
|
12,101,412 | 15,980,479 | ||||||
|
Deficiency notes
|
7,726,890 | 7,301,046 | ||||||
|
Deficiency note, affiliates
|
31,039,719 | 12,739,093 | ||||||
|
Allowance for loan losses – deficiency notes
|
(4,667,746 | ) | (4,517,746 | ) | ||||
|
Other assets
|
325,650 | 340,504 | ||||||
|
Total assets
|
$ | 174,938,787 | $ | 168,173,544 | ||||
|
Liabilities and Shareholders’ Equity
|
||||||||
|
Liabilities:
|
||||||||
|
Dividend payable
|
$ | 310,000 | $ | 310,000 | ||||
|
Lines of credit payable
|
5,329,725 | 4,407,989 | ||||||
|
Accounts payable and accrued liabilities
|
1,015,522 | 1,046,462 | ||||||
|
Accounts payable and accrued liabilities, affiliates
|
1,505,986 | 2,958,808 | ||||||
|
Participation payable, affiliate
|
65,503,661 | 57,050,973 | ||||||
|
Notes payable
|
1,619,849 | 1,275,665 | ||||||
|
Total liabilities
|
75,284,743 | 67,049,897 | ||||||
|
Commitments and contingencies
|
||||||||
|
Shareholders' equity:
|
||||||||
|
Shares of beneficial interest; $0.01 par value; 100,000,000 shares authorized; 8,318,632 and 8,299,766 shares issued in 2011 and 2010, respectively; and 6,435,568 and 6,426,563 outstanding in 2011 and 2010, respectively
|
83,145 | 82,971 | ||||||
|
Additional paid-in capital
|
147,060,959 | 146,817,612 | ||||||
|
Cumulative distributions in excess of earnings
|
(11,043,436 | ) | (9,485,280 | ) | ||||
| 136,100,668 | 137,415,303 | |||||||
|
Less treasury stock of 1,883,064 and 1,873,203 shares in 2011 and 2010, respectively, at cost
|
(36,446,624 | ) | (36,291,656 | ) | ||||
|
Total shareholders' equity
|
99,654,044 | 101,123,647 | ||||||
|
Total liabilities and shareholders' equity
|
$ | 174,938,787 | $ | 168,173,544 | ||||
See accompanying notes to consolidated financial statements.
3
UNITED MORTGAGE TRUST
CONSOLIDATED STATEMENTS OF INCOME
(unaudited)
|
Three Months Ended September 30,
|
Nine Months Ended September 30,
|
|||||||||||||||
|
2011
|
2010
|
2011
|
2010
|
|||||||||||||
|
Revenues:
|
||||||||||||||||
|
Interest income, affiliates
|
$ | 929,513 | $ | 952,985 | $ | 2,928,375 | $ | 4,590,716 | ||||||||
|
Interest income
|
317,164 | 429,119 | 1,009,297 | 1,278,603 | ||||||||||||
| 1,246,677 | 1,382,104 | 3,937,672 | 5,869,319 | |||||||||||||
|
Expenses:
|
||||||||||||||||
|
Trust administration fee – related party
|
249,999 | 289,159 | 749,997 | 844,994 | ||||||||||||
|
Loan servicing fee – related party
|
5,257 | 7,760 | 17,255 | 18,015 | ||||||||||||
|
General and administrative
|
283,980 | 329,290 | 917,470 | 1,250,426 | ||||||||||||
|
General and administrative – related party
|
18,972 | 18,972 | 56,916 | 56,916 | ||||||||||||
|
Provision for loan losses
|
180,000 | 302,576 | 540,000 | 991,406 | ||||||||||||
|
Interest expense
|
140,562 | 104,941 | 363,466 | 270,962 | ||||||||||||
|
Interest expense – related parties
|
20,250 | 15,278 | 54,779 | 50,000 | ||||||||||||
| 899,020 | 1,067,976 | 2,699,883 | 3,482,719 | |||||||||||||
|
Net income
|
$ | 347,657 | $ | 314,128 | $ | 1,237,789 | $ | 2,386,600 | ||||||||
|
Net income per share of beneficial interest
|
$ | 0.05 | $ | 0.05 | $ | 0.19 | $ | 0.37 | ||||||||
|
Weighted average shares outstanding
|
6,434,600 | 6,422,762 | 6,431,835 | 6,421,945 | ||||||||||||
|
Distributions per weighted share outstanding
|
$ | 0.14 | $ | 0.15 | $ | 0.43 | $ | 0.44 | ||||||||
See accompanying notes to consolidated financial statements.
4
UNITED MORTGAGE TRUST
CONSOLIDATED STATEMENTS OF CASH FLOWS
(unaudited)
|
Nine Months Ended September 30,
|
||||||||
|
2011
|
2010
|
|||||||
|
Operating Activities
|
||||||||
|
Net income
|
$ | 1,237,789 | $ | 2,386,600 | ||||
|
Adjustments to reconcile net income to net cash provided
|
||||||||
|
by operating activities:
|
||||||||
|
Provision for loan losses
|
540,000 | 991,406 | ||||||
|
Depreciation and amortization
|
5,783 | 1,782 | ||||||
|
Changes in assets and liabilities:
|
||||||||
|
Accrued interest receivable, net
|
(603,103 | ) | 19,880 | |||||
|
Accrued interest receivable, affiliates, net
|
(1,015,477 | ) | (1,793,578 | ) | ||||
|
Other assets
|
9,069 | 137,600 | ||||||
|
Accounts payable and accrued liabilities
|
(30,938 | ) | (550,384 | ) | ||||
|
Accounts payable and accrued liabilities, affiliates
|
560,374 | 546,681 | ||||||
|
Net cash provided by operating activities
|
703,497 | 1,739,987 | ||||||
|
Investing Activities
|
||||||||
|
Investments in trust receivables
|
- | (85,977 | ) | |||||
|
Principal receipts on trust receivables
|
115,640 | 782,941 | ||||||
|
Investments in residential mortgages
|
(124,000 | ) | (1,162,602 | ) | ||||
|
Principal receipts on residential mortgages
|
725,546 | 463,658 | ||||||
|
Investment in interim mortgages and deficiency notes
|
(41,575 | ) | (2,372,509 | ) | ||||
|
Principal receipts on interim mortgages and deficiency notes
|
324,555 | 53,715 | ||||||
|
Investments in interim mortgages and deficiency notes, affiliates
|
(2,024,034 | ) | (548,645 | ) | ||||
|
Principal receipts on interim mortgages and deficiency notes, affiliates
|
396,905 | 9,662,225 | ||||||
|
Investments in recourse obligations, affiliates
|
(55,528 | ) | (1,941,014 | ) | ||||
|
Principal receipts from recourse obligations, affiliates
|
5,733 | 53,501 | ||||||
|
Principal investments in lines of credit receivable, affiliates
|
(1,371,214 | ) | (2,580,684 | ) | ||||
|
Principal receipts from lines of credit receivable
|
833,486 | 2,442,347 | ||||||
|
Investments in real estate owned
|
(1,156,809 | ) | (9,859,752 | ) | ||||
|
Principal receipts from real estate owned
|
3,357,829 | 3,414,608 | ||||||
|
Net cash provided by (used in) investing activities
|
986,534 | (1,678,188 | ) | |||||
|
Financing Activities
|
||||||||
|
Proceeds from issuance of shares of beneficial interest
|
295,754 | 423,364 | ||||||
|
Net borrowings on lines of credit payable
|
921,735 | 2,557,739 | ||||||
|
Proceeds from notes payable, net
|
344,185 | 168,477 | ||||||
|
Purchase of treasury stock
|
(207,200 | ) | (429,115 | ) | ||||
|
Dividends
|
(2,795,945 | ) | (2,800,460 | ) | ||||
|
Net cash used by financing activities
|
(1,441,471 | ) | (79,995 | ) | ||||
|
Net increase (decrease) in cash and cash equivalents
|
248,560 | (18,196 | ) | |||||
|
Cash and cash equivalents at beginning of period
|
7,325 | 338,336 | ||||||
|
Cash and cash equivalents at end of period
|
$ | 255,885 | $ | 320,140 | ||||
See accompanying notes to consolidated financial statements.
5
UNITED MORTGAGE TRUST
CONSOLIDATED STATEMENTS OF CASH FLOWS (continued)
(unaudited)
|
Nine Months Ended September 30,
|
||||||||
|
2011
|
2010
|
|||||||
|
Supplemental Disclosure of Cash Flow Information
|
||||||||
|
Cash paid during the period for interest
|
$ | 306,915 | $ | 272,638 | ||||
|
Noncash Activity:
|
||||||||
|
Transfers of affiliate and non-affiliate loans to foreclosed properties or recourse obligations
|
296,100 | 8,073,332 | ||||||
|
Participation receivable, affiliate
|
(8,452,688 | ) | (3,282,492 | ) | ||||
|
Participation payable, affiliate
|
8,452,688 | 3,282,492 | ||||||
|
Participation accrued interest receivable, affiliate
|
2,013,196 | (5,321,645 | ) | |||||
|
Participation accrued interest payable, affiliate
|
(2,013,196 | ) | 5,321,645 | |||||
|
Accrued interest receivable, affiliate
|
7,179,727 | - | ||||||
|
Interim mortgages and deficiency notes, affiliate
|
(7,179,727 | ) | - | |||||
|
Interim mortgages and deficiency notes, affiliate
|
9,097,808 | - | ||||||
|
Interim mortgages and deficiency notes, affiliate
|
(9,097,808 | ) | - | |||||
|
Investments in interim mortgages and deficiency notes
|
(496,125 | ) | - | |||||
|
Receipts from real estate owned
|
496,125 | - | ||||||
See accompanying notes to consolidated financial statements.
6
UNITED MORTGAGE TRUST
NOTES TO CONSOLIDATED FINANCIAL STATEMENTS
(unaudited)
|
1.
|
Nature of Business
|
United Mortgage Trust (the “Company”) is a Maryland real estate investment trust that qualifies as a real estate investment trust (a “REIT”) under federal income tax laws. The Company’s principal investment objectives are to invest proceeds from our dividend reinvestment plan, financing proceeds, proceeds from the repayment of our loans, capital transaction proceeds and retained earnings in the following types of investments: (i) first lien secured interim mortgage loans with initial terms of 12 months or less for the acquisition and renovation of single-family homes, which we refer to as “Interim Loans”; (ii) secured, line of credit to UMTH Lending Company, L.P. (“UMTHLC”) for origination of Interim Loans; (iii) lines of credit and secured loans for the acquisition and development of single-family home lots, referred to as “Land Development Loans”; (iv) lines of credit and loans secured by developed single-family lots, referred to as “Finished Lot Loans”; (v) lines of credit and loans secured by completed model homes, referred to as “Model Home Loans”; (vi) loans provided to entities that have recently filed for bankruptcy protection under Chapter 11 of the U.S. bankruptcy code, secured by a priority lien over pre-bankruptcy secured creditors, referred to as “Debtor in Possession Loans”, (vii) lines of credit and loans, with terms of 18 months or less, secured by single family lots and homes constructed thereon, referred to as “Construction Loans”; (viii) first lien secured mortgage loans with terms of 12 to 360 months for the acquisition of single-family homes, referred to as “Residential Mortgages”, and, (ix) discounted cash flows secured by assessments levied on real property. We collectively refer to the above listed loans as “Mortgage Investments”. Additionally, our portfolio includes obligations of affiliates of our Advisor, which we refer to as “recourse loans” and “deficiency notes.”
The Company has no employees. The Company pays a monthly trust administration fee to UMTH General Services, L.P. (“UMTHGS” or “Advisor”), a subsidiary of UMT Holdings, L.P. (“UMTH”), a Delaware real estate finance company and affiliate, for the services relating to its daily operations. The Company’s offices are located in Grapevine, Texas.
|
2.
|
Basis of Presentation
|
The consolidated financial statements include the accounts of the Company and certain wholly-owned subsidiaries and all significant intercompany accounts and transactions have been eliminated. In the opinion of management, all adjustments (consisting of normal recurring adjustments) considered necessary for a fair presentation have been included. These consolidated financial statements have been prepared in accordance with accounting principles generally accepted in the United States (“GAAP”) for interim financial information and with the instructions for Form 10-Q and Article 10 of Regulation S-X adopted by the Securities and Exchange Commission. Accordingly, the financial statements do not include all of the information and footnotes required by GAAP for complete financial statements and should be read in conjunction with our consolidated financial statements, and notes thereto, for the year ended December 31, 2010, included in our Annual Report on Form 10-K filed with the SEC on March 31, 2011. Operating results for the nine months ended September 30, 2011, are not necessarily indicative of the results that may be expected for the year ended December 31, 2011. Certain prior period amounts have been reclassified to conform to current period presentation.
|
3.
|
Deficiency Notes – Affiliate and Non-Affiliate
|
The Company has made loans in the normal course of business to affiliates and non-affiliates, the proceeds from which have been used to originate underlying loans that are pledged to the Company as security for such obligations. When principal and interest on an underlying loan is due in full, at maturity or otherwise, the corresponding obligation owed by the originating company to the Company is also due in full. If the borrower or the Company foreclosed on property securing an underlying loan, or if the Company foreclosed on property securing a purchased loan, and the proceeds from the sale were insufficient to pay the loan in full, the originating company had the option of (1) repaying the outstanding balance owed to the Company associated with the underlying loan or purchased loan, as the case may be, or (2) delivering to the Company an unsecured deficiency note in the amount of the deficiency.
7
As of September 30, 2011 and December 31, 2010, the Company had two deficiency notes with non-affiliates in the amount of approximately $7,727,000 and $7,301,000, respectively. The Company has recorded reserves of approximately $4,668,000 and $4,518,000 against these notes as of September 30, 2011 and December 31, 2010, respectively. These notes do not accrue interest as the underlying collateral value approximates the note balance, net of reserves.
As of December 31, 2007, UMTHLC issued to the Company a variable amount promissory note in the amount of $5,100,000 to evidence its deficiency obligations to the Company. The initial principal amount of the note was approximately $1,848,000. The principal balance will fluctuate from time to time based on the underlying loan activity and the amount of deficiencies realized by the affiliate. The note bears interest at a rate of 10%, and requires monthly principal and interest payments based on a ten-year amortization for the outstanding principal balance. The note is secured by a limited guaranty by UMTHGS, the Advisor, equal to a monthly amount not to exceed 33% of the advisory fee received by UMTHGS under the terms of its advisory agreement with the Company. Effective June 30, 2010 the general and limited partners of UMT Holdings, L.P. (“UMTH”), an affiliate of the Advisor, executed the Second Amendment and Restatement (“The Amendment”) of the UMT Holdings, L.P. Agreement of Limited Partnership. The amendment gives the Company second priority for distributions of the partnership’s available cash behind only the 0.1% allocation due to the general partner as security for UMTH’s obligations under the UMTHLC Deficiency Note, was given second priority behind only the 0.1% portion due to the general partner. Effective January 2011, the deficiency note was modified and the interest rate was reduced from 10% to 6%. The principal balance as of September 30, 2011 and December 31, 2010 was approximately $31,040,000 and $12,739,000, respectively, primarily as a result of deficiencies associated with the sale of foreclosed properties securing interim loans.
|
4.
|
Related Party Transactions
|
1) UMT Holdings, L.P. (“UMTH”) is a Delaware limited partnership which is in the real estate finance business. UMTH holds a 99.9% limited partnership interest in UMTH Lending Company, L.P., which originates interim loans that the Company is assigned, UMTH Land Development, L.P., which holds a 50% profit interest in United Development Funding (“UDF”) and acts as UDF's asset manager, and Prospect Service Corp. (“PSC”), which services the Company’s residential mortgages and contracts for deed and manages the Company’s real estate owned (“REO”). In addition, UMTH has a limited guarantee of the obligations of Capital Reserve Group (“CRG”), Ready America Funding Corp (“RAFC”), and South Central Mortgage, Incorporated (“SCMI”), a Texas corporation that sold mortgage investments to the Company, under the Secured Notes. United Development Funding III, L.P., (“UDF III”) which is managed by UMTH Land Development, L.P., has previously provided a limited guarantee of the UDF line of credit and has purchased an economic participation in a revolving credit facility we have provided to UDF.
2) UMTHLC is a Delaware limited partnership, and subsidiary of UMTH. The Company has loaned money to UMTHLC so it can make loans to its borrowers. The loans are collaterally assigned to the Company, as security for the promissory note between UMTHLC and the Company. The unpaid principal balance of the loans at September 30, 2011 and December 31, 2010 was approximately $7,659,000 and $15,566,000, respectively.
On March 26, 2009, the Company executed a secured line of credit promissory note with UMTH Lending, Company, L.P. in the amount of $8,000,000. The note bears interest at 12.50% per annum, matures on March 26, 2012 and is secured by first lien mortgage interests in single family residential properties. The outstanding balance on this line of credit at September 30, 2011 and December 31, 2010 was approximately $6,930,000 and $7,520,000, respectively, and is included in the balances noted in the paragraph above.
See Note 3 above for discussion of additional related party transactions with UMTHLC.
3) Capital Reserve Group, Inc. (“CRG”) is a Texas corporation that is 50% owned by Todd Etter and William Lowe, partners of UMTH, which owns the Advisor. CRG was in the business of financing home purchases and renovations by real estate investors. The Company loaned money to CRG to make loans to other borrowers. During 2006 the Company took direct assignment of the remaining loans from CRG with full recourse.
8
4) RAFC is a Texas corporation that is 50% owned by SCMI, which is owned by Todd Etter. RAFC is in the business of financing interim loans for the purchase of land and the construction of modular and manufactured single-family homes placed on the land by real estate investors. The Company continues to directly fund obligations under one existing RAFC loan, which was collaterally assigned to the Company, but does not fund new originations. The unpaid principal balance of the loans at September 30, 2011 and December 31, 2010 was approximately $16,449,000 and $16,592,000, respectively.
5) Wonder Funding, LP (“Wonder”) is a Delaware limited partnership that is owned by RMC. RMC is beneficially owned by Craig Pettit, a partner of UMTH and the sole proprietor of two companies that own 50% of RAFC. Wonder is in the business of financing interim loans for the purchase of land and the construction of single family homes and the purchase and renovation of single family homes. The Company has ceased funding any new originations. As of September 30, 2011 and December 31, 2010, respectively, all remaining obligations owed by Wonder to the Company are included in the recourse obligations discussed below.
6) Recourse Obligations. The Company has made recourse loans to (a) CRG, which is a Texas corporation that is 50% owned by Todd Etter and William Lowe, partners of UMTH, which owns the Advisor, (b) RAFC, which is owned by SCMI and two companies owned by Craig Pettit, Eastern Intercorp, Inc. and RMC, and (c) SCMI, which is owned by Todd Etter, (these companies are referred to as the "originating companies"). In addition to the originating companies discussed above, the Company made loans with recourse to Wonder. Each of these entities used the proceeds from such loans to originate loans, that are referred to as "underlying loans," that are pledged to the Company as security for such originating company's obligations to the Company. When principal and interest on an underlying loan are due in full, at maturity or otherwise, the corresponding obligation owed by the originating company to the Company is also due in full.
In addition, some of the originating companies have sold loans to the Company, referred to as the "purchased loans," and entered into recourse agreements under which the originating company agreed to repay certain losses the Company incurred with respect to purchased loans.
If the originating company forecloses on property securing an underlying loan, or the Company forecloses on property securing a purchased loan, and the proceeds from the sale are insufficient to pay the loan in full, the originating company has the option of (1) repaying the outstanding balance owed to the Company associated with the underlying loan or purchased loan, as the case may be, or (2) delivering an unsecured deficiency note in the amount of the deficiency to the Company.
On March 30, 2006, but effective December 31, 2005, the Company and each originating company agreed to consolidate (1) all outstanding amounts owed by such originating company to the Company under the loans made by the Company to the originating company and under the deficiency notes described above and (2) the estimated maximum future liability to the Company under the recourse arrangements described above, into secured promissory notes. Each originating company issued to the Company a secured variable amount promissory note dated December 31, 2005 (the “Secured Notes”) in the principal amounts shown below, which amounts represent all principal and accrued interest owed as of such date. The initial principal amounts are subject to increase if the Company incurs losses upon the foreclosure of loans covered by recourse arrangements with the originating company. The Secured Notes (including related guaranties discussed below) are secured by an assignment of the distributions on the Class C units, Class D units and Class EIA units of limited partnership interest of UMT Holdings held by each originating company.
9
|
Name
|
Initial principal amount
|
Balance at September 30, 2011
|
Promissory Note principal amount (2)
|
Units pledged as security
|
Units remaining
|
Estimated Collateral Value (3)
|
||||||||||||||||||
|
CRG
|
$ | 2,725,442 | $ | 4,470,332 | $ | 4,300,000 |
4,984 Class C and 2,710 Class D
|
2,880 Class C and 2,710 Class D
|
$ | 4,701,000 | ||||||||||||||
|
RAFC
|
$ | 3,243,369 | $ | 8,461,207 | $ | 7,100,000 |
11,165 Class C and 6,659 Class D and 1,066 Class EIA
|
8,391 Class C, 6,659 Class D
and 1,066 EIA
|
$ | 14,162,000 | ||||||||||||||
|
SCMI
|
$ | 3,295,422 | $ | 3,480,792 | $ | 3,488,643 |
4,545 Class and 3,000 Class D
|
3,013 Class C and 3,000 Class D
|
$ | 6,182,000 | ||||||||||||||
|
RAF / Wonder(1)
|
$ | 1,348,464 | $ | 1,958,637 | $ | 1,400,000 |
1,657 Class C
|
1,238 Class C
|
$ | 1,238,000 | ||||||||||||||
|
Wonder Indemnification (1)
|
n/a | n/a | n/a | $ | 1,134,000 | n/a | $ | 822,000 | ||||||||||||||||
|
Totals
|
$ | 10,612,697 | $ | 18,370,968 | $ | 16,288,643 | $ | 27,105,000 | ||||||||||||||||
|
(1)
|
Wonder is collateralized by an indemnification agreement from UMTH in the amount of $1,134,000, and is secured by the pledge of 3,870 C Units from RMC. 2,213 of the pledged C Units also cross-collateralize the RAFC obligation.
|
|
(2)
|
The CRG, RAFC and Wonder balances at September 30, 2011, exceeded the stated principal amount per their variable Secured Notes by approximately $170,000, $1,361,000 and $559,000, respectively. Per the terms of the Secured Notes, the unpaid principal balance may be greater or less than the initial principal amount of the note and is not considered an event of default. The rapid rate of liquidation of the remaining portfolio of properties caused a more rapid increase in the Unpaid Principal Balance (“UPB”) than originally anticipated and outpaced the minimum principal reductions scheduled for the loans.
|
|
(3)
|
Estimated collateral value reflects pledge of C, D and EIA units of limited partnership interest of UMTH held by WLL, Ltd., RAFC and KLA, Ltd. UMTH D units represent equity interests in UMT Holdings, LP. Pledge of the UMTH D units entitles the beneficiary to a pro-rata share of UMTH partnership D unit cash distributions.
|
Through September 2007, the Secured Notes incurred interest at a rate of 10% per annum. The CRG, RAFC, and RAFC/Wonder Secured Notes amortize over 15 years. The SCMI Secured Note amortizes over approximately 22 years, which was the initial amortization of the deficiency notes from SCMI that were consolidated. The Secured Notes required the originating company to make monthly payments equal to the greater of (1) principal and interest amortized over 180 months and 264 months, respectively, or (2) the amount of any distributions paid to the originating company with respect to the pledged Class C and EIA units. Effective, October, 2007, the recourse loans were modified to accommodate the anticipated increases in principal balances throughout the remaining liquidation periods of the underlying assets, suspended the principal component of the amortized loans for the period of July 2007 through June 2009, and reduced the interest rate from 10% to 6%. The above modifications have been extended through December 31, 2011. Management has not recognized any reserves on these loans as the underlying collateral value exceeds the outstanding loan amounts.
10
The Secured Notes have also been guaranteed by the following entities under the arrangements described below, all of which are dated effective December 31, 2005:
|
-
|
UMT Holdings. This guaranty is limited to a maximum of $10,582,336 of all amounts due under the Secured Notes.
|
|
-
|
WLL, Ltd., an affiliate of CRG. This guaranty is of all amounts due under Secured Note from CRG, is non-recourse and is secured by an assignment of 2,492 Class C Units and 1,355 Class D units of limited partnership interest of UMT Holdings held by WLL, Ltd.
|
|
-
|
RMC. This guaranty is non-recourse, is limited to 50% of all amounts due under the Secured Note from RAFC and is secured by an assignment of 3,870 Class C units of limited partnership interest of UMT Holdings.
|
|
-
|
Wonder. Wonder Funding obligations are evidenced by a note from RAFC (RAFC/Wonder Note) and are secured by a pledge of a certain Indemnification Agreement given by UMTH to RAFC and assigned to UMT in the amount of $1,134,000, which amount is included in the UMTH limited guarantee referenced above.
|
|
-
|
SCMC. This guaranty is limited to a maximum of $2,213,000 due under the Secured Note from RAFC and is secured by an assignment of 2,213 Class C units of limited partnership interest of UMT Holdings.
|
|
-
|
KLA, Ltd. KLA has given the following guaranties: (1) Guaranty of obligations of SCMI under the First Amended and Restated Secured Variable Amount Promissory Note to the Company dated as of October 1, 2007 with a then current principal balance of $3,472,073 and is secured by an assignment of 3,000 of Guarantor’s Class D units of partnership interest in UMT Holdings, L.P. (2) Guaranty of obligations of CRG under the First Amended and Restated Secured Variable Amount Promissory Note dated as of October 1, 2007 with a then current principal balance of $4,053,800 and is secured by a pledge of 1,355 of Guarantor’s Class D units of partnership interest in UMT Holdings, L.P.
|
In addition, WLL, Ltd. has obligations to UMT Holdings under an indemnification agreement between UMT Holdings, WLL, Ltd. and William Lowe, under which UMT Holdings is indemnified for certain losses on loans and advances made to William Lowe by UMT Holdings. That indemnification agreement allows UMT Holdings to offset any amounts subject to indemnification against distributions made to WLL, Ltd., with respect to the Class C and Class D units of limited partnership interest held by WLL, Ltd. Because WLL, Ltd. has pledged these Class C and Class D units to the Company to secure its guaranty of Capital Reserve Corp.'s obligations under its Secured Note, UMT Holdings and the Company entered into an Intercreditor and Subordination Agreement under which UMT Holdings has agreed to subordinate its rights to offset amounts owed to it by WLL, Ltd. to the Company’s lien on such units.
These loans were reviewed by management and no reserves are deemed necessary at September 30, 2011.
7) On June 20, 2006, the Company entered into a Second Amended and Restated Secured Line of Credit Promissory Note as modified by an amendment effective September 1, 2006 - (the "Amendment") with UDF, a Nevada limited partnership that is affiliated with the Company's Advisor, UMTHGS. The Amendment increased an existing revolving line of credit facility ("Loan") to $45 million. The purpose of the Loan is to finance UDF's loans and investments in real estate development projects. On July 29, 2009, our trustees approved an amendment to increase the revolving line of credit facility to an amount not to exceed $60,000,000. Effective December 21, 2010, the loan was extended for a period of one year and matures on December 21, 2011 and the loan amount was increased from $60 million to $75 million.
The Loan is secured by the pledge of all of UDF's land development loans and equity investments pursuant to the First Amended and Restated Security Agreement dated as of September 30, 2004, executed by UDF in favor of UMT (the “Security Agreement”). Those UDF loans may be first lien loans or subordinate loans.
The Loan interest rate is the lower of 15% or the highest rate allowed by law, further adjusted with the addition of a credit enhancement to a minimum of 14%.
UDF may use the Loan proceeds to finance indebtedness associated with the acquisition of any assets to seek income that qualifies under the Real Estate Investment Trust provisions of the Internal Revenue Code to the extent such indebtedness, including indebtedness financed by funds advanced under the Loan and indebtedness financed by funds advanced from any other source, including Senior Debt, is no more than 85% of 80% (68%) of the appraised value of all subordinate loans and equity interests for land development and/or land acquisition owned by UDF and 75% for first lien secured loans for land development and/or acquisitions owned by UDF.
11
On September 19, 2008, UMT entered into an Economic Interest Participation Agreement with UDF III pursuant to which UDF III purchased (i) an economic interest in the $45,000,000 revolving credit facility (“Loan”) from UMT to UDF I and (ii) a purchase option to acquire a full ownership participation interest in the Loan (the “Option”). On July 29, 2009, our trustees approved an amendment to increase the revolving line of credit facility to an amount not to exceed $60,000,000. Effective December 21, 2010, the loan was extended for a period of one year and matures on December 21, 2011 and the loan amount was increased from $60 million to $75 million.
Pursuant to the Economic Interest Agreement, each time UDF requests an advance of principal under the UMT Loan, UDF III will fund the required amount to UMT and UDF III’s economic interest in the UMT Loan increases proportionately. Because these advances are funded by UDF III and UMT recognizes an offsetting participation payable amount to UDF III, the Company does not earn any net interest income on the advances made under the Economic Interest Participation Agreement. UDF III’s economic interest in the UMT Loan gives UDF III the right to receive payment from UMT of principal and accrued interest relating to amounts funded by UDF III to UMT which are applied towards UMT’s funding obligations to UDF under the UMT Loan. UDF III may abate its funding obligations under the Economic Participation Agreement at any time for a period of up to twelve months by giving UMT notice of the abatement.
The Option gives UDF III the right to convert its economic interest into a full ownership participation interest in the UMT Loan at any time by giving written notice to UMT and paying an exercise price of $100. The participation interest includes all rights incidental to ownership of the UMT Loan and the Security Agreement, including participation in the management and control of the UMT Loan. UMT will continue to manage and control the UMT Loan while UDF III owns an economic interest in the UMT Loan. If UDF III exercises its Option and acquires a participation interest in the UMT Loan, UMT will serve as the loan administrator but both UDF III and UMT will participate in the control and management of the UMT Loan. At September 30, 2011 and December 31, 2010 UDF III had funded a total of approximately $71,367,000 and $62,303,000, respectively, to UDF under this agreement of which approximately $65,504,000 and $57,051,000 were outstanding under the Economic Interest Participation Agreement at September 30, 2011 and December 31, 2010, respectively.
On June 21, 2010, UDF entered into a new promissory note agreement with a private investor, the proceeds from which were used to pay off the Textron loan agreement in full. Pursuant with this transaction, the Company entered into a second amendment to our subordination and intercreditor agreement which subordinates the UMT loan to the new loan from the private investor, reducing the amount subject to subordination from $30,000,000 to $15,000,000.
8) Loans are made to certain affiliates of the Advisor. Below is a table of the aggregate principal amount of mortgages funded during the quarters ended September 30, 2011 and September 30, 2010, respectively, from the companies affiliated with the Advisor, and named in the table and aggregate amount of draws made by UDF under the line of credit, during the two quarters indicated:
|
Affiliated Company
|
2011
|
2010
|
||||||
|
RAFC
|
— | $ | 549,000 | |||||
|
UMTHLC
|
$ | 651,000 | $ | 1,414,000 | ||||
|
UDF
|
— | $ | 4,778,000 | |||||
9) As of August 1, 2006, (now subject to an Advisory Agreement effective January 1, 2009) the Company entered into an Advisory Agreement with UMTHGS. Under the terms of the agreement, UMTHGS is paid a monthly trust administration fee. The fee is calculated monthly depending on the Company’s annual distribution rate, ranging from 1/12th of 1% up to 1/12th of 2% of the amount of average invested assets per month. During the three months ended September 30, 2011 and September 30, 2010, the net fees paid to the Company’s Advisors were approximately $250,000 and $289,000, respectively. During the nine months ended September 30, 2011 and September 30, 2010, the net fees paid to the Company’s Advisors were approximately $750,000 and $845,000, respectively.
12
The agreement also provides for a subordinated incentive fee equal to 25% of the amount by which the Company’s net income for a year exceeds a 10% per annum non-compounded cumulative return on its adjusted contributions. No incentive fee was paid during 2011 or 2010. In addition, for each year in which it receives a subordinated incentive fee, the Advisor will receive a 5-year option to purchase 10,000 shares at a price of $20.00 per share (not to exceed 50,000 shares). As of September 30, 2011, the Advisor has not received options to purchase shares under this arrangement.
The Advisor and its affiliates are also entitled to reimbursement of costs of materials and services obtained from unaffiliated third parties for the Company’s benefit. During the three months ended September 30, 2011 and September 30, 2010, the Company paid the Advisor approximately $19,000 for costs associated with providing shareholder relations activities. During each of the nine months ended September 30, 2011 and September 30, 2010, the Company paid the Advisor approximately $57,000 as reimbursement for costs associated with providing shareholder relations activities.
The Advisory Agreement provides for the Advisor to pay all of the Company’s expenses and for the Company to reimburse the Advisor for any third-party expenses that should have been paid by the Company but which were instead paid by the Advisor. However, the Advisor remains obligated to pay: (1) the employment expenses of its employees, (2) its rent, utilities and other office expenses and (3) the cost of other items that are part of the Advisor's overhead that is directly related to the performance of services for which it otherwise receives fees from the Company.
The Advisor Agreement also provides for the Company to pay to the Advisor a debt placement fee. The Company may engage the Advisor, or an Affiliate of the Advisor, to negotiate lines of credit on behalf of the Company. UMT shall pay a negotiated fee, not to exceed 1% of the amount of the line of credit secured, upon successful placement of the line of credit. The Company paid a debt placement fee of $43,000 to an affiliate of the Advisor in June 2011. This fee is amortized monthly, as an adjustment to interest expense, over the term of the credit facility agreement described in Note 6.
10) The Company pays loan servicing fees to PSC, a subsidiary of UMTH, under the terms of a Mortgage Servicing Agreement. During the three months ended September 30, 2011 and September 30, 2010, the Company paid loan servicing fees of approximately $5,300 and $7,800, respectively. During the nine months ended September 30, 2011 and September 30, 2010, the Company paid loan servicing fees of approximately $17,300 and $18,000, respectively.
11) The Company paid the first of three annual credit enhancement fees of $50,000 to UDF III, L.P. in September 2009. This fee is due annually on the anniversary date of the loan and amortized over 12 months as an adjustment to interest expense.
The chart below summarizes the approximate payments associated with related parties for the nine months ended September 30, 2011 and 2010:
| For the Nine Months Ended | ||||||||||||||||||
|
Payee
|
Purpose
|
September 30,
2011
|
September 30,
2010
|
|||||||||||||||
|
UMTH GS
|
Trust administration fees
|
$ | 220,000 | 100 | % | $ | 307,000 | 100 | % | |||||||||
| Total trust administration fee – related party | 220,000 | 100 | % | $ | 307,000 | 100 | % | |||||||||||
|
UMTH GS
|
Shareholder relations fees
|
38,000 | 100 | % | 68,000 | 100 | % | |||||||||||
|
PSC
|
Loan servicing fees
|
17,000 | 100 | % | 18,000 | 100 | % | |||||||||||
|
UMTH
|
Debt placement fees
|
43,000 | 46 | % | - | - | ||||||||||||
|
UDF III
|
Credit Enhancement Fees
|
50,000 | 54 | % | - | - | ||||||||||||
| Total debt placement and enhancement fees – related party | $ | 93,000 | 100 | % | $ | - | - | |||||||||||
13
The chart below summarizes the approximate expenses associated with related parties for the nine months ended September 30, 2011 and 2010:
| For the Nine Months Ended | ||||||||||||||||||
|
Payee
|
Purpose
|
September 30,
2011
|
September 30,
2010
|
|||||||||||||||
|
UMTH GS
|
Trust administration fees
|
$ | 750,000 | 100 | % | $ | 845,000 | 100 | % | |||||||||
| Total trust administration fee – related party | 750,000 | 100 | % | $ | 845,000 | 100 | % | |||||||||||
|
UMTH GS
|
Shareholder relations fees
|
57,000 | 100 | % | 57,000 | 100 | % | |||||||||||
|
PSC
|
Loan servicing fees
|
17,000 | 100 | % | 18,000 | 100 | % | |||||||||||
|
UMTH
|
Debt placement fees
|
17,000 | 46 | % | 12,000 | 24 | % | |||||||||||
|
UDF III
|
Credit Enhancement Fees
|
38,000 | 54 | % | 38,000 | 76 | % | |||||||||||
| Total interest expense – related parties | $ | 55,000 | 100 | % | $ | 50,000 | 100 | % | ||||||||||
|
5.
|
Fair Value of Financial Instruments
|
In accordance with the reporting requirements of Accounting Standards Codification (“ASC”) 825, Disclosures About Fair Value of Financial Instruments, the Company calculates the fair value of its assets and liabilities that qualify as financial instruments under this statement and includes additional information in notes to the Company’s consolidated financial statements when the fair value is different than the carrying value of those financial instruments. The estimated fair value of cash equivalents, accrued interest receivable, accrued interest receivable affiliates, accounts payable and accrued liabilities (including affiliates) approximate the carrying value due to the relatively short maturity of these instruments. The carrying value of investments in residential mortgages, interim mortgages (including affiliates), lines of credit (including affiliates), recourse obligations from affiliates, notes payable, deficiency notes (including affiliates) and the Company’s line of credit payable also approximate fair value since these instruments bear market rates of interest. None of these instruments are held for trading purposes.
|
6.
|
Lines of Credit Payable
|
During August 2009, the Company entered into a revolving line of credit facility with a bank for $5,000,000. The line of credit bears interest at prime plus one percent, with a floor of 5.50%, and requires monthly interest payments. Principal and all unpaid interest will be due at maturity, which is August 2012. The line is collateralized by a first lien security interest in the underlying real estate financed by the line of credit. The outstanding balance on this line of credit at September 30, 2011 and December 31, 2010 was approximately $4,051,000 and $4,408,000, respectively. As of September 30, 2011 the Company was not in compliance with its debt covenants; however the Company obtained a waiver letter from the lending institution of its covenant violation and cured the violation in November 2011.
14
In May 2011, the Company entered into a revolving line of credit facility with a bank for $4,300,000. The line of credit bears interest at prime plus 1.50% with a floor of 5.0%, and requires monthly interest payments. Principal and all unpaid interest will be due at maturity, which is May 27, 2014. The line is collateralized by a first lien security interest in the underlying real estate financed by the line of credit. The outstanding balance on this line of credit at September 30, 2011 was approximately $1,175,000.
In August 2011, the Company entered into a revolving line of credit facility with a bank for $250,000. The line of credit bears interest at prime plus 1.50% with a floor of 4.75%, and requires monthly interest payments. Principal and all unpaid interest will be due at maturity, which is August 1, 2012. The line is collateralized by a first lien security interest in the underlying real estate financed by the line of credit. The outstanding balance on this line of credit at September 30, 2011 was approximately $104,000.
|
7.
|
Notes Payable
|
In March, 2010, the Company sold two residential mortgage loans, with full recourse, to unaffiliated investors for approximately $169,000. These sales were accounted for as recourse borrowings. The notes require monthly principal and interest payments at a rate of 9.5% amortized over 30 years with all unpaid principal and interest due at maturity. One loan, with a balance of approximately $70,000, at September 30, 2011, matures on October 1, 2012. The other loan, with a balance of approximately $98,000 on September 30, 2011, matures on May 1, 2014. The total outstanding balance on these notes was approximately $167,000 at September 30, 2011 and December 31, 2010, respectively.
On April 21, 2010, the Company entered into a new term loan credit facility with a bank for $1,600,000. The loan bears interest at prime plus one percent, with a floor of 7.0%, and requires monthly interest payments. Principal and all unpaid interest will be due at maturity which is October 21, 2011. The Company is currently negotiating the renewal of this loan for one year. The loan is collateralized by a first lien security interest in the underlying real estate financed by the loan. The outstanding balance on this loan at September 30, 2011 and December 31, 2010 was approximately $1,107,000.
On January 27, 2011, United Mortgage Trust initiated a private offering of Secured Subordinated Notes (“Notes,” to accredited investors “Note Holders”). The Notes are being offered through a wholly owned subsidiary, UMT Home Finance II, L.P. (“HF II”). HF II is a Delaware limited partnership that was formed on November 29, 2010 as a Special Purpose Entity, for the purpose of originating and holding loans made to fund the acquisition of finished lots and the construction of single-family homes on the subject lots (“Loans”). HF II will issue up to $5 million in 7.5% Notes. The Notes will be secured by an undivided security interest on the pool of loans owned by HF II. The offering of the Notes is not registered under the Securities Act, in reliance upon the exemption from registration for non-public offerings provided by Rule 506 of Regulation D promulgated under the Securities Act of 1933. As of September 30, 2011 approximately $345,000 had been raised. Through November 14, 2011, approximately $395,000 had been raised through this private placement.
|
8.
|
Share Redemption Program
|
There is currently no established public trading market for our shares. As an alternative means of providing limited liquidity for our shareholders, we maintain a Share Redemption Plan, (“SRP”). Our trustees have the discretion to modify or terminate the SRP upon 30 day’s notice. Under the terms of our plan as modified and effective on May 1, 2009 (see below for a further description of the plan modifications), shareholders who have held their shares for at least one year are eligible to request that we repurchase their shares. In any consecutive 12 month period we may not repurchase more than 5% of the outstanding shares at the beginning of the 12 month period. The repurchase price is based on the “Net Asset Value” (NAV) as of the end of the month prior to the month in which the redemption is made. The NAV will be established by our Board of Trustees no less frequently than each calendar quarter. For reference, at September 30, 2011 and December 31, 2010 the NAV was $15.50 and $15.74 per share, respectively. Under the prior SRP terms, the redemption price was $20.00 per share. The Company will waive the one-year holding period ordinarily required for eligibility for redemption and will redeem shares for hardship requests. A “hardship” redemption is (i) upon the request of the estate, heir or beneficiary of a deceased shareholder made within two years of the death of the shareholder; (ii) upon the disability of a shareholder or such shareholder’s need for long-term care, providing that the condition causing such disability or need for long term care was not pre-existing at the time the shareholder purchased the shares and that the request is made within 270 days after the onset of disability or the need for long term care; and (iii) in the discretion of the Board of Trustees, due to other involuntary exigent circumstances of the shareholder, such as bankruptcy, provided that the request is made within 270 days after of the event giving rise to such exigent circumstances. Previously, there was no hardship exemption. Shares will be redeemed quarterly in the order that they are presented. Any shares not redeemed in any quarter will be carried forward to the subsequent quarter unless the redemption request is withdrawn by the shareholder. Previously, shares were redeemed monthly. Repurchases are subject to cash availability and Trustee discretion. Previously, the SRP provided that repurchases were subject to the availability of cash from the DRIP or the Company’s credit line. We have also purchased a limited number of shares outside of our SRP from shareholders with special hardship considerations.
15
Share repurchases have been at prices between $15.58 and $20 per share. Shares repurchased at the lower price were 1) shares held by shareholders for less than 12 months or 2) shares purchased outside of our SRP. Our stated NAV at September 30, 2011 and December 31, 2010 was $15.50 and $15.74 per share, respectively.
The Company complies with Distinguishing Liabilities from Equity topic of FASB Accounting Standards Codification, which requires, among other things, that financial instruments that represent a mandatory obligation of the Company to repurchase shares be classified as liabilities and reported at settlement value. We believe that shares tendered for redemption by the shareholder under the Company’s share redemption program do not represent a mandatory obligation until such redemptions are approved at the discretion of our board of trustees. At such time, we will reclassify such obligations from equity to an accrued liability based upon their respective settlement values. As of September 30, 2011, we had approximately $52,000 of approved redemption requests included in our liabilities. These shares were redeemed in October.
The following table sets forth information relating to shares of beneficial interest repurchased into treasury during the period covered by this report.
|
Month
|
Total number of shares repurchased
|
Average Purchase Price
|
Total number of shares purchased as part of a publicly announced plan
|
Total number of shares purchased outside of plan
|
||||||||||||
|
January
|
2,574 | $ | 15.79 | 2,574 | - | |||||||||||
|
February
|
- | - | - | - | ||||||||||||
|
March
|
- | - | - | - | ||||||||||||
|
April
|
2,516 | $ | 15.74 | 2,516 | - | |||||||||||
|
May
|
893 | $ | 15.67 | 893 | - | |||||||||||
|
June
|
- | - | - | - | ||||||||||||
|
July
|
1,012 | $ | 15.67 | 1,012 | - | |||||||||||
|
August
|
2,505 | $ | 15.67 | 2,505 | - | |||||||||||
|
September
|
361 | $ | 15.58 | 361 | - | |||||||||||
|
Totals
|
9,861 | $ | 15.72 | 9,861 | - | |||||||||||
9. Subsequent Events
On October 26, 2011, the Company entered into a new term loan credit facility with a bank for $5,000,000. The loan bears interest at prime plus one percent, with a floor of 5.0%, and requires monthly interest payments. Principal and all unpaid interest will be due at maturity which is October 26, 2014. The loan is collateralized by a first lien security interest in the underlying real estate financed by the loan.
16
ITEM 2. MANAGEMENT’S DISCUSSION AND ANALYSIS OF FINANCIAL CONDITION AND RESULTS OF OPERATIONS
Cautionary Statement Regarding Forward-Looking Statements
This Form 10-Q contains forward-looking statements within the meaning of Section 27A of the Securities Act of 1933, as amended, and Section 21E of the Securities Exchange Act of 1934, as amended. Such forward-looking statements can generally be identified by our use of forward-looking terminology such as “may,” “will,” “expect,” “intend,” “anticipate,” “estimate,” “believe,” “continue,” or other similar words. Such statements involve known and unknown risks, uncertainties, and other factors which may cause our actual results, performance, or achievements to be materially different from future results, performance or achievements expressed or implied by such forward-looking statements. Such factors include, but are not limited to, the availability of and our ability to find suitable mortgage investments; the difficulties of the real estate industry generally in response to the “sub-prime crisis,” the “credit crisis,” the current downturn in the housing and mortgage industries including the impact thereof on the homebuilding industry, the current economic environment and changes in economic and credit market conditions, changes in interest rates, the difficulties for buyers to obtain financing for housing purchases, our ability to adapt to changing circumstances, the continued financial viability of affiliates to whom we have extended loans, the level of reinvestment of dividends by our shareholders in our dividend reinvestment plan and the requirement to maintain qualification as a real estate investment trust. Although we believe that the assumptions underlying the forward-looking statements contained herein are reasonable, any of the assumptions could be inaccurate, and therefore we cannot give assurance that such statements included in this Form 10-Q will prove to be accurate. In light of the significant uncertainties inherent in the forward-looking statements included herein, the inclusion of such information should not be regarded as a representation by us or by any other person that the results or conditions described in such statements or in our objectives and plans will be realized. Readers should carefully review our financial statements and the notes thereto contained in our Annual Report on Form 10-K for the year ended December 31, 2010, as well as those statements contained in this report, and in our other filings with the Securities and Exchange Commission.
In light of these risks, uncertainties and assumptions, the forward-looking events discussed in this Form 10-Q may not occur. We undertake no obligation to update or revise our forward-looking statements, whether as a result of new information, future events or otherwise.
General Investment Information
United Mortgage Trust (the “Company”) is a Maryland REIT under federal income tax laws. Our principal investment objectives are to invest proceeds from our dividend reinvestment plan, financing proceeds, capital transaction proceeds and retained earnings in following types of investments:
|
(i)
|
first lien secured interim mortgage loans with initial terms of 12 months or less for the acquisition and renovation of single-family homes, which we refer to as “Interim Loans”;
|
|
(ii)
|
secured, subordinate line of credit to UMTH Lending Company, L.P. for origination of Interim Loans;
|
|
(iii)
|
lines of credit and secured loans for the acquisition and development of single-family home lots, referred to as “Land Development Loans”;
|
|
(iv)
|
lines of credit and loans secured by developed single-family lots, referred to as “Finished Lot Loans”;
|
|
(v)
|
lines of credit and loans secured by completed model homes, referred to as “Model Home Loans”;
|
|
(vi)
|
loans provided to entities that have recently filed for bankruptcy protection under Chapter 11 of the US bankruptcy code, secured by a priority lien over pre-bankruptcy secured creditors, referred to as “Debtor in Possession Loans”;
|
|
(vii)
|
lines of credit and loans, with terms of 18 months or less, secured by single family lots and homes constructed thereon, referred to as “Construction Loans”;
|
|
(viii)
|
first lien secured mortgage loans with terms of 12 to 360 months for the acquisition of single-family homes, referred to as “Residential Mortgages”; and
|
|
(ix)
|
discounted cash flows secured by assessments levied on real property.
|
17
We collectively refer to the above listed loans as “Mortgage Investments”. Additionally, our portfolio includes obligations of affiliates of our Advisor, which we refer to as “recourse loans” and deficiency notes. Loans are originated by others to the Company’s specifications or to specifications approved by the Company. Most, if not all, of such loans are not insured or guaranteed by a federally owned or guaranteed mortgage agency.
The following table illustrates the percentage of our mortgage portfolio dedicated to each mortgage loan category as of September 30, 2011 and December 31, 2010:
|
Mortgage Category:
|
September 30,
2011
|
December 31,
2010
|
||||||
|
First lien secured interim mortgages 12 months or less and residential mortgages and contracts for deed
|
21.03 | % | 22.27 | % | ||||
|
Secured interim mortgages and line of credit to UMTHLC
|
8.79 | % | 14.66 | % | ||||
|
Land development loans
|
66.53 | % | 58.59 | % | ||||
|
Finished lot loans
|
1.08 | % | - | |||||
|
Construction loans
|
2.57 | % | 4.48 | % | ||||
18
The following table summarizes mortgage loans by type and original loan amount held by United Mortgage Trust at September 30, 2011.
|
Description
|
No. of Loans
|
Interest Rate
|
Final Maturity Date
|
Periodic Payment Terms
|
Prior Liens
|
Face amount of Mortgage (1)
|
Carrying amount of Mortgage (2)
|
Past Due Amounts (3)
|
||||||||||||||||||||||||
|
Single family residential 1st mortgages and interim loans (5):
|
||||||||||||||||||||||||||||||||
|
Original balance > $100,000
|
8 | 10% - 11 | % |
11/24/11– 5/1/38
|
n/a | n/a | $ | 900,645 | $ | 834,776 | $ | 1,141 | ||||||||||||||||||||
|
Original balance $50,000 - $99,999
|
122 | 8.5% - 12.75 | % |
5/8/13 – 3/1/39
|
n/a | n/a | 3,452,808 | 3,200,288 | 25,429 | |||||||||||||||||||||||
|
Original balance $20,000 - $49,999
|
184 | 9% - 14.5 | % |
12/1/11 – 9/1/31
|
n/a | n/a | 1,691,990 | 1,568,246 | 17,942 | |||||||||||||||||||||||
|
Original balance under $20,000
|
8 | 9% - 14.5 | % |
12/1/10 – 5/19/36
|
n/a | n/a | 61,566 | 57,063 | 405 | |||||||||||||||||||||||
|
First Lien secured interim mortgages Ready
|
||||||||||||||||||||||||||||||||
|
America Funding (4)
|
11 | 14 | % | n/a | n/a | n/a | 16,449,197 | 16,449,197 | - | |||||||||||||||||||||||
|
Secured, subordinate LOC to UMTH Lending Co., L.P. (4), (5)
|
28 | 12.5% - 13.5 | % | n/a | n/a | n/a | 7,658,831 | 7,658,831 | - | |||||||||||||||||||||||
|
Land Development Loans
|
||||||||||||||||||||||||||||||||
|
UDF III Economic Interest Participation
|
2 | 14 | % |
12/31/10
|
n/a | n/a | 71,366,686 | 71,366,686 | - | |||||||||||||||||||||||
|
Construction Loans
|
5 | 13 | % |
10/28/10-6/10/2014
|
n/a | n/a | 3,921,643 | 3,921,643 | - | |||||||||||||||||||||||
|
Totals
|
368 | $ | 105,503,356 | $ | 105,056,720 | $ | 44,917 | |||||||||||||||||||||||||
|
(1)
|
Current book value of loans.
|
|
(2)
|
Net of allowance for loan losses on mortgage loans of $446,636 at September 30, 2011.
|
|
(3)
|
Principal amounts greater than thirty (30) days past due.
|
|
(4)
|
Lines of credit with Ready America Funding and UMTH Lending Co., L.P. are collateralized by 11 and 28 loans, respectively. Principal amounts due upon disposition of assets.
|
|
(5)
|
No specific maturity date as UMT has first lien collateral position in these loans funded by the originator.
|
Below is a reconciliation and walk forward of mortgage loans, net of allowance for loan losses, for the nine months ended September 30, 2011.
|
Balance at beginning of period
|
$ | 105,698,037 | ||
|
Additions during period:
|
||||
|
Other increases – UDF III EIA Participation
|
8,452,688 | |||
|
Deductions during period:
|
||||
|
Collections of principal, net
|
(788,118 | ) | ||
|
Other decreases
|
(8,022,512 | ) | ||
|
Foreclosures
|
(296,100 | ) | ||
|
Other (net change in allowance for loan loss)
|
12,725 | |||
|
Balance at close of period
|
$ | 105,056,720 |
19
Material Trends Affecting Our Business
We are a real estate investment trust and derive a substantial portion of our income from loans secured by single-family homes (both finished homes and homes under construction), single-family home lots, and entitled land under development into single-family home lots. We continue to concentrate our investment activities in the southwest sections of the United States, particularly in Texas. We believe these areas continue to experience demand for new construction of single-family homes, although, the U.S. housing market suffered declines over the past four years, particularly in geographic areas that had experienced rapid growth, steep increases in property values and speculation. However, we expect to see continued healthy demand for our products as the supply of new homes, finished lots and land is once again aligned with our market demand.
We believe that the housing market has reached a bottom in its four-year decline and has begun to recover. This recovery likely will be regional in its early stages and will be led by those housing markets with balanced supply, affordable and stable home prices, minimal levels of foreclosures, strong economies, and strong demand fundamentals. Nationally, we expect the recovery will continue to experience headwinds from weak demand fundamentals, specifically consumer confidence and employment, as well as from the limited availability of bank financing, and a persisting oversupply of home inventory and high levels of foreclosures. The national consumer confidence index, which fell to record lows during the economic downturn, has recovered somewhat, but remains closer to levels historically associated with recession than to normalized conditions. Unemployment remains elevated and access to conventional real estate and commercial financing remains limited across most of the country. These factors pose obstacles to a robust recovery on a national scale, which, we believe, is contingent upon the reengagement of the consumer and the return of final demand. However, we expect the recovery will be stronger in markets such as Texas, where consumer confidence averaged approximately 16 points higher than the national index from September 2010 to September 2011; where the job growth rate over the past 12 months was more than double the national rate; and where approximately 15% of all homebuilding permits in the country were issued in 2010. Further, according to the Bureau of Labor Statistics, 37.8% of the total jobs created in the United States since the official end of the national recession were created in Texas (from June 2009 to September 2011). We believe the fact that new single-family home permits, starts, and sales have all risen from their respective lows reflects a continued return of real demand for new homes. However, we anticipate the former bubble market states – principally California, Arizona, Nevada and Florida – will be slower to recover, as those markets have seen overbuilding and extensive price correction and are experiencing weakened economies and continued foreclosures.
From a national perspective, ongoing credit constriction, a less robust economic recovery, continued high unemployment, and housing price correction have made potential new home purchasers and real estate lenders cautious. As a result of these factors, the national housing market has experienced a protracted decline, and the time necessary to correct the market likely means a corresponding slower recovery for the housing industry.
Nationally, capital constraints at the heart of the credit crisis have reduced the number of real estate lenders able or willing to finance development, construction or the purchase of homes and have increased the number of undercapitalized or failed builders and developers. In correlation, the number of new homes and finished lots developed has decreased, which may result in a shortage of new homes and developed lots in select real estate markets in 2011 and 2012. We believe this shortage will be most prominent in markets that did not participate in the housing bubble, avoiding overbuilding and maintaining balanced supplies and affordable and stable home prices. With lenders imposing stricter underwriting standards, mortgages to purchase homes have become more difficult to obtain in some markets. To support the secondary residential mortgage market and prevent further deterioration of mortgage lending, the Federal Reserve began an unprecedented program to purchase approximately $1.25 trillion of residential mortgage backed securities between January 5, 2009 and March 31, 2010. This program ended on March 31, 2010, as scheduled by the Federal Reserve. As of the date of this quarterly report, the 30-year fixed-rate single-family residential mortgage interest rate continues to remain below the rate that was available at the conclusion of the period of Federal Reserve purchases. We believe that such stability at low rates indicates that the secondary residential mortgage market is operating smoothly independent of the support previously provided by the Federal Reserve. Further, on September 21, 2011, the Federal Reserve announced that it would begin reinvesting the principal payments from its mortgage-backed securities holdings into additional purchases of agency mortgage-backed securities to help support conditions in mortgage markets. However, any limitations or restrictions on the availability of financing or on the liquidity provided in the secondary residential mortgage market by Government Sponsored Enterprises such as Fannie Mae and Freddie Mac could adversely affect interest rates and mortgage availability, which could cause the number of homebuyers to decrease, which could increase the likelihood of borrowers defaulting on our loans and, consequently, reduce our ability to pay distributions to our shareholders.
20
Nationally, new home sales rose slightly during the third quarter from the pace of sales in the second quarter of 2011, though levels continue to be depressed in the aftermath of the expiration of the federal homebuyer tax credit. However, national fundamentals that drive home sales continue to improve in most markets and home affordability remains near record-highs, so we expect the pace of home sales will continue to increase over 2011. The U.S. Census Bureau reports that the sales of new single-family residential homes in September 2011 were at a seasonally adjusted annual rate of 313,000 units. This number is up approximately 3.3% from the second quarter 2011 figure of 303,000, but down approximately 0.9% year-over-year from the September 2010 estimate of 316,000. However, seasonal and year-over-year comparisons are and will likely continue to be distorted by the effects of the federal homebuyer tax credit, which expired in June 2010, creating a hangover effect on home sales in the subsequent months and quarters.
National new single-family home inventory continued to improve in the third quarter of 2011 as it has done consistently since the first quarter of 2007. Through much of the downturn, homebuilders reduced their starts and focused on selling their existing new home inventory. The number of new homes for sale fell by approximately 39,000 units from September 2010 to September 2011 and by 3,000 units in the third quarter 2011. We believe that, with such reductions, the new home market has been restored to equilibrium in most markets, even at low levels of demand. The seasonally adjusted estimate of new homes for sale at the end of September 2011 was 163,000 – a balanced supply of 6.2 months at the September sales rate but the lowest number of homes available for sale since the U.S. Census Bureau began keeping records of this statistic in 1963. We believe that what is necessary now to regain prosperity in housing markets is the return of healthy levels of demand.
According to the U.S. Census Bureau, new single-family residential home permits and starts fell nationally from 2006 through early 2009, as a result and in anticipation of an elevated supply of and decreased demand for new single-family residential homes in that period. Since bottoming in early 2009, however, single-family permits and starts have improved significantly. Single-family homes authorized by building permits in September 2011 were at a seasonally adjusted annual rate of 417,000 units. This was a 3.5% increase year-over-year from the rate of 403,000 in September 2010, and is approximately 23.7% higher than the low of 337,000 set in January 2009. Single-family home starts for September 2011 stood at a seasonally adjusted annual rate of 425,000 units. This pace is down approximately 4.9% from the September 2010 estimate of 447,000 units – as homebuilders continue to adjust their start rate one year after the expiration of the homebuyer tax credit. Again, seasonal comparisons and year-over-year figures between September 2010 home starts and September 2011 home starts are likely distorted by the reduction in new home starts following the June 2010 expiration of the homebuyer tax credit as builders adjusted their inventory levels to match reduced demand. However, the September 2011 pace of home starts is still 20.4% higher than the low of 353,000 set in March 2009. Such increases suggest to us that new home inventories are generally in balance and the homebuilding industry now anticipates greater demand for new homes in coming months relative to the demand evident at the bottom of the new homebuilding cycle.
The primary factors affecting new home sales are home price stability, home affordability, and housing demand. Housing supply may affect both new home prices and the demand for new homes. When the supply of new homes exceeds new home demand, new home prices may generally be expected to decline. Also, home foreclosures cause the inventory of existing homes to increase, which may add additional downward price pressure on home prices. Declining new home prices may result in diminished new home demand as people postpone a new home purchase until such time as they are comfortable that stable price levels have been reached. The converse point is also true and equally important. When new home demand exceeds new home supply, new home prices may generally be expected to increase; and rising new home prices, particularly at or near the bottom of the housing cycle, may result in increased new home demand as people become confident in home prices and accelerate their timing of a new home purchase. Hence, we intend to concentrate our investments in housing markets with affordable and stable home prices, balanced supply, lower incidences of foreclosures, and strong demand fundamentals. These demand fundamentals are generally job growth, the relative strength of the economy and consumer confidence, household formations, and population growth – both immigration and in-migration.
21
The U.S. Census Bureau forecasts that California, Florida and Texas will account for nearly one-half of the total U.S. population growth between 2000 and 2030 and that the total population of Arizona and Nevada will double during that period. The U.S. Census Bureau projects that between 2000 and 2030 the total populations of Arizona and Nevada will grow from approximately 5 million to more than 10.7 million and from approximately 2 million to nearly 4.3 million, respectively; Florida’s population will grow nearly 80% between 2000 and 2030, from nearly 16 million to nearly 28.7 million; Texas’ population will increase 60% between 2000 and 2030, from nearly 21 million to approximately 33.3 million; and California’s population will grow 37% between 2000 and 2030, from approximately 34 million to nearly 46.5 million.
The Harvard Joint Center for Housing Studies forecasts that an average of between approximately 1.25 million and 1.48 million new households will be formed per year over the next ten years. Likewise, The Homeownership Alliance, a joint project undertaken by the chief economists of Fannie Mae, Freddie Mac, the Independent Community Bankers of America, the National Association of Home Builders, and the National Association of Realtors, has projected that 1.3 million new households will be formed per year over the next decade and approximately 1.8 million housing units per year should be started to meet such new demand, including approximately 1.3 million new single-family homes per year based on the estimation of the Homeownership Alliance that 72% of all housing units built will be single-family residences. The U.S. Census Bureau estimates that approximately 951,190 new households were formed in 2010.
While housing woes have beleaguered the national economy, Texas housing markets have held up as some of the healthiest in the country. Furthermore, Texas is the largest homebuilding market in the country based on the U.S. Census Bureau’s measurements of housing permits and starts. We intend to concentrate our initial investment portfolio in Texas as we believe Texas markets, though weakened from their highs in 2007, have remained fairly healthy due to strong demographics, economies and job growth, balanced housing inventories, stable home prices and high housing affordability ratios. Texas did not experience the dramatic price appreciation (and subsequent depreciation) that states such as California, Florida, Arizona, and Nevada experienced. The following graph, created with data from the second quarter 2011 Federal Housing Finance Agency’s (“FHFA”) Purchase Price Only Index, illustrates the declines in home prices nationally, as well as in California, Florida, Arizona, and Nevada over the past few years. Price declines have begun to moderate in those states in recent quarters, though. Further, the graph illustrates how Texas has maintained relative home price stability throughout the downturn. The Standard (Purchase-Only) Home Price Index indicates that Texas had a home price depreciation of -1.91% between the second quarter of 2010 and the second quarter of 2011. However, Texas’ home prices continued to demonstrate more stability than the national average of -5.93%. Further, the index also reports that over the past five years, Texas home prices have appreciated 5.94% compared to a national depreciation of -18.78% over the same time period.
22
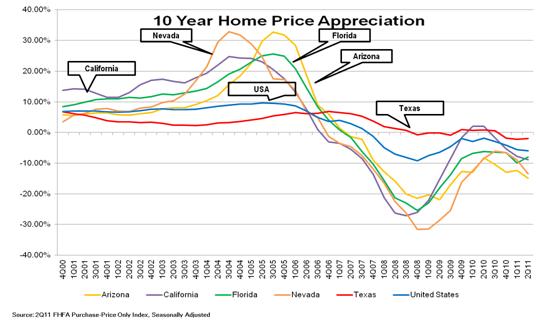
FHFA’s Purchase Price Only Index tracks average house price changes in repeat sales on the same single-family properties. The Purchase Price Only Index is based on more than 6 million repeat sales transactions and is based on data obtained from Fannie Mae and Freddie Mac for mortgages originated over the past 36 years. FHFA analyzes the combined mortgage records of Fannie Mae and Freddie Mac, which form the nation’s largest database of conventional, conforming mortgage transactions. The conforming loan limit for mortgages purchased since the beginning of 2006 has been $417,000. Loan limits for mortgages originated in the latter half of 2007 through December 31, 2008 were raised to as much as $729,750 in high-cost areas in the contiguous United States. Legislation generally extended those limits for 2009-originated mortgages. An appropriations act (PL111-88) further extended those limits for 2010 originations in places where the limits were higher than those that would have been calculated under pre-existing rules.
Median new home prices in the four major Texas markets have begun to rise. According to numbers publicly released by Metrostudy, a leading provider of primary and secondary market information, the median new home prices for the third quarter of 2011 in the metropolitan areas of Austin, Houston, Dallas, and San Antonio are $218,205, $216,966, $226,995 and $178,011, respectively.
Using the Department of Housing and Urban Development’s estimated 2011 median family income for the respective metropolitan areas of Austin, Houston, Dallas and San Antonio, the median income earner in those areas has 1.48 times, 1.31 times, 1.31 times, and 1.45 times the income required to qualify for a mortgage to purchase the median priced new home in the respective metropolitan area. These numbers illustrate the affordability of Texas homes, as each of these markets has higher affordability than the national average. Our measurement of housing affordability, as referenced above, is determined as the ratio of median family income to the income required to qualify for a 90 percent, 30-year fixed-rate mortgage to purchase the median-priced new home, based on the average interest rate over the third quarter of 2011 and assuming an annual mortgage insurance premium of 70 basis points for private mortgage insurance, plus a cost that includes estimated property taxes and insurance for the home. Using the Department of Housing and Urban Development’s 2011 income data to project an estimated median income for the United States of $64,200 and the September 2011 national median sales prices of new homes sold of $204,400, we conclude that the national median income earner has 1.36 times the income required to qualify for a mortgage loan to purchase the median-priced new home in the United States. This estimation reflects the increase in home affordability in housing markets outside of Texas over the past 48 months, as new home prices in housing markets outside of Texas generally have fallen. Recently, however, such price declines have begun to stabilize. We believe that such price stabilization indicates that new home affordability has been restored to the national housing market.
Since the national recession’s official end, Texas employment markets have experienced strong job growth. According to the United States Department of Labor, Texas added approximately 248,500 jobs in the 12 months ended September 2011, which was the second largest year-over-year increase of any state in the country. Furthermore, Texas added an even greater amount of jobs in the private sector (281,400) over the past 12 months, which was the largest private sector job increase of any state over the past 12 months and is a growth rate of 3.3%. Since the national recession’s end in June 2009, Texas has added 318,300 net new jobs, which is approximately 37.8% of all net jobs added nationwide over that 27 month period. Further, Texas has added approximately 1.1 million new jobs over the past 10 years, 884,000 in the private sector, in contrast to a loss of approximately 184,000 total jobs and a loss of more than 1 million private sector jobs in the country as a whole. From September 2010 to September 2011 Austin added 17,500 jobs year-over-year. Dallas-Fort Worth added 79,600 jobs over that same time period, which was the greatest job gain of any city in the country over the past 12 months, just ahead of Houston, which enjoyed the second greatest job gain of any city in the country in that time. Houston added 68,200 jobs over that period and San Antonio added 9,200 jobs in that time.
23
Texas’ unemployment rate rose year-over-year to 8.5% in September 2011 from 8.2% in September 2010. The increase in the state unemployment rate is likely due to a growth in Texas’ labor force, as Texas has added an estimated 148,100 workers to its labor force over the past 12 months, which is an all-time high. The growth in Texas’ labor force stands in contrast with the national labor force, which has fallen by approximately 936,000 workers, as of September 2011, from its peak in October 2008 and fell by approximately 107,000 over the past 12 months. The national unemployment rate fell year-over-year from September 2010 (9.6%) to September 2011 (9.1%). In addition, all four major Texas labor markets have unemployment rates below the national unemployment rate.
We believe that Texas cities will continue to be among the first in the country to recover based on employment figures, consumer confidence, gross metropolitan product, and new home demand. According to the Texas Workforce Commission, Texas tends to enter into recessions after the national economy has entered a recession and usually leads among states in the economic recovery. The National Bureau of Economic Research has concluded that the U.S. economy entered into a recession in December 2007, ending an economic expansion that began in November 2001. We believe, based on transitions in the Texas Leading Index as prepared by the Federal Reserve Bank of Dallas, that Texas entered into recession in late Fall 2008, trailing the national recession by nearly a year and emerged from the recession in the late spring of 2009. We believe the Texas economy is now leading the national economic recovery. The Texas Leading Index has risen significantly since reaching a low of 100.5 in March 2009 and, as of August 2011, was 119.6, which is higher than at any period during 2009 or 2010. The Texas Leading Index, produced monthly by the Federal Reserve Bank of Dallas, combines eight measures that tend to anticipate changes in the Texas business cycle by approximately three to nine months. The index has either risen or remained constant for nine consecutive months.
Further, we believe Texas consumers are beginning to return to their normal consumption habits. The aggregate value of state sales tax receipts in Texas increased 11.8% year-over-year in September 2011 from September 2010 – the 18th consecutive month in which Texas has experienced year-over-year improvement in sales tax receipts.
The U.S. Census Bureau reported in its 2009 Estimate of Population Change for the period from July 1, 2008 to July 1, 2009 that Texas led the country in population growth during that period. The estimate concluded that Texas’ population grew by 478,012 people, or 2%, a number that was 1.25 times greater than the next closest state in terms of raw population growth, California, and more than 3.57 times the second closest state in terms of raw population growth, North Carolina. In the Census Bureau’s 2010 Estimate of Population Change, Texas’ population grew an additional 1.8%, adding approximately 442,794 new residents in 2010. For the decade, July 1, 2000 to July 1, 2010, Texas grew by nearly 4.3 million residents, averaging nearly 427,000 new residents per year. This population growth was 1.17 times greater in terms of raw population growth than the next closest state, California, and 2.63 times greater than the second closest state, Florida. The U.S. Census Bureau also reported that among the 15 counties that added the largest number of residents between July 1, 2008 and July 1, 2009, six were in Texas: Harris (Houston), Tarrant (Fort Worth), Bexar (San Antonio), Collin (North Dallas), Dallas (Dallas) and Travis (Austin). In March 2010, the U.S. Census Bureau reported that Texas’ four major metro areas – Austin, Houston, San Antonio, and Dallas-Fort Worth – were among the top 20 in the nation for population growth from 2008 to 2009. Dallas-Fort Worth-Arlington led the nation in numerical population growth with a combined estimated population increase of 146,530. Houston-Sugarland-Baytown was second in the nation with a population increase of 140,784 from July 1, 2008 to July 1, 2009. Austin-Round Rock had an estimated population growth of 50,975 and San Antonio had an estimated population growth of 41,437 over the same period. The percentage increase in population for each of these major Texas cities ranged from 2% to 3.1%.
24
The national foreclosure tracking service, RealtyTrac, estimates that the Texas foreclosure rate continues to be significantly stronger than the national average. We do not expect the four major Texas housing markets to be materially adversely affected by foreclosures and anticipate that home foreclosures will continue to be mostly concentrated in the bubble market states of California, Florida, Arizona and Nevada. The mortgage analytic company, CoreLogic, reports that, through the second quarter of 2011, approximately 46.1% of all homes with negative equity were located in one of those four states compared to approximately just 3.1% of all the negative equity homes in the country that were located in the state of Texas. Homebuilding and residential construction employment will likely remain generally weak for some time, but Texas again will likely continue to outperform the national standards. From September 2010 to September 2011, Texas added 35,400 jobs in the construction sector according to the Bureau of Labor Statistics, which is approximately 95% of all construction jobs added in the country during that time period (37,000). We believe that Texas’ housing sector is healthier, the cost of living and doing business is lower, and its economy is more dynamic and diverse than the national average.
In contrast to the conditions of many homebuilding markets in the country, new home sales are greater than new home starts in Texas markets, indicating that homebuilders in Texas continue to focus on preserving a balance between new home demand and new home supply. We believe that homebuilders and developers in Texas have remained disciplined on new home construction and project development. New home starts are outpaced by new home sales in all four major Texas markets where such data is available: Austin, Dallas-Fort Worth, Houston and San Antonio. Inventories of finished new homes and total new housing (finished vacant, under construction, and model homes) remain at generally healthy and balanced levels in all of these major Texas markets. Each major Texas market experienced a rise in the number of months of finished lot inventories as homebuilders began reducing the number of new home starts in 2008, causing each major Texas market to reach elevated levels. However, the number of finished lots available in each market has fallen significantly even though the months’ supply remains elevated. Furthermore, finished lot shortages are beginning to emerge in many desirable submarkets in the major Texas markets. This is a trend that we expect to continue as the lack of commercial financing for development has constrained finished lot development over the past three and one-half years even as new home demand and sales continue. We believe that such demand and sales will increase and these finished lot shortages will become more pronounced in coming quarters. As of September 2011, Houston has an estimated inventory of finished lots of approximately 36.6 months, Austin has an estimated inventory of finished lots of approximately 38.5 months, San Antonio has an estimated inventory of finished lots of approximately 34.1 months and Dallas-Fort Worth has an estimated inventory of finished lots of approximately 53.2 months. A 24-28 month supply is considered equilibrium for finished lot supplies.
As stated previously, the elevation in month’s supply of finished lot inventory in Texas markets owes itself principally to the decrease in the pace of annual starts rather than an increase in the raw number of developed lots, and as the homebuilders begin to increase their pace of home starts, we expect to see the month’s supply of lot inventory rapidly improve. Indeed, the raw number of finished lots available in each Texas market has been significantly reduced from their peaks. Since peaking in the first quarter of 2008, Houston’s finished lot supply is down 27.1% from 73,047 to 53,235 in the third quarter of 2011. San Antonio’s finished lot inventory has fallen 31.1% to 19,248 since peaking at 27,937 in the second quarter of 2008. Austin’s finished lot inventory peaked in the first quarter of 2009 at 27,176, and is down 26.0% to 20,100. The finished lot inventory for Dallas-Fort Worth peaked in the first quarter of 2008 at 91,787 lots and has fallen 33.5% to 61,063 lots. Such inventory reduction continued in the third quarter of 2011 in all four of these markets as the number of finished lots dropped by more than 600 in Austin, nearly 1,900 in Dallas-Fort Worth, more than 1,000 in Houston, nearly 100 in San Antonio. Annual starts in each of the Austin, San Antonio, Houston and Dallas-Fort Worth markets are outpacing lot deliveries, and we expect to see increased finished lot sales through 2011 as homebuilders replenish their inventory.
Although Texas markets continue to be some of the strongest homebuilding markets in the country, the pace of homebuilding in Texas has slowed over the past four years as a result of the national economic downturn and reduced availability of construction financing. According to the Federal Deposit Insurance Corporation, banks in the Dallas region1 reduced their construction and development loans by 5.5% from the first quarter of 2011 to the second quarter of 2011 – the 13th straight quarterly decline in the region’s construction and development outstanding loan portfolio. While the decline in housing starts has caused the month supply of vacant lot inventory to become elevated from its previously balanced position, it has also preserved a balance in housing inventory. Annual new home sales in Austin outpace starts 6,514 versus 6,272, with annual new home sales declining year-over-year by approximately 17.5%. Finished housing inventory stands at an elevated level of 3.6 months, while total new housing inventory (finished vacant, under construction and model homes) stands at an elevated supply of 8.1months. The generally accepted equilibrium levels for finished housing inventory and total new housing inventory are a 2-to-2.5 month supply and a 6.0 month supply, respectively. Like Austin, San Antonio is also a relatively healthy homebuilding market. Annual new home sales in San Antonio run ahead of starts 6,926 versus 6,783, with annual new home sales declining year-over-year by approximately 17.9%. Finished housing inventory fell to a healthy level of a 2.1 month supply. Total new housing inventory held at a strong 6.4 month supply. Houston, too, is a healthy homebuilding market. Annual new home sales there outpace starts 18,153 versus 17,434, with annual new home sales declining year-over-year by approximately 18.8%. Finished housing inventory is generally healthy at a 2.8 month supply while total new housing inventory fell to a slightly elevated 6.9 month supply, respectively. Dallas-Fort Worth is a relatively healthy homebuilding market as well. Annual new home sales in Dallas-Fort Worth outpace starts 14,507 versus 13,773, with annual new home sales declining year-over-year by approximately 18.2%. Finished housing inventory stands at a healthy 2.5 month supply, while total new housing inventory rose to a slightly elevated 7.2 month supply. All numbers are as released by Metrostudy, leading provider of primary and secondary market information.
|
1
|
FDIC Dallas Region is composed of Arkansas, Colorado, Louisiana, Mississippi, New Mexico, Oklahoma, Tennessee, and Texas.
|
25
The Real Estate Center at Texas A&M University has reported that existing housing inventory levels remained elevated from the second quarter of 2011 to the third quarter of 2011. Through September 2011, the number of months of home inventory for sale in Austin, Houston, Dallas, Fort Worth and Lubbock was 5.5 months, 6.9 months, 6.0 months, 6.2 months, and 7.5 months, respectively. San Antonio’s inventory remained more elevated with a 7.6 month supply of homes for sale. Like new home inventory, a 6-month supply of inventory is considered a balanced market with more than 6 months of inventory generally being considered a buyer’s market and less than 6 months of inventory generally being considered a seller’s market. Through September 2011, the number of existing homes sold to date in (a) Austin was 16,385, up 5% year-over-year; (b) San Antonio was 14,212, down 2% year-over-year; (c) Houston was 45,121, up 2% year-over-year, (d) Dallas was 32,630, down 2% year-over-year, (e) Fort Worth was 6,178, down 4% year-over-year, and (f) Lubbock was 2,163, down 5% year-over-year. These figures and year-over-year comparisons are likely distorted by the presence and expiration of the federal homebuyer tax credit in June 2010 that likely pulled demand forward in the first six months of 2010 at the expense of demand in subsequent quarters.
In managing and understanding the markets and submarkets in which we make loans, we monitor the fundamentals of supply and demand. We monitor the economic fundamentals in each of the markets in which we make loans by analyzing demographics, household formation, population growth, job growth, migration, immigration and housing affordability. We also monitor movements in home prices and the presence of market disruption activity, such as investor or speculator activity that can create false demand and an oversupply of homes in a market. Further, we study new home starts, new home closings, finished home inventories, finished lot inventories, existing home sales, existing home prices, foreclosures, absorption, prices with respect to new and existing home sales, finished lots and land, and the presence of sales incentives, discounts, or both, in a market.
Generally, the residential homebuilding industry is cyclical and highly sensitive to changes in broader economic conditions, such as levels of employment, consumer confidence, income, availability of financing for acquisition, construction, and permanent mortgages, interest rate levels, and demand for housing. The condition of the resale market for used homes, including foreclosed homes, also has an impact on new home sales. In general, housing demand is adversely affected by increases in interest rates, housing costs, and unemployment and by decreases in the availability of mortgage financing or in consumer confidence, which can occur for numerous reasons, including increases in energy costs, interest rates, housing costs, and unemployment.
26
We face a risk of loss resulting from adverse changes in interest rates. Changes in interest rates may impact both demand for our real estate finance products and the rate of interest on the loans we make. In some instances, the loans we purchase will be junior in the right of repayment to senior lenders, who will provide loans representing 60% to 75% of total project costs. As senior lender interest rates available to our borrowers increase, demand for our mortgage loans may decrease, and vice versa. Deterioration in the value of the land, a diminution of the site improvement and similar reimbursements, and a decrease in the sales price of the residential lots can occur in cases where the developer pays too much for the land to be developed, the developer is unable or unwilling to develop the land in accordance with the assumptions required to generate sufficient income to repay the loans purchased by us, or is unable to sell the residential lots to homebuilders at a price that allows the developer to generate sufficient income to repay the loans purchased by us. Our Advisor actively monitors the markets and submarkets in which we purchase loans, including mortgage markets, homebuilding economies, the supply and demand for homes, finished lots, and land and housing affordability to mitigate such risks. Our Advisor also actively manages our loan portfolio in the context of events occurring with respect to the loan and in the market and submarket in which we purchased the loan. We anticipate that there may be defaults on development loans purchased by us and that we will take action with respect to such defaults at any such time that we determine it prudent to do so, including such time as we determine it prudent to maintain and protect the value of the collateral securing a loan by originating another development loan to another developer with respect to the same project to maintain and protect the value of the collateral securing our initial loan.
Developers and home builders whose loans we purchase use the proceeds of such loans to develop raw real estate into residential home lots. The developers obtain the money to repay these development loans by selling the residential home lots to home builders or individuals who will build single-family residences on the lots, receiving qualifying site improvement reimbursements, and by obtaining replacement financing from other lenders. If interest rates increase, the demand for single-family residences may decrease. Also, if mortgage financing underwriting criteria become stricter, demand for single-family residences may decrease. In such an interest rate and/or mortgage financing climate, developers may be unable to generate sufficient income from the resale of single-family residential lots to repay loans owned by us, and developers’ costs of funds obtained from lenders in addition to us may increase as well. If credit markets deteriorate, developers may not be able to obtain replacement financing from other lenders. Accordingly, increases in single-family mortgage interest rates, decreases in the availability of mortgage financing, or decreases in the availability of replacement financing could increase the number of defaults on development loans purchased by us.
We are not aware of any material trends or uncertainties, favorable or unfavorable, other than national economic conditions affecting real estate and interest rates generally, that we reasonably anticipate to have a material impact on either the income to be derived from our investments in mortgage loans or entities that make mortgage loans, other than those referred to in this Quarterly Report on Form 10-Q. The disruption of mortgage markets, in combination with a significant amount of negative national press discussing constriction in mortgage markets and the poor condition of the national housing industry, including declining home prices, have made potential new home purchasers and real estate lenders very cautious. The economic downturn, the failure of highly respected financial institutions, significant volatility in equity markets around the world, unprecedented administrative and legislative actions in the United States, and actions taken by central banks around the globe to stabilize the economy have further caused many prospective home purchasers to postpone their purchases. In summary, we believe there is a general lack of urgency to purchase homes in these times of economic uncertainty. We believe that this has further slowed the sales of new homes and finished lots developed in certain markets; however, we do not anticipate the prices of those lots changing materially. We also expect that the decrease in the availability of replacement financing may increase the number of defaults on real estate loans made by us or extend the time period anticipated for the repayment of our loans. Our future results could be negatively impacted by prolonged weakness in the economy, high levels of unemployment, a significant increase in mortgage interest rates or further tightening of mortgage lending standards.
27
Outlook
In summary, we believe there is a general lack of buyer urgency to purchase homes in these times of economic uncertainty. We believe that this has further slowed the sales of new homes and expect that this will result in a slowing of the sales of finished lots developed by our borrowers in certain markets; however, we continue to believe that the prices of those lots should not change materially. We also anticipate that the decrease in the availability of replacement financing may increase the number of defaults on development loans we invest in or extend the time period anticipated for the repayment of loans. We believe that United Mortgage Trust has been active in monitoring current market conditions and in implementing various measures to manage our risk and protect our return on our investments by shifting our portfolio to investments that are less directly sensitive to the adverse market conditions and that produce higher yields and by aggressively liquidating non-performing loans. Based on that assessment, we do not anticipate a significant disruption to our normal business operations. Nevertheless, our assessments inherently involve predicting future events and we cannot be sure of the length or extent of the current credit crisis and if it continues over an extended period of time, or if its severity increases, its impact on the economy as a whole and on the housing and mortgage lending market could cause us to suffer a higher level of delinquencies and losses than we are currently predicting and result in a material adverse impact on our business.
Interim Loan Portfolio Overview
The deterioration in the residential mortgage market, specifically the discontinuation of sub-prime and Alt – A products, referred to herein as the sub-prime credit crisis, and the continued slowdown in new home sales are directly and indirectly affecting the ability of our interim loan borrowers to sell the assets securing their loans, pay interest due us and repay the interim loans when due. New and existing home financing solutions are being introduced by both the private and public sectors. Housing inventories in Texas are slowly beginning to reduce to sustainable levels. However, consumer confidence remains low. Industry-wide lenders are reevaluating and restructuring credits affected by residential mortgage markets as housing sales decline. Overall recovery of the single family housing industry is likely to be prolonged. We believe that a pragmatic and pro-active approach to managing our interim loan credits will allow us to maximize repayments and properly report asset values. In consideration of the above, we have:
|
|
·
|
ceased the origination of, and reducing our investment in, interim loans dependent on sub-prime and Alt-A mortgage products for repayment of our loan.
|
|
|
·
|
accepted a secured note from UMTHLC for shortfalls from foreclosed properties to enable UMTHLC to efficiently manage past due and foreclosed accounts throughout the duration of the credit crisis.
|
|
|
·
|
increased loss reserves for certain deficiency loans where full collection of the indebtedness is not assured.
|
|
|
·
|
re-evaluated collateral values on specific loans deemed to be affected by current mortgage and housing environments and reserving for unsecured deficiencies.
|
Portfolio Mix
Our portfolio concentrations have shifted over the years, as we have sought adequate supplies of suitable loans in a changing real estate finance market. The chart below demonstrates the transition from a portfolio with a concentration on long term, 1st lien single family loans to one comprised primarily of first lien interim loans of 12 months or less in term for the purchase and renovation of single family homes, loans secured by 1st lien and subordinate single family lot development loans, finished lot loans and construction loans. We intend to continue to adapt to changes in the real estate finance market and thus the composition of our loan portfolio is likely to continue to evolve over time based on factors such as interest rates paid under various types of real estate loans, our assessment of the level of risk of the different types of loans, availability of loans, regulatory considerations and other factors.
28
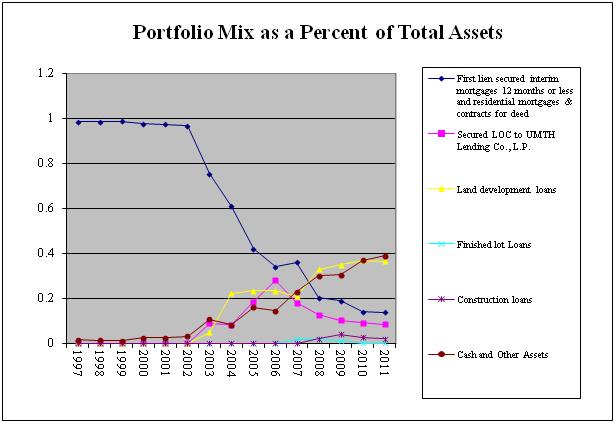
RESULTS OF OPERATIONS FOR THE THREE AND NINE MONTHS ENDED SEPTEMBER 30, 2011 AND SEPTEMBER 30, 2010
Revenues
Revenues for the three months ended September 30, 2011, were approximately $1,247,000 compared to approximately $1,382,000 for the comparable period in the prior year. This decrease of approximately $135,000 was due primarily to the decrease in outstanding balances of affiliate interim mortgage loans and the reduction in the interest rate on the UMTHLC Deficiency note from 10% to 6% effective January 1, 2011, lower balances in the residential mortgage portfolio and lower outstanding balances in the non-affiliate LOC and interim construction loan balances during the quarter ended September 30, 2011 compared to the same period in the prior year. These factors decreased interest income by approximately $23,000, $36,000 and $76,000, respectively. Revenues from interim loans accounted for approximately 27% of revenues for the three months ended September 30, 2011 compared to 40% in the same period in the prior year. The decline in our interim portfolio was a function of our intention to cease the origination of and reduce our investment in interim construction loans secured by modular and manufactured homes and related lots.
Revenues for the nine months ended September 30, 2011, were approximately $3,938,000 compared to approximately $5,869,000 for the comparable period in the prior year. This decrease of approximately $1,931,000 was due primarily to the decrease in outstanding balances of affiliate interim mortgage loans and the reduction in the interest rate on the UMTHLC Deficiency note from 10% to 6% effective January 1, 2011, reserving for the Recourse Note interest income effective July 1, 2010 and lower outstanding balances in the non-affiliate LOC and interim construction loan balances during the nine months ended September 30, 2011 compared to the same period in the prior year. These factors decreased interest income by approximately $1,146,000, $516,000 and $295,000, respectively. These decreases were offset by approximately $26,000 of increased interest income earned on residential mortgages. Revenues from interim loans accounted for approximately 32% of revenues for the nine months ended September 30, 2011 compared to 50% in the same period in the prior year. The decline in our interim portfolio was a function of our intention to cease the origination of and reduce our investment in interim loans.
29
During the three months ended September 30, 2011 and September 30, 2010, approximately 26% and 28%, respectively, of our revenues were derived from lines of credit and lot banking transactions, (these secured loans for the acquisition and development of single-family home lots are referred to as “land development loans”, “construction loans” and “lot banking transactions”). During the nine months ended September 30, 2011 and September 30, 2010, approximately 24% and 19%, respectively, of our revenues were derived from lines of credit and lot banking transactions. At September 30, 2011, our investment in the lines of credit to our affiliate, UDF, through the Economic Interest Agreement, and lot banking transactions, was approximately $71 million. We anticipate our investment in construction loans will increase during the remainder of 2011, facilitated by the Company’s line of credit and continued emphasis on this type of investment activity.
During the three months ended September 30, 2011 and 2010, respectively, approximately 0% of our revenues were derived from secured promissory notes issued by affiliates pursuant to their accrued obligations to reimburse UMT for any defaulted loans that we acquired from them, which notes we refer to as “Recourse Obligations.” During the nine months ended September 30, 2011 and September 30, 2010, respectively, approximately 0% and 9% of our revenues were derived from the secured promissory notes described above.
The Secured Notes require the originating company to make certain interest and principal payments, as defined by the agreements. Further, these notes are liquidated by any distributions paid to the originating company with respect to the pledged Class C and Class EIA units of UMTH. UMTH has guaranteed the obligations of CRG, SCMI and RAFC under the Secured Notes up to the maximum loan amounts defined in the respective notes. The sub-prime credit crisis, as well as the decline in new home sales, have indirectly adversely affected the earnings of UMTH which, in turn, is expected to have an adverse effect on the distributions associated with the security pledged on the Recourse Obligations. The Company monitors the value of the security pledged by the originating companies and will consider further modifications to the Recourse Obligations notes to allow UMTH to structure payments under the Recourse Obligations in relation to its earnings, as impacted by the mortgage market and new home sales environments. Any such modifications would be likely to result in a decline in the return being realized by the Company under the Recourse Obligation notes.
Expenses
Operating expenses for the three months ended September 30, 2011 and September 30, 2010, were approximately $899,000 and $1,068,000, respectively. Operating expenses for the nine months ended September 30, 2011 and September 30, 2010, were approximately $2,700,000 and $3,483,000, respectively. The decrease from the prior year is due primarily to lower trust administrative fees, lower general and administrative expenses and lower provision for loan loss expense during the three and nine month periods ended September 30, 2011. Fluctuations in operating expense line items are discussed in more detail below for the three and nine month periods ended September 30, 2011:
Trust administration fees – Approximately $250,000 and $289,000 (a 13% decrease) between the comparable three month periods ended September 30, 2011 and 2010, respectively, and approximately $750,000 and $845,000 (an 11% decrease) between the comparable nine month periods ended September 30, 2011 and 2010, respectively. This fee is approximately 1/12 of 1.0% monthly of total assets under management, however the annual fee has been limited to a total of $1,000,000 in 2011.
General and administrative expenses - Approximately $303,000 and $348,000 (a 13% decrease) between the comparable three month periods ended September 30, 2011 and 2010, respectively, and approximately $974,000 and $1,307,000 (a 25% decrease) between the comparable nine month periods ended September 30, 2011 and 2010, respectively. The decrease was primarily due to lower REO expenses resulting from converting certain REO properties to seller financed residential mortgages and leasing the residential REO properties to qualifying tenants and lower general and administrative expenses offset by higher interest expense due to the additional leverage from the new bank line of credit facility entered into by the Company with an outstanding balance of approximately $1,175,000 at September 30, 2011 and the private note sales that began in January 2011 with an outstanding balance of $345,000 at September 30, 2011.
30
Provision for loan losses - The Company recorded a provision for loan losses for the three months ended September 30, 2011 and 2010 of approximately $180,000 and $303,000, respectively. For the nine months ended September 30, 2011 and 2010, we recorded a provision of approximately $540,000 and $991,000, respectively. The Company realized loan losses of approximately $316,000 and $148,000 during the comparable three-month periods of 2011 and 2010, respectively. For the nine months ended September 30, 2011 and 2010, the Company realized loan losses of approximately $684,000 and $636,000, respectively. The provision for loan losses expense estimate was lowered in 2011 as management believes the Company is adequately reserved for expected future losses at this time however loss reserves are estimates of future losses based on historical default rates, estimated losses on the sale of real estate owned and expectations of future economic conditions and activity. The Company continually re-evaluates collateral value on specific loans deemed to be affected by current mortgage and housing environments and intends to establish reserves for any expected deficiencies that are not otherwise secured. From inception through September 30, 2011, we have acquired approximately $887 million of loans. We have recorded losses approximating 2.06% of those assets to date. We anticipate loan losses to continue, primarily in our long-term and un-affiliated construction loan portfolio, and therefore continue to assess the adequacy of our loan loss reserves.
Net income was approximately $348,000 and $314,000 for the three months ended September 30, 2011 and 2010, respectively. Net income was approximately $1,238,000 and $2,387,000 for the nine months ended June 30, 2011 and 2010, respectively. Specific variances are explained in more detail above. Earnings per share of beneficial interest for the three months ended September 30, 2011 and 2010 were $0.05 and $0.05 per share, respectively. Earnings per share of beneficial interest for the nine months ended September 30, 2011 and 2010 were $0.19 and $0.37 per share, respectively.
Distributions
Our dividend rate is fixed quarterly by our trustees. As such, the dividend rate may fluctuate up or down. Earnings are affected by various factors including use of leverage, current yield on investments, loan losses, general and administrative operating expenses and amount of non-income producing assets. Distributions, per weighted average share of beneficial interest, to shareholders were $0.14 and $0.15 per share for the three months ended September 30, 2011 and 2010, respectively and $0.43 and $0.44 per share for the nine months ended September 30, 2011 and 2010, respectively. The dividend portion of the distributions for the nine months ended September 30, 2011 was $0.19. The portion of these distributions that did not represent a dividend represented a return of capital.
LIQUIDITY AND CAPITAL RESOURCES FOR THE NINE MONTHS ENDED SEPTEMBER 30, 2011 AND 2010
Sources and Uses of Funds
Cash flows from operating activities are generally the result of net income adjusted for provision for loan losses, depreciation and amortization expense and (increases) decreases in accrued interest receivable and accounts payable and accrued liabilities (including affiliates). Cash provided by operations was approximately $703,000 and $1,740,000 during the nine months ended September 30, 2011 and 2010, respectively.
Cash flows provided by or used in investing activities generally reflect payments received from and fundings for lending activities. Cash flows from investing activities were approximately $987,000 during the nine months ended September 30, 2011. The Company used approximately $1,678,000 in investing activities during the nine months ended September 30, 2010.
Cash flows from financing activities generally reflect proceeds from the issuance of shares, borrowings or repayments on the line of credit, the purchase of treasury stock and the payment of dividends. Cash of approximately $1,441,000 and $80,000 was used by financing activities during the nine months ended September 30, 2011 and 2010, respectively.
31
Credit Facilities
During August 2009, the Company entered into a revolving line of credit facility with a bank for $5,000,000. The line of credit bears interest at prime plus one percent, with a floor of 5.50%, and requires monthly interest payments. Principal and all unpaid interest will be due at maturity, which is August 2012. The line is collateralized by a first lien security interest in the underlying real estate financed by the line of credit. The outstanding balance on this line of credit at September 30, 2011 and December 31, 2010 was approximately $4,051,000 and $4,408,000, respectively.
In May 2011, the Company entered into a revolving line of credit facility with a bank for $4,300,000. The line of credit bears interest at prime plus 1.50% with a floor of 5.0%, and requires monthly interest payments. Principal and all unpaid interest will be due at maturity, which is May 27, 2014. The line is collateralized by a first lien security interest in the underlying real estate financed by the line of credit. The outstanding balance on this line of credit at September 30, 2011 was approximately $1,175,000.
On April 21, 2010, the Company entered into a new term loan credit facility with a bank for $1,600,000. The loan bears interest at prime plus one percent, with a floor of 7.0%, and requires monthly interest payments. Principal and all unpaid interest will be due at maturity which is October 21, 2011. The loan is collateralized by a first lien security interest in the underlying real estate financed by the loan. The outstanding balance on this loan at September 30, 2011 and December 31, 2010 was approximately $1,107,000.
In August 2011, the Company entered into a revolving line of credit facility with a bank for $250,000. The line of credit bears interest at prime plus 1.50% with a floor of 4.75%, and requires monthly interest payments. Principal and all unpaid interest will be due at maturity, which is August 1, 2012. The line is collateralized by a first lien security interest in the underlying real estate financed by the line of credit. The outstanding balance on this line of credit at September 30, 2011 was approximately $104,000.
On January 27, 2011, United Mortgage Trust initiated a private offering of Secured Subordinated Notes (“Notes,” to accredited investors “Note Holders”). The Notes are being offered through a wholly owned subsidiary, UMT Home Finance II, L.P. (“HF II”). HF II is a Delaware limited partnership that was formed on November 29, 2010 as a Special Purpose Entity, (“SPE”), for the purpose of originating and holding loans made to fund the acquisition of finished lots and the construction of single-family homes on the subject lots (“Loans”). HF II will issue up to $5 million in 7.5% Notes. The Notes will be secured by an undivided security interest on the pool of loans owned by HF II. The offering of the Notes is not registered under the Securities Act, in reliance upon the exemption from registration for non-public offerings provided by Rule 506 of Regulation D promulgated under the Securities Act of 1933. As of September 30, 2011 approximately $345,000 had been raised through this private placement.
Our primary sources of funds for liquidity consist of our dividend reinvestment plan, repayments of principal on our loans made to purchase mortgage investments, and bank lines of credit. The table below summarizes certain liquidity sources and uses for the nine-month periods ended September 30, 2011 and September 30, 2010:
|
2011
|
2010
|
|||||||
|
Shares issued
|
18,866 | 26,626 | ||||||
|
Proceeds from issuance of shares of beneficial interest
|
$ | 296,000 | $ | 423,000 | ||||
|
Number of shares returned to treasury
|
9,861 | 23,829 | ||||||
|
Purchase of treasury stock
|
$ | (207,000 | ) | $ | (429,000 | ) | ||
|
Principal receipts:
|
||||||||
|
First lien mortgage notes and trust receivables
|
$ | 841,000 | $ | 1,247,000 | ||||
|
Real estate owned (investments)
|
$ | 2,201,000 | $ | 3,415,000 | ||||
|
Interim loans
|
$ | 325,000 | $ | 54,000 | ||||
|
Interim loans, affiliates
|
$ | 397,000 | $ | 9,662,000 | ||||
|
Lines of credit
|
$ | 833,000 | $ | 22,924,000 | ||||
|
Lines of credit, affiliates
|
$ | (1,371,000 | ) | $ | 3,613,000 | |||
|
Net borrowings – lines of credit payable
|
$ | 922,000 | $ | 2,558,000 | ||||
32
We are not currently offering shares in the public markets except to existing shareholders through our dividend reinvestment plan.
On March 18, 2009, the Board approved certain modifications to the Company’s Share Repurchase Plan (“SRP”) and Dividend Reinvestment Plan (“DRIP”), which modifications were disclosed in a report on Form 8-K which we filed with the SEC on March 19, 2009. Pursuant to the requirements of the SRP and DRIP, the Company sent its shareholders notice of amendment of the SRP and the DRIP, both of which were effective on May 1, 2009.
Shares issued in the aggregate, as of September 30, 2011 and 2010 were 8,318,632 and 8,291,242, respectively. Shares retired to treasury through our share redemption plan in the aggregate were 1,883,064 and 1,865,562 through September 30, 2011 and 2010, respectively. Total shares outstanding were 6,435,568 and 6,425,680, at September 30, 2011 and 2010, respectively. As of September 30, 2011, inception to date gross offering proceeds from all public offerings were approximately $165,841,000 and net proceeds after fees, marketing reallowance and commissions were approximately $147,113,000.
Critical Accounting Policies and Estimates
We prepare our financial statements in accordance with GAAP. The preparation of consolidated financial statements requires us to make estimates and judgments that affect the reported amounts of assets, liabilities, revenues and expenses, and related disclosure of contingent assets and liabilities. On an on-going basis, we evaluate our estimates, including those related to accrual of interest income, loan loss reserves and valuation of foreclosed properties. We base our estimates on historical experience and on various other assumptions that are believed to be reasonable under the circumstances, the results of which form the basis for making judgments about the carrying values of assets and liabilities that are not readily apparent from other sources. Actual results may differ from these estimates under different assumptions or conditions.
Significant accounting policies are described in the audited consolidated financial statements and notes thereto included in our Annual Report on Form 10-K for the year ended December 31, 2010. The following critical accounting policies affect our more significant judgments and estimates used in the preparation of our consolidated financial statements:
Interest is accrued monthly on outstanding principal balances. Payments are either received monthly for interest or at payoff. Any deficiencies in unpaid interest are either charged off to the reserve for loan losses or charged against the related interest reserve.
We maintain a reserve for loan losses for estimated losses resulting from the inability of our borrowers to make required payments resulting in property foreclosure and losses from the sale of foreclosed property. If the financial condition of our borrowers was to deteriorate, resulting in an impairment of their ability to make payments or, if the market value of the properties securing our loans decreases additional reserves may be required.
We record foreclosed properties at an estimated net realizable value based on our assessment of real estate market conditions and historical discount percentages on the sale of foreclosed properties. Should market conditions deteriorate or loss percentages increase, additional valuation adjustments may be required.
33
ITEM 3. QUANTITATIVE AND QUALITATIVE DISCLOSURES ABOUT MARKET RISK
We are exposed to interest rate changes primarily as a result of the method by which our bank credit facility is calculated at 1.0% over bank prime lending rate.
We provide a line of credit to UDF. UDF is a real estate finance limited partnership which derives a substantial portion of its income by originating, purchasing, participating in and holding for investment mortgage loans made directly by UDF to persons and entities for the acquisition and development of real property as single-family residential lots that will be marketed and sold to home builders. Changes in interest rates may impact both demand for UDF’s real estate finance products and the rate of interest on the loans UDF makes. In most instances, the loans UDF will make will be junior in the right of repayment to senior lenders who will provide loans representing 70% to 80% of total project costs. As senior lender interest rates available to our borrowers increase, demand for UDF mortgage loans may decrease, and vice versa.
Developers to whom UDF makes mortgage loans use the proceeds of such loans to develop raw real estate into residential home lots. The developers obtain the money to repay these development loans by selling the residential home lots to home builders or individuals who will build single-family residences on the lots, and by obtaining replacement financing from other lenders. If interest rates increase, the demand for single-family residences may decrease. Also, if mortgage financing underwriting criteria become more strict, demand for single-family residences may decrease. In such an interest rate and/or mortgage financing climate, developers may be unable to generate sufficient income from the resale of single-family residential lots to repay loans from UDF, and developers’ costs of funds obtained from lenders in addition to us may increase, as well. Accordingly, increases in single-family mortgage interest rates or decreases in the availability of mortgage financing could increase the number of defaults on development loans made by UDF, and correspondingly impact UDF’s ability to make payments under its line of credit.
ITEM 4T. CONTROLS AND PROCEDURES
Evaluation of Disclosure Controls and Procedures
An evaluation was performed by the Company’s management, consisting of the individual who serves as our President, of the effectiveness of the Company’s disclosure controls and procedures (as defined in Rule 13a-15(e) under the Securities Exchange Act of 1934) as of September 30, 2011. Based on such evaluation, management has concluded that, as of the end of such period, the Company’s disclosure controls and procedures are effective.
The Company’s management is also responsible for establishing and maintaining adequate internal control over financial reporting. The Company does not control the financial reporting process, and is solely dependent on UMTHGS, its Advisor, who is responsible for providing the Company with financial statements in accordance with generally accepted accounting principles in the United States. The Advisor’s disclosure controls and procedures were effective to provide reasonable assurance regarding the reliability of financial reporting and the preparation of financial statements for external purposes in accordance with accounting principles generally accepted in the United States.
Changes in Internal Controls over Financial Reporting
There have been no changes in the Company’s internal control over financial reporting that occurred during the third fiscal quarter of 2011, that have materially affected, or are reasonably likely to materially affect, the Company’s internal control over financial reporting.
34
PART II - OTHER INFORMATION
ITEM 1. LEGAL PROCEEDINGS
None.
ITEM 2. UNREGISTERED SALES OF EQUITY SECURITIES AND USE OF PROCEEDS
There is currently no established public trading market for our shares. As an alternative means of providing limited liquidity for our shareholders, we maintain a Share Redemption Plan, (“SRP”). Our trustees have the discretion to modify or terminate the SRP upon 30 day’s notice. Under the terms of our plan as modified and effective on May 1, 2009 (see below for a further description of the plan modifications), shareholders who have held their shares for at least one year are eligible to request that we repurchase their shares. In any consecutive 12 month period we may not repurchase more than 5% of the outstanding shares at the beginning of the 12 month period. The repurchase price is based on the “Net Asset Value” (NAV) as of the end of the month prior to the month in which the redemption is made. The NAV will be established by our Board of Trustees no less frequently than each calendar quarter. For reference, at September 30, 2011 and December 31, 2010 the NAV was $15.50 and $15.74 per share, respectively. Under the prior SRP terms, the redemption price was $20.00 per share. The Company will waive the one-year holding period ordinarily required for eligibility for redemption and will redeem shares for hardship requests. A “hardship” redemption is (i) upon the request of the estate, heir or beneficiary of a deceased shareholder made within two years of the death of the shareholder; (ii) upon the disability of a shareholder or such shareholder’s need for long-term care, providing that the condition causing such disability or need for long term care was not pre-existing at the time the shareholder purchased the shares and that the request is made within 270 days after the onset of disability or the need for long term care; and (iii) in the discretion of the Board of Trustees, due to other involuntary exigent circumstances of the shareholder, such as bankruptcy, provided that the request is made within 270 days after of the event giving rise to such exigent circumstances. Previously, there was no hardship exemption. Shares will be redeemed quarterly in the order that they are presented. Any shares not redeemed in any quarter will be carried forward to the subsequent quarter unless the redemption request is withdrawn by the shareholder. Previously, shares were redeemed monthly. Repurchases are subject to cash availability and Trustee discretion. Previously, the SRP provided that repurchases were subject to the availability of cash from the DRIP or the Company’s credit line. We have also purchased a limited number of shares outside of our SRP from shareholders with special hardship considerations.
The Company complies with Distinguishing Liabilities from Equity topic of FASB Accounting Standards Codification, which requires, among other things, that financial instruments that represent a mandatory obligation of the Company to repurchase shares be classified as liabilities and reported at settlement value. We believe that shares tendered for redemption by the shareholder under the Company’s share redemption program do not represent a mandatory obligation until such redemptions are approved at the discretion of our board of trustees. At such time, we will reclassify such obligations from equity to an accrued liability based upon their respective settlement values. As of September 30, 2011, we had approximately $52,000 of approved redemption requests included in our liabilities. These shares were redeemed in October.
Share repurchases have been at prices between $15.58 and $20 per share. Shares repurchased at the lower price were 1) shares held by shareholders for less than 12 months or 2) shares purchased outside of our SRP. Our stated NAV at September 30, 2011 and December 31, 2010 was $15.50 and $15.74 per share, respectively.
The following table sets forth information relating to shares of beneficial interest repurchased into treasury during the period covered by this report.
|
Month
|
Total number of shares repurchased
|
Average Purchase Price
|
Total number of shares purchased as part of a publicly announced plan
|
Total number of shares purchased outside of plan
|
||||||||||||
|
January
|
2,574 | $ | 15.79 | 2,574 | - | |||||||||||
|
February
|
- | - | - | - | ||||||||||||
|
March
|
- | - | - | - | ||||||||||||
|
April
|
2,516 | $ | 15.74 | 2,516 | - | |||||||||||
|
May
|
893 | $ | 15.67 | 893 | - | |||||||||||
|
June
|
- | - | - | - | ||||||||||||
|
July
|
1,012 | $ | 15.67 | 1,012 | - | |||||||||||
|
August
|
2,505 | $ | 15.67 | 2,505 | - | |||||||||||
|
September
|
361 | $ | 15.58 | 361 | - | |||||||||||
|
Totals
|
9,861 | $ | 15.72 | 9,861 | - | |||||||||||
ITEM 3. DEFAULTS UPON SENIOR SECURITIES
Not applicable.
ITEM 4. (Removed and Reserved)
35
ITEM 5. OTHER INFORMATION
None.
ITEM 6. EXHIBITS
|
3.1
|
Form of Second Amended Restated Declaration of Trust
|
*
|
|
|
3.2
|
Bylaws of the Company
|
*
|
|
|
4.1
|
Form of certificate representing the shares
|
*
|
|
|
4.2
|
Dividend Reinvestment Plan (incorporated by reference from the prospectus to the Company's Registration Statement on Form S-3POS (File no, 333-136107), that became effective October 16, 2006))
|
**
|
|
|
4.3
|
Description of Share Repurchase Program (incorporated by reference from the prospectus to the Company's Registration Statement on Form S-3POS (File no, 333-136107), that became effective October 16, 2006))
|
**
|
|
|
4.4
|
Amended Share Redemption Plan and Dividend Reinvestment Plan (filed as Exhibit 99.1 to Form 8-K filed June 1, 2010 and incorporated herein by reference)
|
||
|
10.1
|
Second Amended and Restated Subordination and Intercreditor Agreement entered into as of June 21, 2010, by and between the Company, UDF and a private investor (filed as Exhibit 10.1 to Form 10-Q for the Quarter Ended June 30, 2010 and incorporated herein by reference)
|
||
|
10.2
|
Amended and Restated Variable Amount Promissory Note between the Company and UMTH Lending Company, L.P. dated July 1, 2010 (filed as Exhibit 10.2 t o Form 10-Q for the Quarter Ended June 30, 2010 and incorporated herein by reference)
|
36
|
10.3
|
Economic Interest Participation Agreement and Purchase Option between United Mortgage Trust and UDF III dated September 19, 2008 (filed as Exhibit 10.1 to Form 10-Q for the Quarter Ended September 30, 2008 and incorporated herein by reference)
|
||
|
10.4
|
Participation Agreement between United Mortgage Trust and UDF III dated September 30, 2008 (filed as Exhibit 10.2 to Form 10-Q for the Quarter Ended September 30, 2008 and incorporated herein by reference)
|
|
10.5
|
Advisory Agreement dated August 14, 2006 between the Company and UMTH General Services, L.P. (incorporated by reference from Form 8-K filed August 16, 2006)
|
||
|
10.6
|
Form of Mortgage Servicing Agreement between the Company and South Central Mortgage, Inc. at a later date assigned to Prospect Service Corp.
|
*
|
|
10.7
|
Second Amended Secured Line of Credit Promissory Note and Security Agreement between the Company and United Development Funding, L.P. dated June 20, 2006 (incorporated by reference from Form 8-K filed June 21, 2006)
|
||
|
10.8
|
Secured Variable Amount Promissory Note dated December 31, 2005 issued by Capital Reserve Group, Inc. (incorporated by reference from Form 8-K filed March 31, 2006)
|
||
|
10.9
|
Secured Variable Amount Promissory Note dated December 31, 2005 issued by South Central Mortgage, Inc. (incorporated by reference from Form 8-K filed March 31, 2006)
|
||
|
10.10
|
Secured Variable Amount Promissory Note dated December 31, 2005 issued by Ready America Funding Corp. (incorporated by reference from Form 8-K filed March 31, 2006)
|
||
|
10.11
|
Form of Assignment of Limited Partnership Interest as Collateral Dated December 31, 2005 between the Company and Capital Reserve Group, Inc., South Central Mortgage, Inc., Ready America Funding Corp. and WLL, L.P. (incorporated by reference from Form 8-K filed March 31, 2006)
|
||
|
10.12
|
Guaranty dated December 31, 2005 between the Company and Ready Mortgage Corp. (incorporated by reference from Form 8-K filed March 31, 2006)
|
||
|
10.13
|
Guaranty dated December 31, 2005 between the Company and WLL, L.P. (incorporated by reference from Form 8-K filed March 31, 2006)
|
||
|
10.14
|
Guaranty dated December 31, 2005 between the Company and UMT Holdings, L.P. (incorporated by reference from Form 8-K filed March 31, 2006)
|
||
|
10.15
|
Intercreditor and Subordination Agreement dated December 31, 2005 between the Company and UMT Holdings, L.P. (incorporated by reference from Form 8-K filed March 31, 2006)
|
||
|
31.1
|
Certification of Chief Executive Officer pursuant to Section 302 of the Sarbanes-Oxley Act of 2002
|
||
|
31.2
|
Certification of Chief Executive Officer pursuant to Section 906 of the Sarbanes-Oxley Act of 2002
|
|
101.INS**
|
XBRL Instance Document (furnished herewith)
|
||
|
101.SCH**
|
XBRL Taxonomy Extension Schema Document (furnished herewith)
|
||
|
101.CAL**
|
XBRL Taxonomy Extension Calculation Linkbase Document (furnished herewith)
|
||
|
101.LAB**
|
XBRL Taxonomy Extension Label Linkbase Document (furnished herewith)
|
||
|
101.PRE**
|
XBRL Taxonomy Extension Presentation Linkbase Document (furnished herewith)
|
||
The exhibits marked with “*” are incorporated by reference from the Company's Registration Statement on Form S-11 (File No. 333-10109) that was declared effective on March 5, 1997. The exhibit marked with “**” is incorporated by reference from the Company's registration statement on Form S-11 (File No. 333-56520) that was declared effective on June 4, 2001.
** XBRL (Extensible Business Reporting Language) information is furnished and not filed or a part of a registration statement or prospectus for purposes of Sections 11 or 12 of the Securities Act of 1933, is deemed not filed for purposes of Section 18 of the Securities Exchange Act of 1934, and otherwise is not subject to liability under these sections.
37
SIGNATURE
Pursuant to the requirements of Section 13 or 15(d) of the Securities Exchange Act of 1934, the Registrant has duly caused this report to be signed on their behalf by the undersigned, thereunto duly authorized.
|
UNITED MORTGAGE TRUST
|
|||
|
|
|
|
|
|
Date: November 14, 2011
|
By
|
/s/ Stuart Ducote
|
|
|
President
|
|||
38