Attached files
| file | filename |
|---|---|
| 8-K - FORM 8-K - UNIFI INC | d255851d8k.htm |
 Investor
Presentation November 2011
Exhibit 99.1 |
 Presenters
2
Bill Jasper
Roger Berrier
Ron Smith
Chairman and Chief Executive Officer
President and Chief Operating Officer
Vice President and Chief Financial Officer |
 Cautionary
Statement 3
Certain statements included herein contain forward-looking statements within the meaning of
federal securities laws about Unifi, Inc.’s (the “Company”) financial
condition and results of operations that are based on management’s current expectations, estimates and projections about
the markets in which the Company operates, as well as management's beliefs and
assumptions. Words such as "expects," "anticipates,"
"believes," "estimates," variations of such words and other similar expressions
are intended to identify such forward-looking statements. These statements are
not guarantees of future performance and involve certain risks, uncertainties and assumptions, which are difficult to
predict. Therefore, actual outcomes and results may differ materially from what is
expressed or forecasted in, or implied by, such forward-looking statements.
Readers are cautioned not to place undue reliance on these forward-looking statements, which reflect management's judgment only
as of the date hereof. The Company undertakes no obligation to update publicly any of
these forward-looking statements to reflect new information, future events or
otherwise. Factors that may cause actual outcome and results to differ materially from those expressed in,
or implied by, these forward-looking statements include, but are not necessarily
limited to, availability, sourcing and pricing of raw materials, the success of our subsidiaries, pressures on sales
prices and volumes due to competition and economic conditions, reliance on and financial
viability of significant customers, operating performance of subsidiaries, joint
ventures, alliances and other equity investments, the accurate financial reporting of information from equity method
investees, technological advancements, employee relations, changes in construction spending,
capital expenditures and long-term investments (including those related to
unforeseen acquisition opportunities), continued availability of financial resources through financing arrangements and
operations, outcomes of pending or threatened legal proceedings, negotiations of new or
modifications of existing contracts for asset management and for property construction
and acqusition, regulations governing tax laws, other governmental and authoritative bodies' policies
and legislation, and proceeds received from the sale of assets held for disposal. In
addition to these representative factors, forward-looking statements could be
impacted by general domestic and international economic and industry conditions in the markets where the Company
competes, such as changes in currency exchange rates, interest and inflation rates, recession
and other economic and political factors over which the Company has no control.
Other risks and uncertainties may be described from time to time in the Company’s other reports and filings with
the Securities and Exchange Commission.
|
 The
Company’s product offerings include specialty and premier value-added yarns
with enhanced performance characteristics
The Company sells to other yarn
manufacturers, knitters and weavers that
produce fabric for the apparel, hosiery,
furnishings, automotive, industrial and
other end-use markets
34% ownership of Parkdale America LLC –
A $1+ billion cotton spinning joint venture
with Parkdale Mills, Inc.
4
Unifi Overview
Company overview
Historical Consolidated Revenue
Historical Adjusted EBITDA
(1)
Well-established downstream partners
___________________________
(1) Excludes earnings from Parkdale America LLC and other unconsolidated equity
affiliates $290
$309
$376
$152
$165
$163
$117
$149
$174
$-
$100
$200
$300
$400
$500
$600
$700
$800
FY09
FY10
FY11
Polyester
Nylon
International
$23.3
$55.3
$60.5
4.2%
8.9%
8.5%
0.0%
1.0%
2.0%
3.0%
4.0%
5.0%
6.0%
7.0%
8.0%
9.0%
10.0%
$-
$10.0
$20.0
$30.0
$40.0
$50.0
$60.0
$70.0
FY09
FY10
FY11
Adjusted EBITDA
Adjusted EBITDA Margin
Unifi, Inc. is a diversified producer and processor of
multi-filament polyester and nylon yarns |
 5
Market and Company Overview |
 Growing Global
Textile Fibers Market 6
___________________________
Source: PCI Fibers
Global consumption of textile fibers grows based on population and affluence
Global Textile Markets
Approximately 170 billion pounds of textile fibers sold annually
3%+ annual growth in global textile fibers projected from 2011 to 2015
4%+ annual growth in global polyester fibers projected from 2011
to 2015
Polyester fibers’
growth in market share: 22% in 1990, 48% in 2010, projected at 51% in 2015
Cost efficient alternative to functional fibers
Superior functionality compared to commodity fibers like cotton
Man-made fibers allow more acreage for food supply in countries like
China |
 U.S. Textile
& Apparel Industry 7
___________________________
Source: NCTO , Textile World, and Fiber Economic Bureau
Remains a large and important component of the U.S. economy
Approximately a $51 billion industry in 2010
Investment of $15 billion in PP&E from 2001 to 2009
3
rd
largest
exporter
of
textile
products
-
$15
billion
Much of the exports utilize regional trade preferences
600,000 domestic employees (fiber to textile to apparel chain), one of the largest
manufacturing employers in the U.S.
45% productivity improvement over the last decade
One of the top industries’
among all U.S. industrial sectors
Modest revival of the regional textile and apparel industry during the last 2 years.
Around 30+ domestic and Central American plant expansions |
 U.S. Source of
Synthetic Apparel Supply 8
___________________________
Source: U.S. Dept. of Commerce, OTEXA, O’Rourke Group Partners, Unifi internal
estimates Regional market share has stabilized and is expected to remain flat or slightly
increase in 2011 Regional break-out of 18% share consists of 3.5% U.S. Domestic, 10%
CAFTA, and 4.5% NAFTA / ATPA Brands and retailers see regional supply as vital to their
global sourcing strategy and have indicated holding or increasing regional sourcing
levels during the next 3 years. SME
(Billion)
09
10
11
Est
Region
1.6
1.8
2.0
+16
%
+10
% |
 Comparative
Labor Cost Forecast 9
___________________________
Source: The Economist Intelligence Unit, O’Rourke Group Partners, Emerging Textiles, Unifi
Internal Estimates By
2015,
Chinese
labor
wages
are
forecasted
to
be
roughly
equal
to
Mexico
and
higher
than
CAFTA
Indian labor wages also following similar trends |
 Comparative
Lead Time 10
___________________________
Source: O’Rourke Group Partners |
 Regional Trade
(NAFTA / CAFTA / ATPA) U.S. and regional trading partners provide
competitive advantages
High-quality for critical end-uses
Product innovation
Compressed supply chain/quick turns
Competitive pricing
Duty-free movement among participants
Requires garment to be fully formed in region
Compliant yarn must be extruded in region
Duty free benefit –
28% to 32% on man-made
fiber garments
CAFTA Region
Regional imports dropped in 2009 due to economic
downturn plus the removal of China safeguards
Recovery in 2010, and continuing well into 2011.
Around 15+ companies have announced plant
expansions over the last 1 to 2 years.
Importance of Regional Trade –
Synthetic Apparel
11
Synthetic Apparel Imports from Central America
___________________________
Source: U.S. Dept. of Commerce, OTEXA, O’Rourke Group Partners, Unifi internal
estimates Apparel
Sourcing
Outlook
–
Retailer
/
Brand
Sourcing
Plan based on 70+ Companies
Increase or Hold
Regional Sourcing
Levels
80%
Additional Sourcing
Shift to Asia
20% |
 U.S. Market
Segmentation – FY 2011
Diverse product offering sells into the apparel, hosiery, furnishings, automotive and
industrial markets Compliant sales account for approximately 58% of the company’s
total sales Large majority of U.S. customers are domestic weavers and knitters
-
Most free trade benefits come through domestic customers’
shipments of fabrics into region
-
Regional yarn origin required in free trade agreements (NAFTA, CAFTA, ATPA)
Berry and Kissel Amendments require U.S. origin fiber/yarn for Military and Homeland Security
U.S. Sales by Segment
Diverse products and regional requirements
U.S. Sales by Origin Requirement
___________________________
(1) Compliant sales represent those sales to customers who utilize the terms of the NAFTA,
CAFTA, CBI, ATPA, and U.S. Military agreements to produce duty-free finished goods and US origin fiber
requirement. Estimates based on FY 2011 sales by category and division.
U.S. Direct Sales by Region
Commentary
12
Apparel
48%
Hosiery
17%
Furnishings
15%
Industrial
12%
Auto
5%
Other
3%
U.S.
Domestic
81%
NAFTA /
ATPA
8%
CAFTA
9%
Other
2%
Non-
Compliant
41%
Compliant
(1)
59% |
 U.S. Customer
& Channel Segmentation – FY 2011
Fiber/yarn demanded by a wide variety of customers
Approximately 600 polyester customers and approximately 200 nylon customers served from U.S.
operations
Top 5 U.S. customers include
Polyester –
Polartec, Milliken, Glen Raven, American & Efird, and International Textile Group
Nylon –
Hanesbrands (HBI), Acme-McCrary, Fruit of the Loom, Kayser Roth Hosiery and Bossong
Top 50 customers in the U.S. represent 65% of net sales
Healthy accounts receivable aging –
approximately 96% of accounts are current within 15 days
U.S. Sales by Customer
Strong diversity of customer base, distribution channels and products
Commentary
___________________________
(1) Sales by customer represent direct shipments from Unifi USA and excludes UCA sales
(2) Estimates for the combined Apparel and Hosiery Segments
(3) PVA Sales represent Unifi global PVA sales as a % of Unifi consolidated sales
Distribution Channel
(2)
13
(1)
Global PVA Sales
(3)
HBI, 9%
Next 4,
16%
Next 10,
17%
Next 35,
23%
Other,
34%
Mass
41%
Department
18%
Other,
15%
Specialty
26%
13%
15%
18%
0%
5%
10%
15%
20%
FY 2009
FY 2010
FY 2011 |
 Inventory in
the Apparel Supply Chain 14
___________________________
Source: US Census Bureau and Unifi internal estimates |
 15
Company Strategy |
 Our Operating
Environment Continued strength of retail apparel, with opportunities for further
improvement
Opportunity for growth in North/Central America region from new
investments across supply chain and realignment of sourcing patterns
Incremental growth in global yarn markets
Raw material pricing at historic high levels; long-term moderation expected
16
___________________________
Source: PCI Fibers, Unifi internal estimates |
 Operating
Strategies Further develop expansion opportunities in global growth markets
Central America, China and Brazil
17
Focus on continuous improvement, conversion margin integrity and
mix
enrichment –
with the goal of reducing cyclicality
Maximize growth opportunities developing in North/Central American regional
market
Aggressively grow our Premier Value Added (PVA) products, doubling sales
within 3 years from the start of fiscal 2011
Derive value from sustainability based initiatives, including polyester and nylon
recycling. |
 Brazil Market
Dynamics Polyester Textile Filament Market Trends
Skilled and experienced local management team
Market currently serviced by domestic production and imports
Proven market leader in local market
Flexible business model from production to sourcing
Strengthening currency impacts competitiveness of production model
Longer-term risk/opportunity from new market entrant
18
___________________________
Source: ABIT, ABRAFAS, Unifi internal estimates |
 China
Polyester Filament Market Dynamics Chinese Polyester Market
Chinese polyester production represents 65% of global market in 2009/2010
Textile filament market projected growth rates for 2010 to 2015 is estimated at 5%
Specialty and PVA yarn segment accounts for around 5% of the total market demand; and growth
is expected to outpace market rates
UTSC (Unifi Textiles (Suzhou) Ltd.)
Established wholly-owned sales and marketing business focused on the sale of high-end
and branded, premier value added products
Globalized production of key Unifi brands, including REPREVE
Strong downstream activity
Growing contribution to profits in fiscal 2012 and beyond
19
___________________________
Source: PCI Fibers, Unifi internal estimates |
 Investing in
the Region 20
November 2010
New 120,000 square feet facility
8 draw texturing & 27 twisting machines
Additional 4 draw texturing machines being
installed
165 new jobs
May 2011
$8 million investment
New 50,000 square feet facility
42 million pounds/year capacity
25 new jobs in North Carolina
Recycle rate of over 900 million PET
plastic bottles |
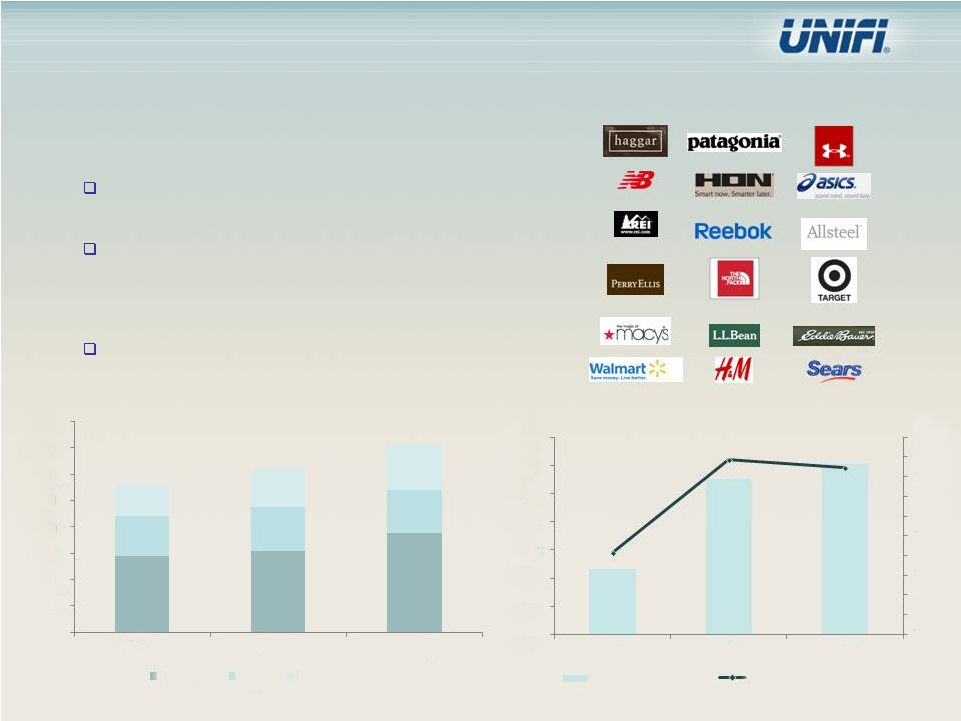
 Premier Value
Added products are key for future growth Branded / PVA Product Success
21
___________________________
Source: Unifi internal estimates
PVA portfolio represents approximately 12% of U.S. sales and 18%
of consolidated sales in fiscal 2011
Products utilized in apparel, contract, home furnishings, military, socks and hospitality
Steady investment in R&D and commercialization of PVA products remains a strategic
priority Sales Revenue –
U.S. PVA
Gross Profit -
U.S. PVA
Target is to double PVA sales and profit in 3 years |
 Our PVA
Downstream Partners 22 |
 Financial
Overview 23 |
 Summary of
Selected Financial Data ($ in millions) Consolidated Operating Results Overview
24
Projection
(2)
($ in millions)
FY12
Adjusted EBITDA
$45
Capital Expenditures
(8)
Cash Interest Expense
(14)
Cash Taxes
(5)
Free Cash Flow
$18
Working Capital source
12
Free Cash Flow Operations
$30
___________________________
(1) Adjusted EBTIDA excludes earnings from Parkdale America LLC and other unconsolidated equity
affiliates (2) FY 12 Projections based on midpoint of management’s publicly disclosed
guidance of low to high $40’s during the October 27, 2011 Earnings Conference call.
$558
$623
$713
Net Sales
Adjusted EBITDA margin
(1)
$290
$309
$376
$152
$165
$163
$117
$149
$174
8.9%
8.5%
0.0%
1.0%
2.0%
3.0%
4.0%
5.0%
6.0%
7.0%
8.0%
9.0%
10.0%
$-
$200
$400
$600
$800
$1,000
FY09
FY10
FY11
Polyester
Nylon
International
Adjusted EBITDA Margin |
 Parkdale
America, LLC ___________________________
1.
Includes
the
results
of
the
Hanesbrand
transaction,
which
closed
on
October
28,
2009.
2.
PAL
Adjusted
EBITDA
equals
the
sum
of
Income
from
Operations
and
Depreciation
and
Amortization
as
provided
in
our
June
26,
2011
From
10-K.
3.
EAP assistance program was enacted on August 1, 2008 as a part of the 2008 Farm Bill. The
program provides for economic assistance in the amount of 4 cents per pound of cotton consumed
and
the
program
generally
requires
the
economic
assistance
to
be
re-invested
into
qualifying
capital
expenditures.
25
($ in millions)
FY 2008
FY 2009
FY 2010
FY 2011
(1)
Net Sales
$460.5
$408.8
$599.9
$1,110.2
% change
4.6%
(11.2%)
46.7%
Income from Operations
$10.4
$14.1
$37.4
$70.1
Depreciation and Amortization
$17.8
$18.8
$21.2
$31.9
PAL Adjusted EBITDA
$28.2
$32.9
$58.6
$102.0
(2)
% of Net Sales
6.1%
8.0%
9.8%
9.2%
EAP Cotton Rebate Program
(3)
Economic Assitance Received
$0.0
$14.0
$22.3
$28.8
Amount Recognized into Income
$0.0
$5.8
$16.2
$40.2
Deferred Benefit
$0.0
$8.2
$6.1
($11.4)
% of Net Sales
0.0%
2.0%
1.0%
(1.0%) |
 No
on-going maintenance covenants Limited ability to make restricted payments
Restrictions on use of proceeds from asset
sales
Incurrence of additional indebtedness covenant
of 2 to 1 times fixed charge coverage
Callable by Company at anytime at the
following redemption prices
102.875 from May 2011
Par from May 2012
$124
$124
mm
mm
2014
2014
Senior
Senior
Secured
Secured
Notes
Notes
–
–
11.5%
11.5%
First Amended Revolving Credit Agreement
First Amended Revolving Credit Agreement
$100mm facility, matures September 2015
Secured by eligible working capital
No on-going maintenance covenants, as long as
availability is greater than 15% of facility
Limited restricted payment provisions, as long as
availability is greater than 27.5% of facility
Provisions to facilitate refinance/repayment of
2014 Notes
Interest based on LIBOR+200 bps to 275 bps
Unifi has a stable capital structure with covenant-lite debt instruments and no near-term
maturities 26
Maturity profile at September 2011 ($mm)
Maturity profile at September 2011 ($mm)
Long-term Capital Structure
$40
$124
$60
0
20
40
60
80
100
120
140
2011
2012
2013
2014
2015
2016
RC Balance
11.5% Senior Notes
RC Availability |
 Capital
Strategy = Optimizing Cost of Capital 27
Focus on cash generation, across all business process including inventory
management
Fund growth working capital and capital expenditure requirements
required to
develop incremental growth opportunities
Utilize cash flow generated from operations and dividends from PAL to reduce
borrowings under 2015 revolving credit facility.
Reduce cost of capital by utilizing excess availability under revolving credit
facility to redeem 11.5% senior secured notes, due May 2014
Fix LIBOR rate on minimal level of revolving credit borrowings (currently $35
million) through May 2013 |
 Summary and
Review Some inflationary pressures, but generally a stable operating environment
Various incremental growth opportunities through increased retail volumes
and re-balancing of sourcing towards North/Central America region
Focus on continuous improvement, margin integrity and mix enrichment
Expansion opportunities in global growth markets
Central America, China and Brazil
Aggressively growing Premier Value-Added products –
especially Repreve
Continued improvement of Balance Sheet and related benefits from
optimizing cost of capital
28 |
 29
Questions |
 30
Appendix Slides |
 Adjusted
EBITDA Reconciliation 31
(Dollars in thousands)
FY 2009
FY 2010
FY 2011
Net income (loss)
(48,996)
$
10,685
$
25,089
$
Provision (benefit) for income taxes
4,301
7,686
7,333
Interest expense, net
20,219
18,764
16,679
Depreciation and amortization expense
31,326
26,312
25,562
EBTIDA
6,850
$
63,447
$
74,663
$
Equity in earnings of unconsolidated affiliates
(3,251)
(11,693)
(24,352)
Consolidated EBTIDA
3,599
$
51,754
$
50,311
$
Goodwill impairment
18,930
100
-
Non-cash compensation, net of distributions
1,500
2,555
1,361
Gain on extinguishment of debt
(251)
(54)
3,337
Restructuring charges (recoveries)
91
739
1,484
Start up costs
-
1,027
3,065
Impairment of investment in unconsolidated affiliates
1,483
-
-
Other
(2,067)
(865)
902
Adjusted EBITDA
23,285
$
55,256
$
60,460
$ |
 Non-GAAP
Financial Measures 32
Included in this presentation are certain
non-GAAP financial measures designed to complement the financial information presented in accordance with generally accepted accounting
principles in the United States of America ("GAAP") because management believes such measures
are useful to investors. EBITDA, Consolidated EBITDA and Adjusted EBITDA
EBITDA represents net income or loss before income tax expense, net interest expense, and depreciation
and amortization expense (excluding interest portion of amortization). Consolidated
EBITDA represents EBITDA adjusted to exclude equity in earnings and losses of unconsolidated affiliates. Adjusted EBITDA represents Consolidated EBITDA adjusted to
exclude restructuring charges, startup costs, non-cash compensation expense net of distributions,
gains or losses on extinguishment of debt, and other adjustments. Other adjustments
include gains or losses on sales or disposals of property, plant and equipment and currency and
derivative gains or losses. We present Adjusted EBITDA as a supplemental measure of our
operating performance and ability to service debt. We also present Adjusted EBITDA because we believe such measure is frequently used by securities analysts, investors and other
interested parties in the evaluation of companies in our industry and in measuring the ability of
“high-yield” issuers to meet debt service obligations. EBITDA, Consolidated EBITDA and Adjusted EBITDA are alternative views of performance used by
management and we believe that investors’ understanding of our performance is enhanced by
disclosing these performance measures. Our management uses Adjusted EBITDA: (i) as a measurement of operating performance because it assists us in comparing our
operating performance on a consistent basis as it removes the impact of (a) items directly related to
our asset base (primarily depreciation and amortization) and (b) unusual items that we would
not expect to occur as a part of our normal business on a regular basis; (ii) for planning purposes, including the preparation of our annual operating budget; (iii) as a valuation
measure for evaluating our operating performance and our capacity to incur and service debt, fund
capital expenditures and expand our business; and (iv) as one measure in determining the value
of other acquisitions and dispositions. Adjusted EBITDA is also a key performance metric utilized in the determination of variable compensation.
We believe that the use of EBITDA, Consolidated EBITDA and Adjusted EBITDA as operating performance
measures provides investors and analysts with a measure of operating results unaffected by
differences in capital structures, capital investment cycles, and ages of related assets, among otherwise comparable companies. We also believe Adjusted EBITDA is an
appropriate supplemental measure of debt service capacity, because cash expenditures on interest are,
by definition, available to pay interest, and tax expense is inversely correlated to interest
expense because tax expense decreases as deductible interest expense increases; depreciation and amortization are non-cash charges. Equity in earnings and losses of
unconsolidated affiliates is excluded because such earnings or losses do not reflect our operating
performance. The other items excluded from Adjusted EBITDA are excluded in order to
better reflect the performance of our continuing operations.
In evaluating EBITDA, Consolidated EBITDA and Adjusted EBITDA, you should be aware that in the future
we may incur expenses similar to the adjustments in this presentation. Our presentation of
EBITDA, Consolidated EBITDA and Adjusted EBITDA should not be construed as an inference that our future results will be unaffected by unusual or non-recurring items.
EBITDA, Consolidated EBITDA, and Adjusted EBITDA are not measurements of our financial performance
under GAAP and should not be considered as alternatives to net income, operating income or any
other performance measures derived in accordance with GAAP or as an alternative to cash flow from operating activities as a measure of our liquidity.
|
 Continued
Non-GAAP Financial Measures
33
Our Adjusted EBITDA measure has limitations as an analytical tool, and you should not consider
it in isolation or as a substitute for analysis of our results as reported under GAAP.
Some of these limitations are: • it does not reflect our cash expenditures, future requirements for capital
expenditures or contractual commitments; • it does not reflect changes in, or cash requirements for, our working capital
needs; • it does not reflect the significant interest expense or the cash requirements
necessary to service interest or principal payments on our debt;
• although depreciation and amortization are non-cash charges, the assets being
depreciated and amortized will often have to be replaced in the future, and our Adjusted
EBITDA measure does not reflect any cash requirements for such replacements;
• it is not adjusted for all non-cash income or expense items that are reflected
in our statements of cash flows; • it does not reflect the impact of earnings or charges resulting from matters we
consider not be indicative of our ongoing operations; • it does not reflect limitations on or costs related to transferring earnings from
our subsidiaries to us; and • other companies in our industry may calculate this measure differently than we do,
limiting its usefulness as a comparative measure. Because of these limitations, Adjusted EBITDA should not be considered
as a measure of discretionary cash available to us to invest in the growth of our
business or as a measure of cash that will be available to us to meet our obligations, including those under the notes. You should compensate
for these limitations by relying primarily on our GAAP results and using Adjusted EBITDA only
supplementally. Projected fiscal year 2012 Adjusted EBITDA, Free Cash Flow and Free Cash Flow Operations: With respect to the forward-looking non-GAAP financial measures "Adjusted EBITDA,"
"Free Cash Flow" and "Free Cash Flow Operations" we referenced for fiscal 2012,
the comparable GAAP financial measure "Net Income" is not accessible on a forward-looking basis. For purposes of
reconciling the forward-looking Adjusted EBITDA, we would make adjustments of the type referenced
for prior periods, and we would estimate the material adjustments for interest expense, income
tax, and depreciation and amortization to be $14 million, $5 million, and $27 million, respectively, for
fiscal 2012. For purposes of reconciling the forward-looking Free Cash Flow, we would
estimate the material adjustments for capital expenditures, cash interest expense and
cash taxes to be $8 million, $14 million, and $$5 million, respectively, for fiscal 2012. For purposes of reconciling the
forward-looking Free Cash Flow Operations, we would estimate the material adjustments for working
capital source to be $12 million source for fiscal 2012. The forward-looking
adjustment for equity in (earnings) losses of unconsolidated affiliates cannot be reasonably estimated. |
 34
|