Attached files
| file | filename |
|---|---|
| 8-K - LAYNE CHRISTENSEN COMPANY 8-K - LAYNE CHRISTENSEN CO | a50067283.htm |
Exhibit 99.1
Layne Christensen Company Investor Presentation November 2011
Cautionary Language Regarding Forward-Looking Statements This presentation may contain forward-looking statements within the meaning of Section 27A of the Securities Act of 1933 and Section 21E of the Exchange Act of 1934. Such statements may include, but are not limited to, statements of plans and objectives, statements of future economic performance and statements of assumptions underlying such statements, and statements of management’s intentions, hopes, beliefs, expectations or predictions of the future. Forward-looking statements can often be identified by the use of forward-looking terminology, such as “should,” “intended,” “continue,” “believe,” “may,” “hope,” “anticipate,” “goal,” “forecast,” “plan,” “estimate” and similar words or phrases. Such statements are based on current expectations and are subject to certain risks, uncertainties and assumptions, including but not limited to: the outcome of the ongoing internal investigation into, among other things, the legality, under the FCPA and local laws, of certain payments made to agents and government officials in certain countries in Africa relating to the payment of taxes, the importing of equipment and the employment of expatriates (including any government enforcement action which could arise out of the matters under review or that the matters under review may have resulted in a higher dollar amount of payments or may have a greater financial or business impact than management currently anticipates), prevailing prices for various commodities, unanticipated slowdowns in the Company’s major markets, the availability of credit, the risks and uncertainties normally incident to the construction industry and exploration for and development and production of oil and gas, the impact of competition, the effectiveness of operational changes expected to increase efficiency and productivity, worldwide economic and political conditions and foreign currency fluctuations that may affect worldwide results of operations. Should one or more of these risks or uncertainties materialize, or should underlying assumptions prove incorrect, actual results may vary materially and adversely from those anticipated, estimated or projected. These forward-looking statements are made as of the date of this filing, and the Company assumes no obligation to update such forward-looking statements or to update the reasons why actual results could differ materially from those anticipated in such forward-looking statements.
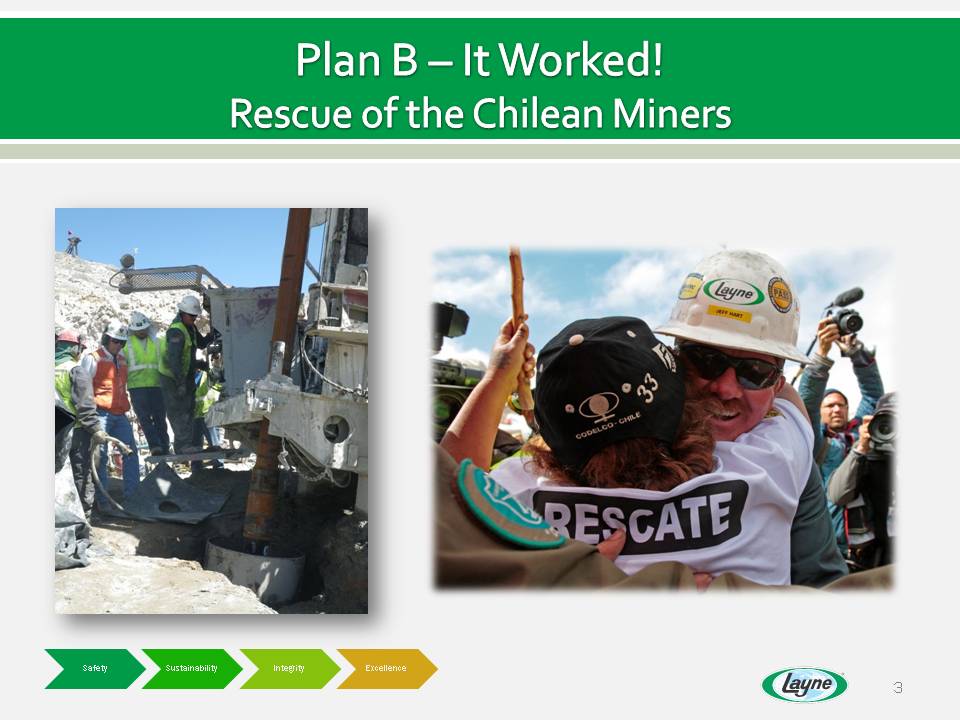
Plan B – It Worked! Rescue of the Chilean Miners
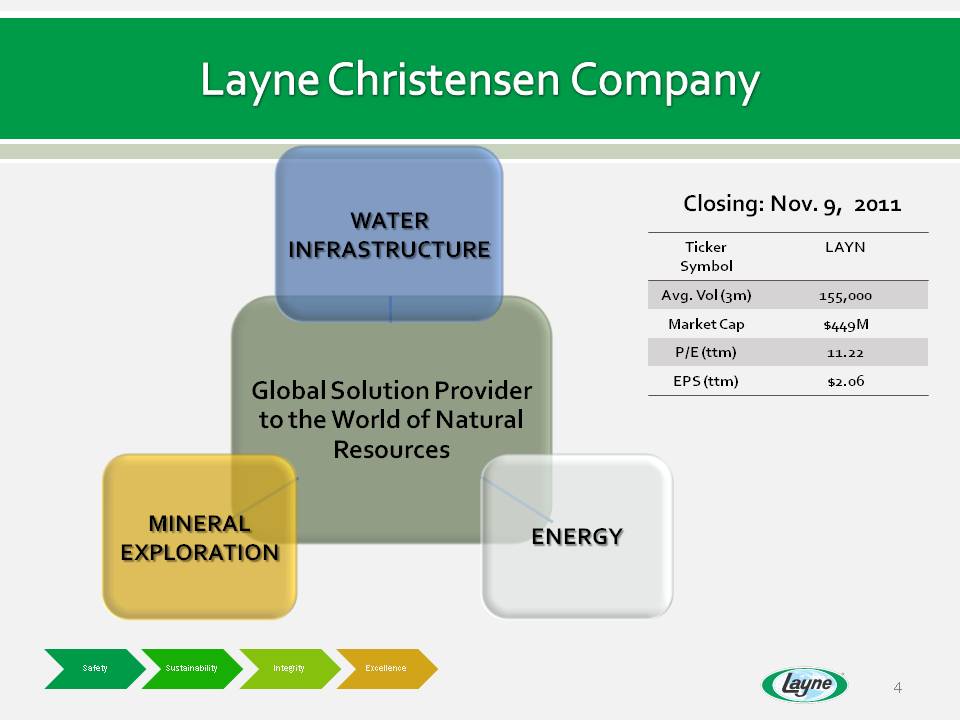
Closing: Nov. 9, 2011 Ticker Symbol LAYN Avg.Vol (3m) 155,000 Market Cap $449M P/E (ttm) 11.22 EPS (ttm) $2.06
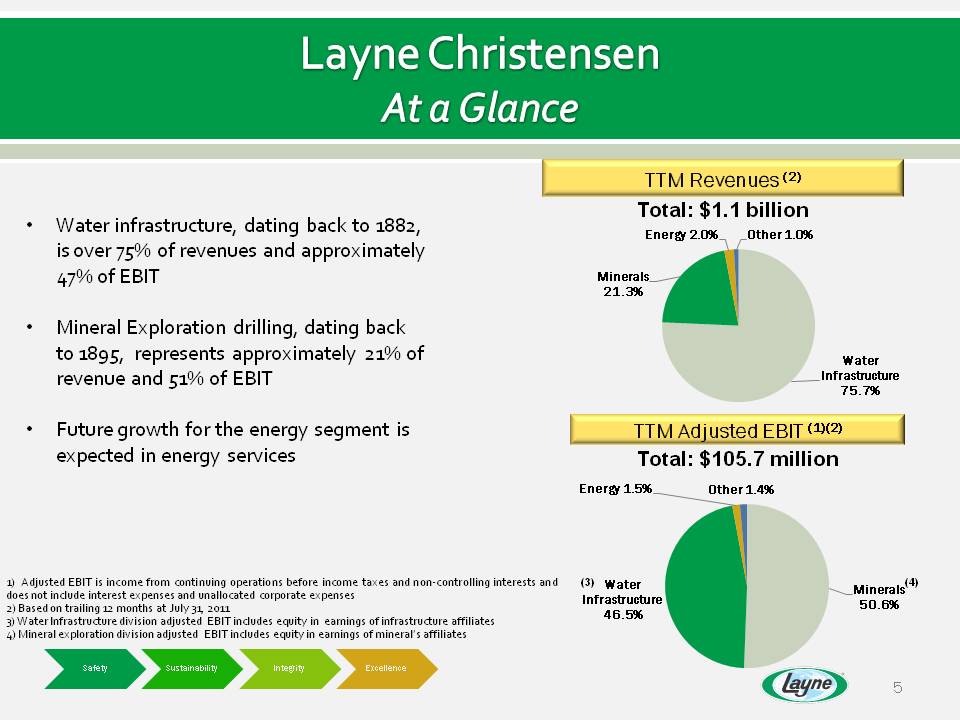
Layne Christensen At a Glance 1) Adjusted EBIT is income from continuing operations before income taxes and non-controlling interests and does not include interest expenses and unallocated corporate expenses2) Based on trailing 12 months at July 31, 20113) Water Infrastructure division adjusted EBIT includes equity in earnings of infrastructure affiliates4) Mineral exploration division adjusted EBIT includes equity in earnings of mineral’s affiliates Total: $1.1 billion Total: $105.7 million TTM Revenues (2) TTM Adjusted EBIT (1)(2) Water infrastructure, dating back to 1882, is over 75% of revenues and approximately 47% of EBITMineral Exploration drilling, dating back to 1895, represents approximately 21% of revenue and 51% of EBITFuture growth for the energy segment is expected in energy services (3) (4)
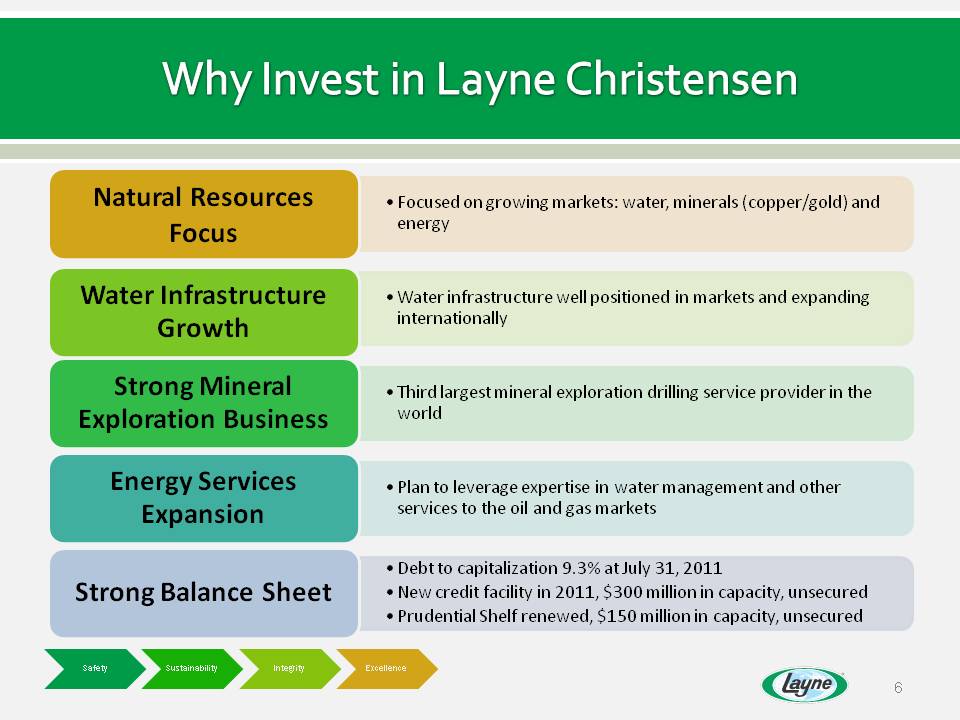
• Focused growing markets: water minerals (copper/gold) and Natural Resources on water, energy Focus •Water infrastructure well positioned in markets and expanding Water Infrastructure internationally Growth •Third largest mineral exploration drilling service provider in the world Strong Mineral E l ti B i Exploration Business •Plan to leverage expertise in water management and other services to the oil and gas markets Energy Services Expansion •Debt to capitalization 9.3% at July 31, 2011 •New credit facility in 2011, $300 million in capacity, unsecured • Prudential Shelf renewed $150 capacity Strong Balance Sheet Safety Sustainability Integrity Excellence renewed, million in capacity, unsecured
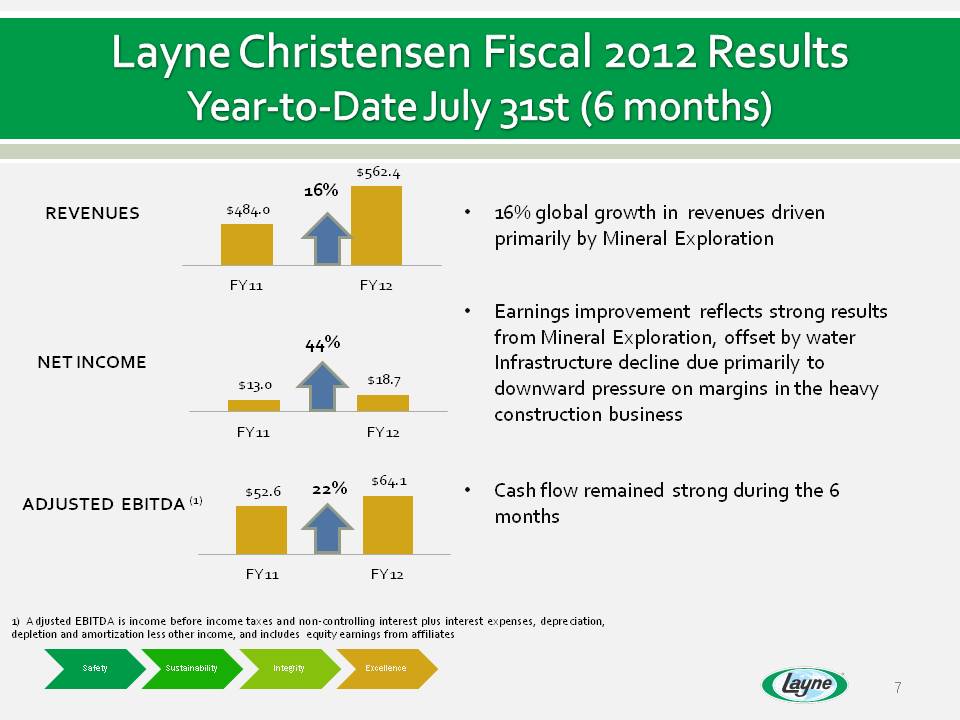
Layne Christensen Fiscal 2012 Results Year-to-Date July 31st (6 months) 16% global growth in revenues driven primarily by Mineral ExplorationEarnings improvement reflects strong results from Mineral Exploration, offset by water Infrastructure decline due primarily to downward pressure on margins in the heavy construction businessCash flow remained strong during the 6 months REVENUES NET INCOME ADJUSTED EBITDA (1) 16% 1) Adjusted EBITDA is income before income taxes and non-controlling interest plus interest expenses, depreciation, depletion and amortization less other income, and includes equity earnings from affiliates
1) Adjusted EBITDA is income before income taxes and non-controlling interest plus interest expense, depreciation, depletion and amortization less other income, and includes equity earnings from affiliates

Water Infrastructure Division Integrated Provider of Infrastructure Services Across the Water Cycle
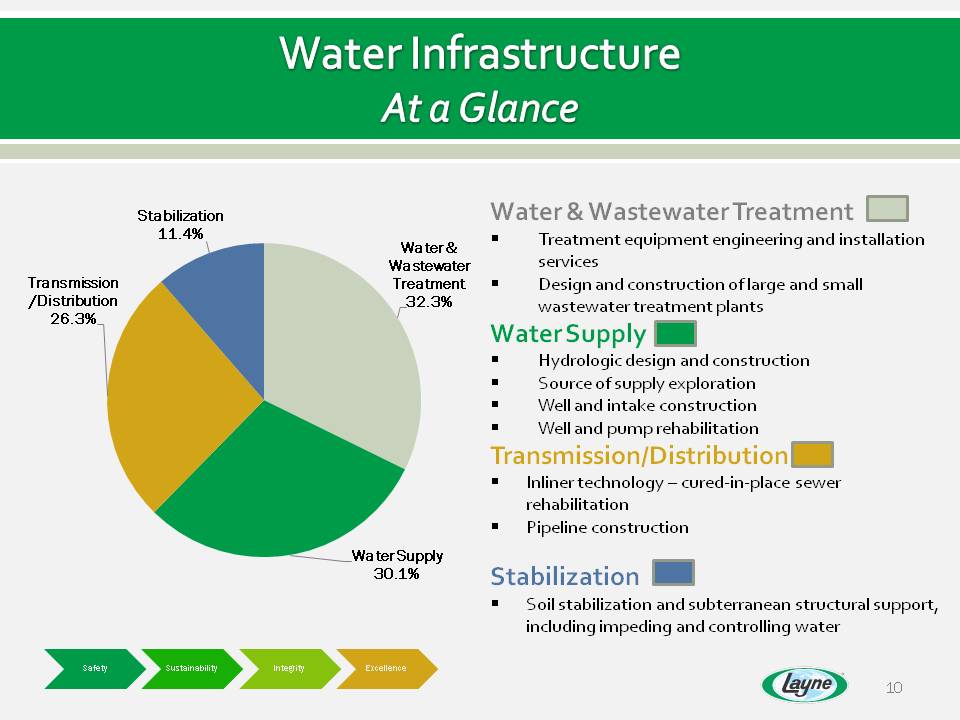
Water & Wastewater Treatment Treatment equipment engineering and installation services Design and construction of large and small wastewater treatment plantsWater Supply Hydrologic design and constructionSource of supply explorationWell and intake constructionWell and pump rehabilitationTransmission/DistributionInliner technology – cured-in-place sewer rehabilitationPipeline constructionStabilization Soil stabilization and subterranean structural support, including impeding and controlling water Water Infrastructure
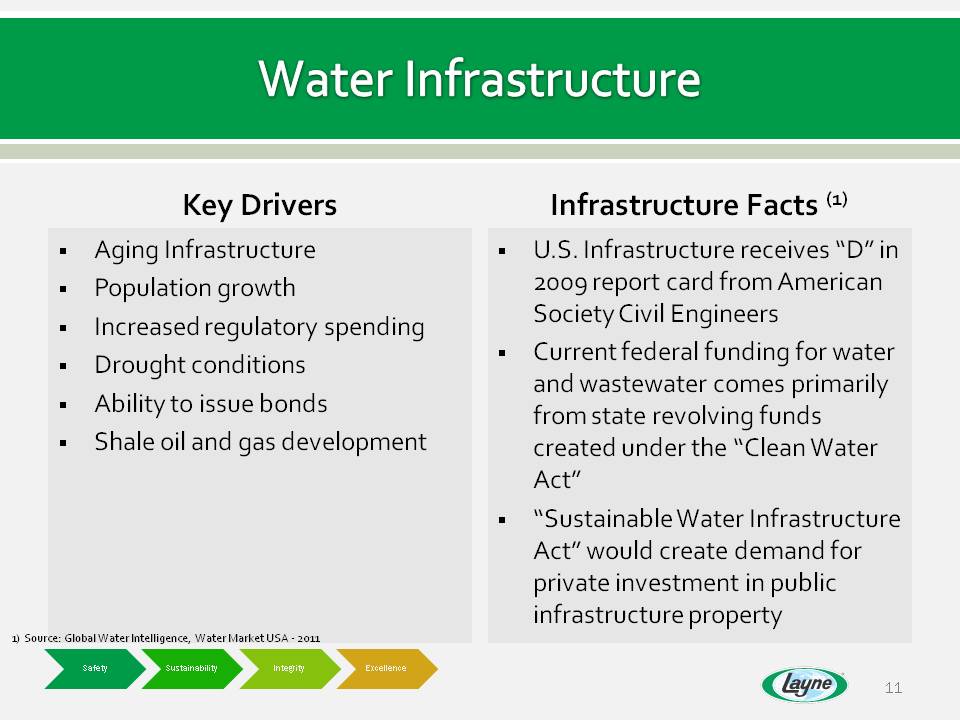
Water Infrastructure Key Drivers Aging InfrastructurePopulation growthIncreased regulatory spendingDrought conditionsAbility to issue bondsShale oil and gas developmentBody: Infrastructure Facts (1) U.S. Infrastructure receives “D” in 2009 report card from American Society Civil EngineersCurrent federal funding for water and wastewater comes primarily from state revolving funds created under the “Clean Water Act”“Sustainable Water Infrastructure Act” would create demand for private investment in public infrastructure property
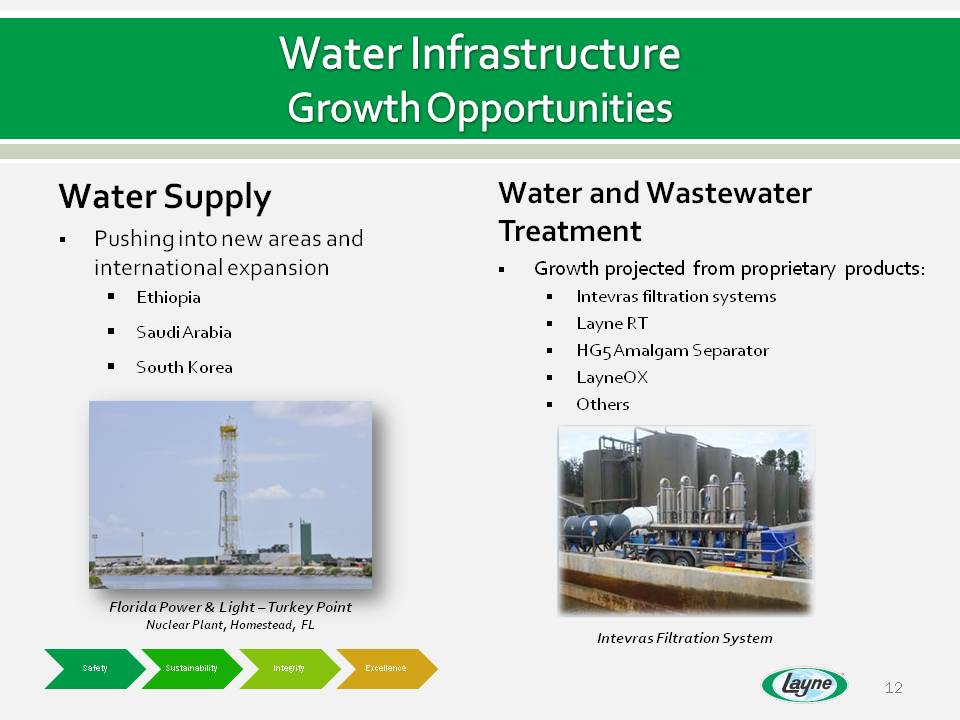
Water Infrastructure Growth Opportunities Water Supply Pushing into new areas and international expansionEthiopiaSaudi ArabiaSouth Korea Water and Wastewater Treatment Growth projected from proprietary products:Intevras filtration systemsLayne RTHG5 Amalgam SeparatorLayneOXOthers Intevras Filtration System Florida Power & Light – Turkey Point Nuclear Plant, Homestead, FL
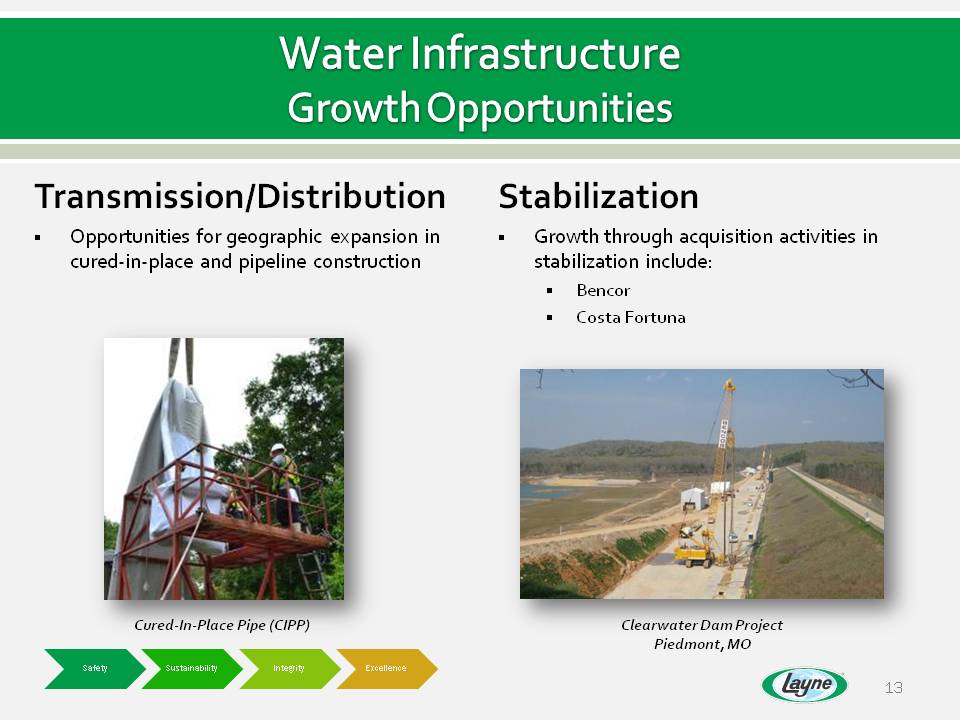
Water Infrastructure Growth Opportunities Stabilization Growth through acquisition activities in stabilization include: BencorCosta Fortuna Transmission/Distribution Opportunities for geographic expansion in cured-in-place and pipeline construction
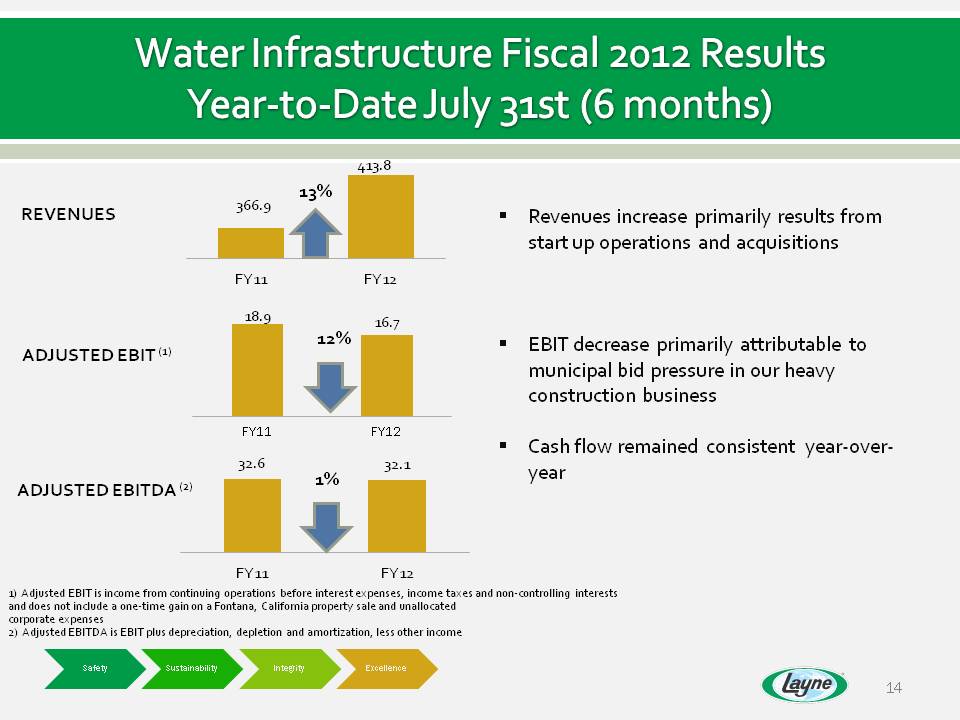
Revenues increase primarily results from start up operations and acquisitionsEBIT decrease primarily attributable to municipal bid pressure in our heavy construction businessCash flow remained consistent year-over-yearTitle: Water Infrastructure Fiscal 2012 Results Year-to-Date July 31st (6 months) ADJUSTED EBIT (1) ADJUSTED EBITDA (2) REVENUES 13% 1% 1) Adjusted EBIT is income from continuing operations before interest expenses, income taxes and non-controlling interestsand does not include a one-time gain on a Fontana, California property sale and unallocated corporate expenses2) Adjusted EBITDA is EBIT plus depreciation, depletion and amortization, less other income 12%
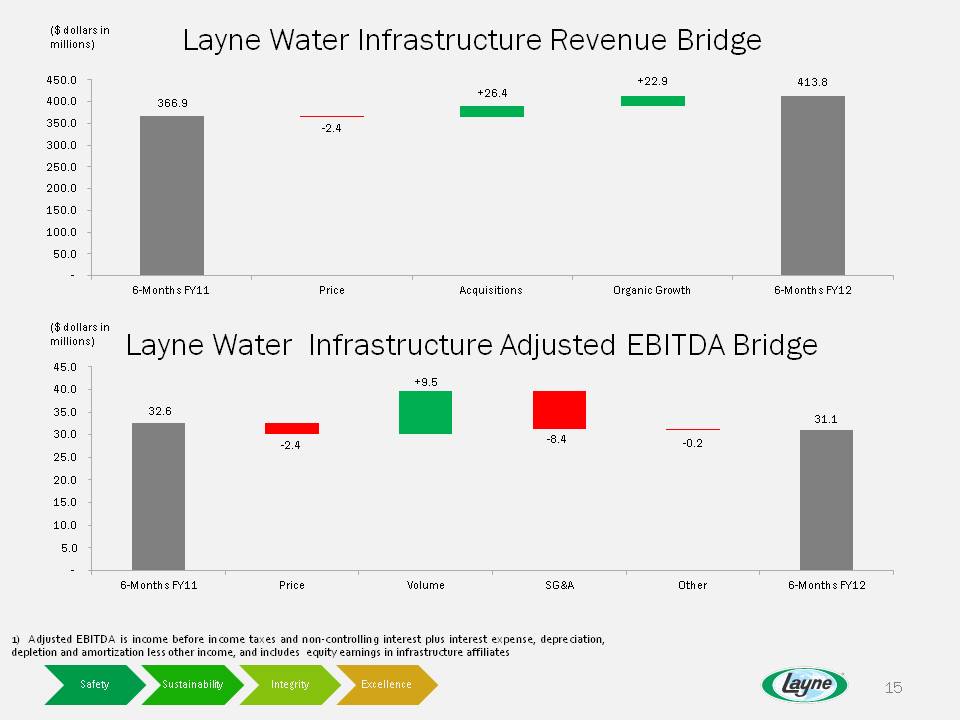
1) Adjusted EBITDA is income before income taxes and non-controlling interest plus interest expense, depreciation, depletion and amortization less other income, and includes equity earnings in infrastructure affiliates
Water Infrastructure Strategy Leverage extensive customer base to expand scope of services soldTurnkey water and wastewater treatment offeringsExpand services across the water and infrastructure cyclesDeploy the integrated water infrastructure platform into new markets (domestic and international) organically and through merger opportunitiesExpand in industrial markets where water infrastructure needs are extensive and mission criticalOrganic and acquisition growthOil and gas applications
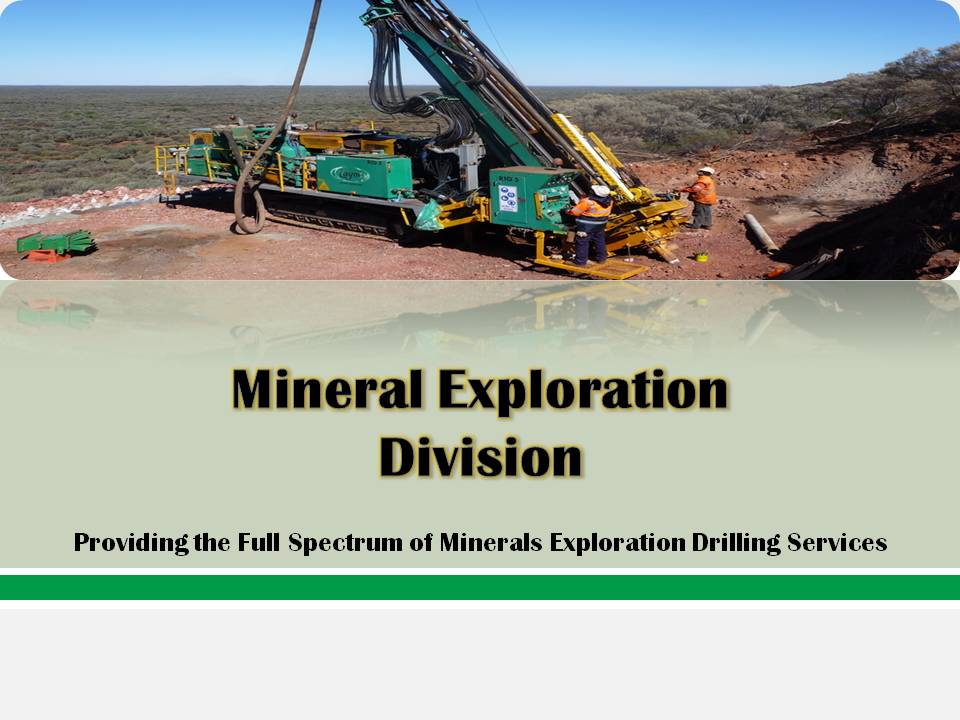
Mineral Exploration Division Providing the Full Spectrum of Minerals Exploration Drilling
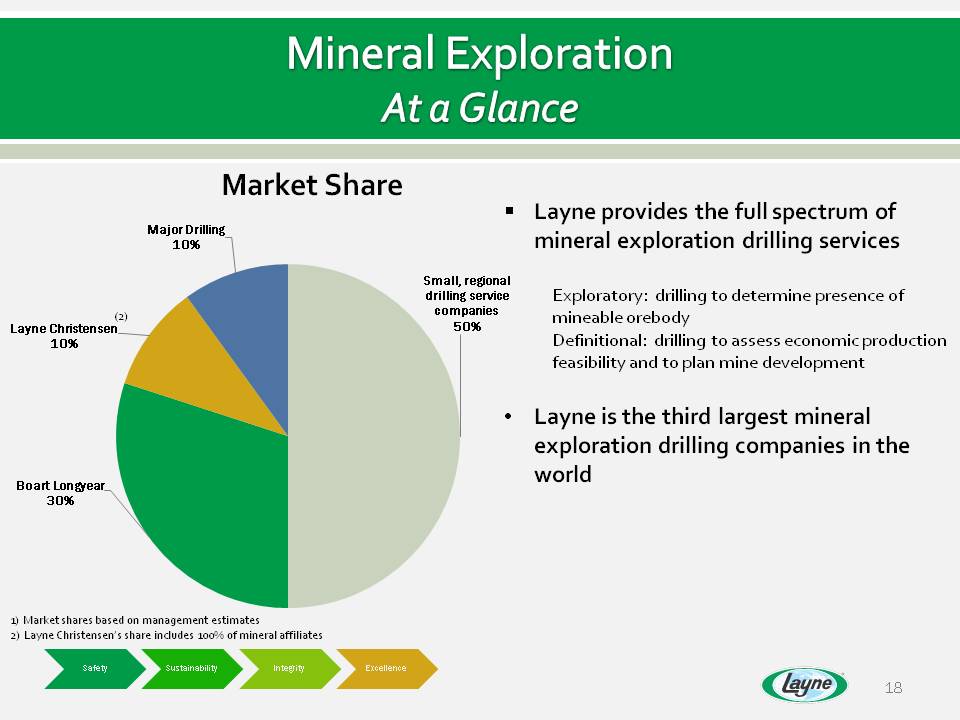
Mineral Exploration At a Glance Layne provides the full spectrum of mineral exploration drilling servicesExploratory: drilling to determine presence of mineable orebodyDefinitional: drilling to assess economic production feasibility and to plan mine development Layne is the third largest mineral exploration drilling companies in the world 1) Market shares based on management estimates2) Layne Christensen’s share includes 100% of mineral affiliates
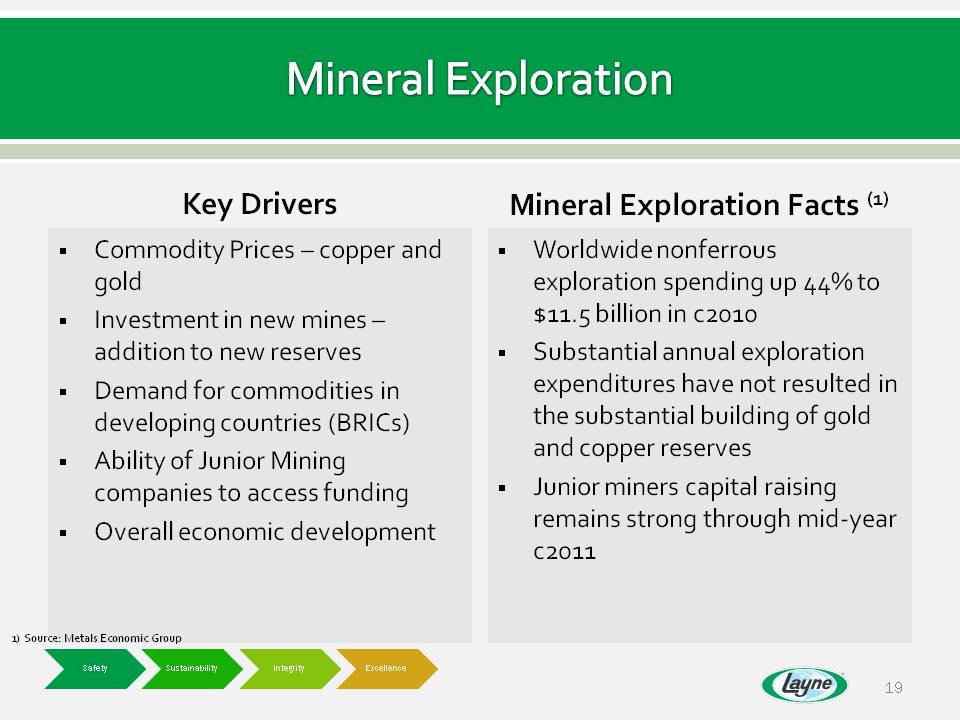
Mineral Exploration Key Drivers Commodity Prices – copper and goldInvestment in new mines –addition to new reservesDemand for commodities in developing countries (BRICs)Ability of Junior Mining companies to access fundingOverall economic development Mineral Exploration Facts (1) Worldwide nonferrous exploration spending up 44% to $11.5 billion in c2010Substantial annual exploration expenditures have not resulted in the substantial building of gold and copper reservesJunior miners capital raising remains strong through mid-year c2011 1) Source: Metals Economic Group
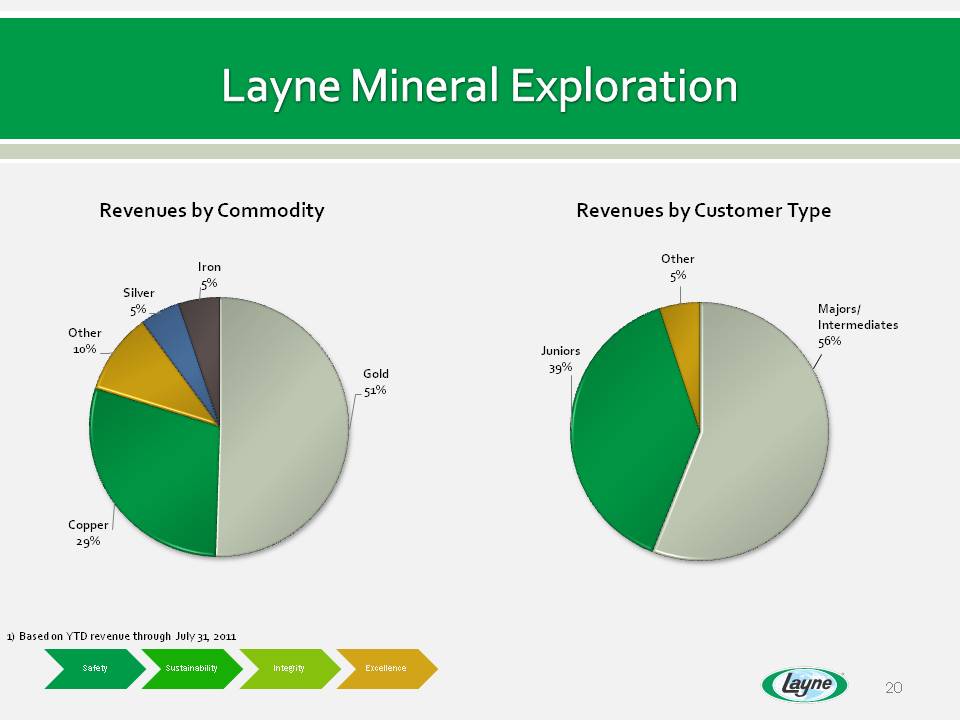
Layne Mineral Exploration Revenues by Commodity Revenues by Customer Type
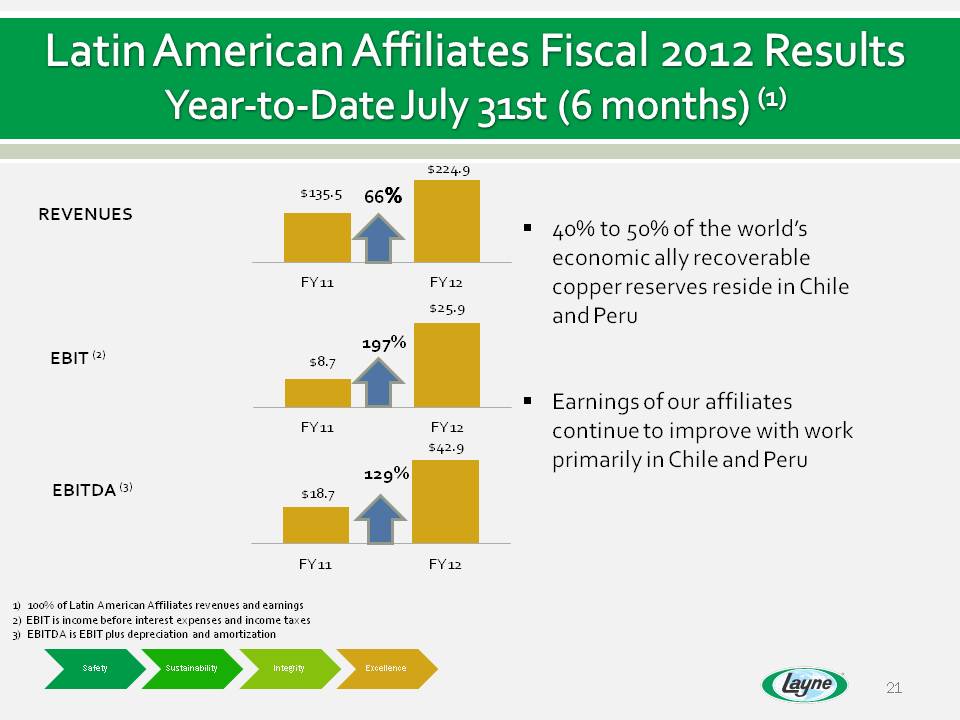
40% to 50% of the world’s economic ally recoverable copper reserves reside in Chile and PeruEarnings of our affiliates continue to improve with work primarily in Chile and Peru Title: Latin American Affiliates Fiscal 2012 Results Year-to-Date July 31st (6 months) (1) REVENUES EBIT (2) EBITDA (3) 66% 197% 129% 1) 100% of Latin American Affiliates revenues and earnings 2) EBIT is income before interest expenses and income taxes3) EBITDA is EBIT plus depreciation and amortization
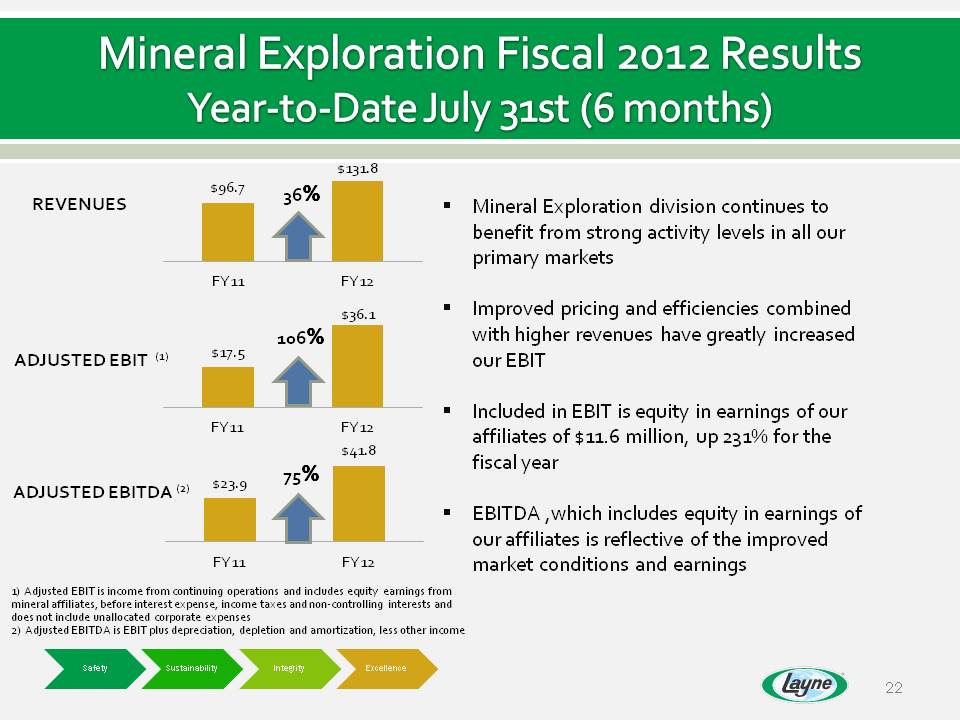
Mineral Exploration Fiscal 2012 Results Year-to-Date July 31st (6 months) Mineral Exploration division continues to benefit from strong activity levels in all our primary marketsImproved pricing and efficiencies combined with higher revenues have greatly increased our EBITIncluded in EBIT is equity in earnings of our affiliates of $11.6 million, up 231% for the fiscal yearEBITDA ,which includes equity in earnings of our affiliates is reflective of the improved market conditions and earnings REVENUES ADJUSTED EBIT (1) ADJUSTED EBITDA (2) 36% 106% 75% 1) Adjusted EBIT is income from continuing operations and includes equity earnings from mineral affiliates, before interest expense, income taxes and non-controlling interests and does not include unallocated corporate expenses2) Adjusted EBITDA is EBIT plus depreciation, depletion and amortization, less other income
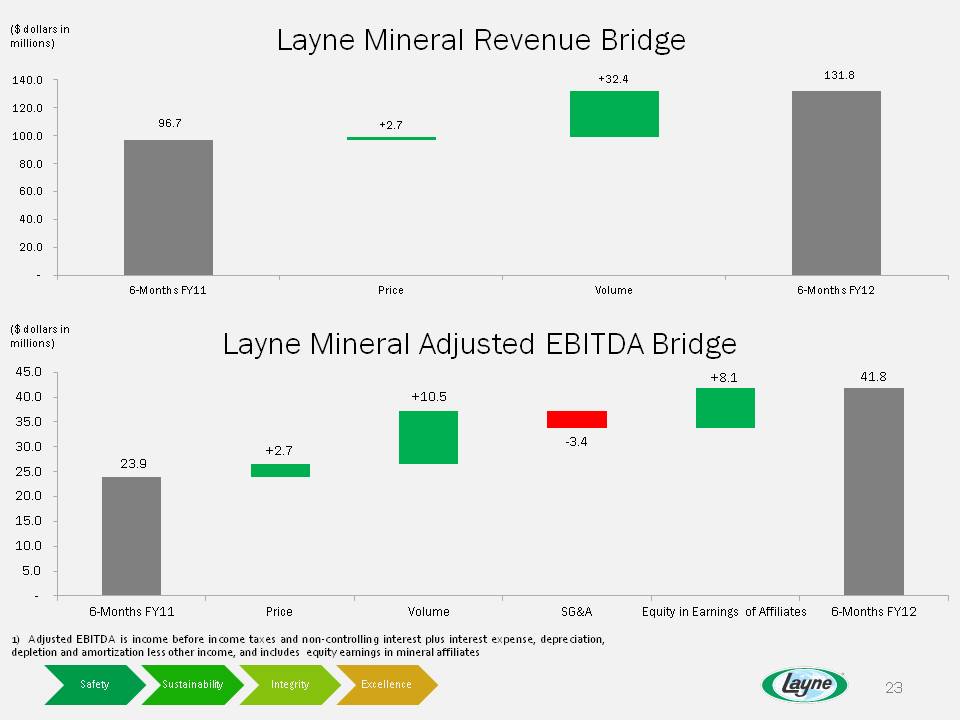
1) Adjusted EBITDA is income before income taxes and non-controlling interest plus interest expense, depreciation, depletion and amortization less other income, and includes equity earnings in mineral affiliates
Mineral Exploration Strategy Increase pricing while holding market shareExpand organically and through acquisitionsContinue expansion of start-up operations in BrazilEmphasis on retaining key employees in the current marketContinue to replace older and inefficient gear – emphasis on safetyEnhance global compliance of Company standards
Energy Division
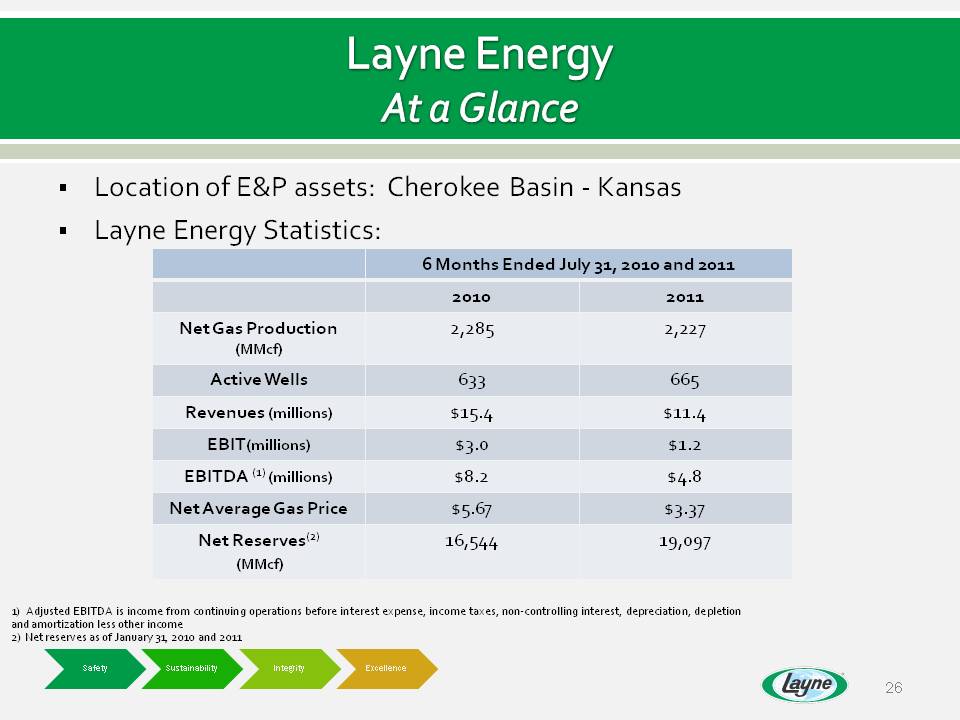
Layne Energy At a Glance Location of E&P assets: Cherokee Basin - KansasLayne Energy Statistics: 1) Adjusted EBITDA is income from continuing operations before interest expense, income taxes, non-controlling interest, depreciation, depletion and amortization less other income2) Net reserves as of January 31, 2010 and 2011
Energy Strategy Hold production at current levels short termDrill current leasing requirementsGrowth capital expenditures limited to internal free cash flowPlan to leverage expertise in water management and other services to expand energy services
Appendix Financial Review

Consolidated Results
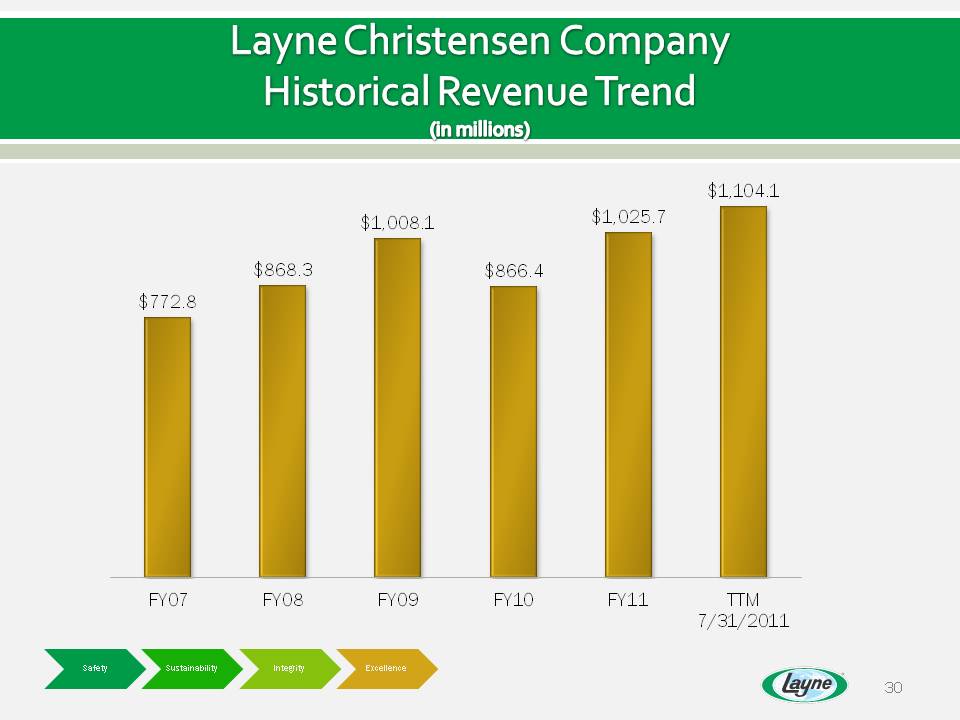
Layne Christensen Company Historical Revenue Trend (in millions)
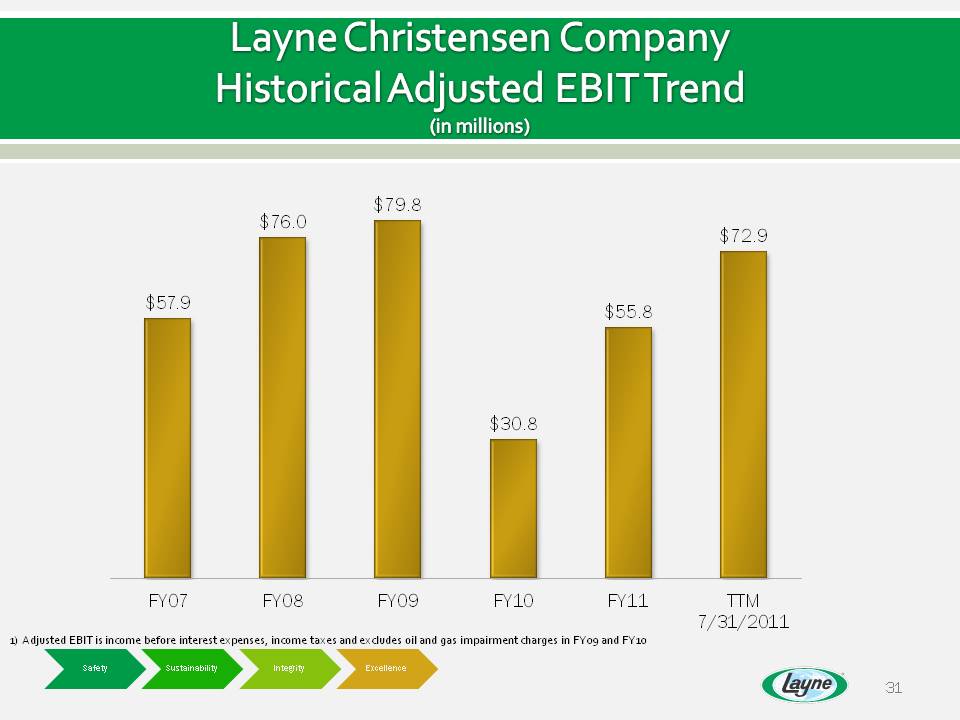
Layne Christensen Company Historical Revenue Trend (in millions) $79 8 $57.9 $76.0 79.8 $55 8 $72.9 55.8 $30.8 FY07 FY08 FY09 FY10 FY11 TTM 7/31/2011 Safety Sustainability Integrity Excellence 1) Adjusted EBIT is income before interest expenses, income taxes and excludes oil and gas impairment charges in FY09 and FY10
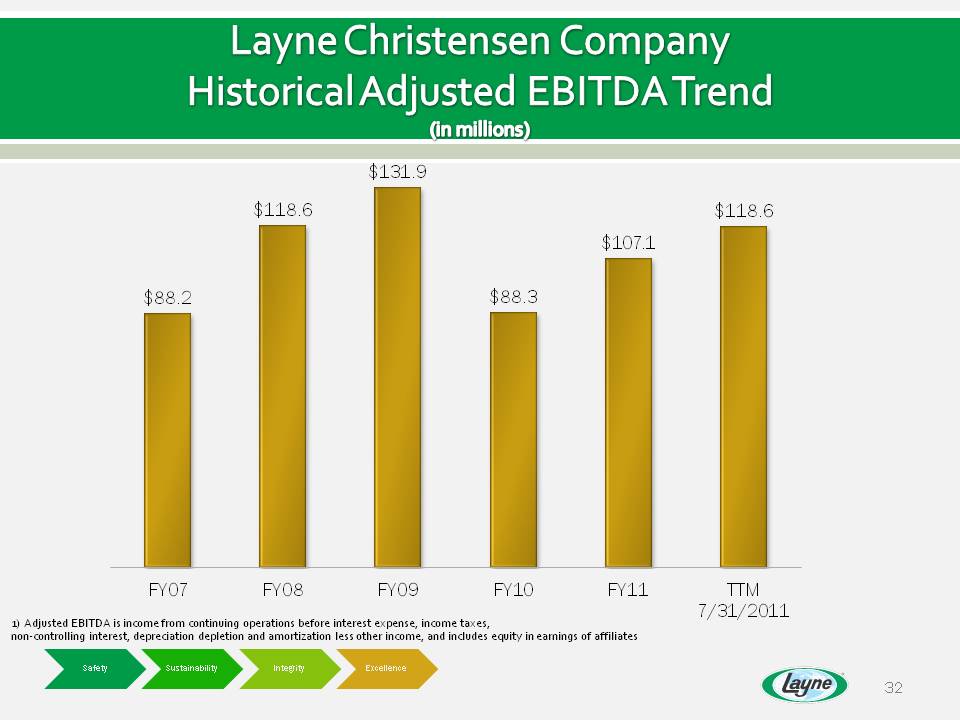
Layne Christensen Company Historical Adjusted EBITDA Trend $118 6 $131.9 $118 6 $88.2 118.6 $88.3 $107.1 118.6 FY07 FY08 FY09 FY10 FY11 TTM 7/31/2011 Safety Sustainability Integrity Excellence 1) Adjusted EBITDA is income from continuing operations before interest expense, income taxes, non‐controlling interest, depreciation depletion and amortization less other income, and includes equity in earnings of affiliates
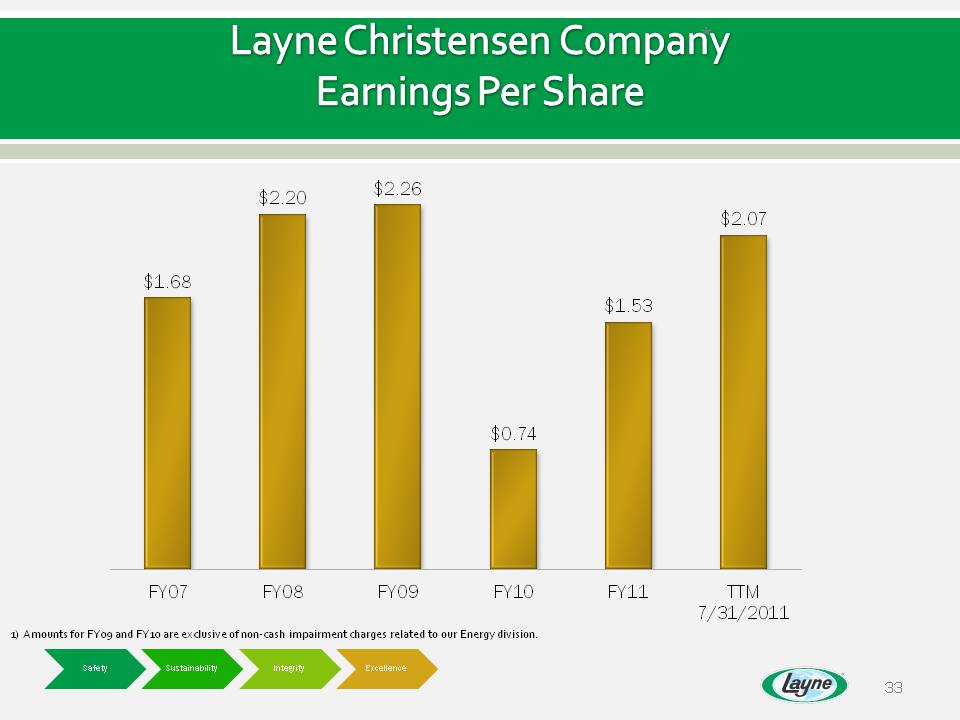
Layne Christensen Company Earnings Per Share $2.20 $2.26 $1.68 $1 53 $2.07 1.53 $0.74 FY07 FY08 FY09 FY10 FY11 TTM 7/31/2011 Safety Sustainability Integrity Excellence 1) Amounts for FY09 and FY10 are exclusive of non‐cash impairment charges related to our Energy division.

Division Results
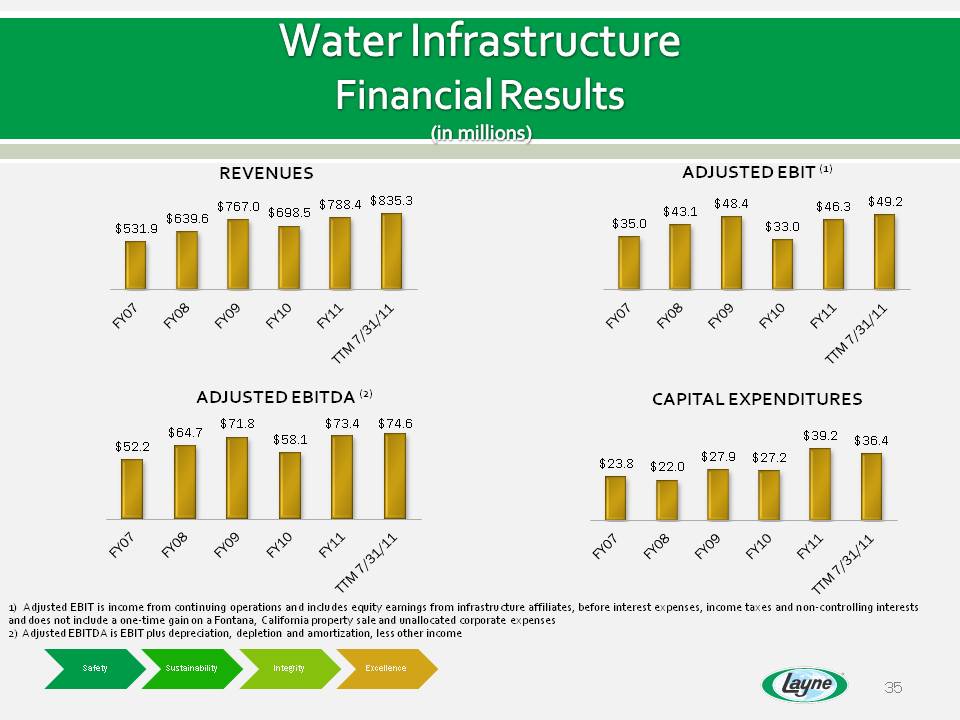
Water Infrastructure Financial Results (in millions) REVENUES ADJUSTED EBIT (1) $767 0 788 4 835.3 48 4 46 3 $531.9 $639.6 767.0 $698.5 $788.4 $ $35.0 $43.1 $48.4 $33.0 $46.3 $49.2 ADJUSTED EBITDA (2) CAPITAL EXPENDITURES $52.2 $64.7 $71.8 $58.1 $73.4 $74.6 $23.8 $22.0 $27.9 $27.2 $39.2 $36.4 1) Adjusted EBIT is income from continuing operations and includes equity earnings from infrastructure affiliates, before interest expenses, income taxes and non‐controlling interests Safety Sustainability Integrity Excellence and does not include a one‐time gain on a Fontana, California property sale and unallocated corporate expenses 2) Adjusted EBITDA is EBIT plus depreciation, depletion and amortization, less other income
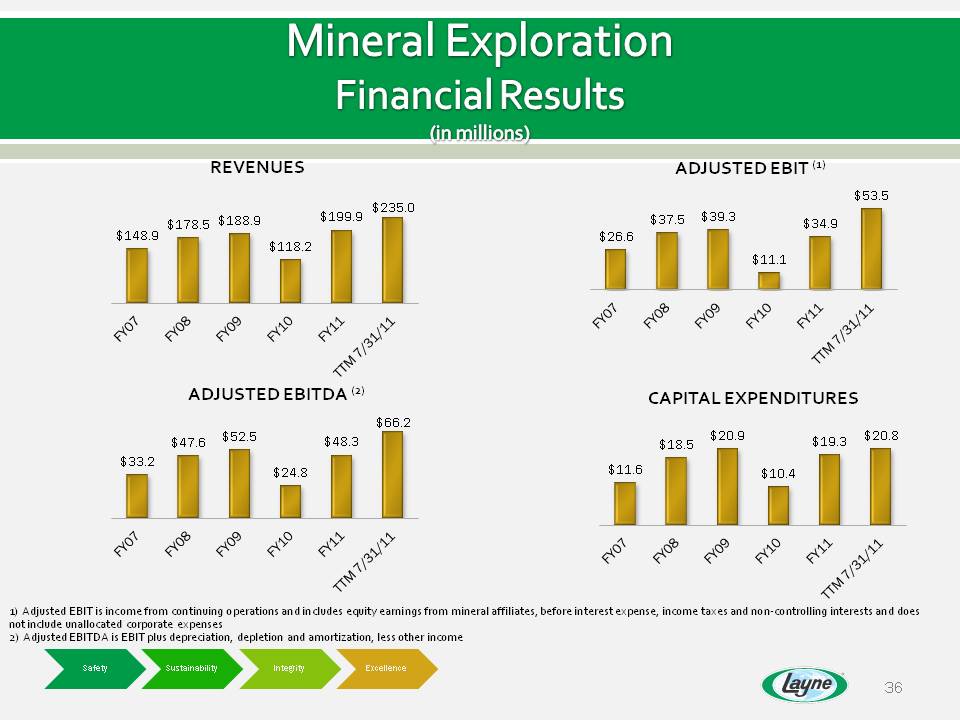
Mineral Exploration Financial Results (in millions) REVENUES ADJUSTED EBIT (1) $235 0 $53.5 $148.9 $178.5 $188.9 $118.2 $199.9 235.0 $26.6 $37.5 $39.3 $11.1 $34.9 ADJUSTED EBITDA (2) CAPITAL EXPENDITURES $11.6 $18.5 $20.9 $10.4 $19.3 $20.8 $33.2 $47.6 $52.5 $24.8 $48.3 $66.2 1) Adjusted EBIT is income fromcontinuing operations and includes equity earnings frommineral affiliates, before interest expense, income taxes and non‐controlling interests and does Safety Sustainability Integrity Excellence not include unallocated corporate expenses 2) Adjusted EBITDA is EBIT plus depreciation, depletion and amortization, less other income
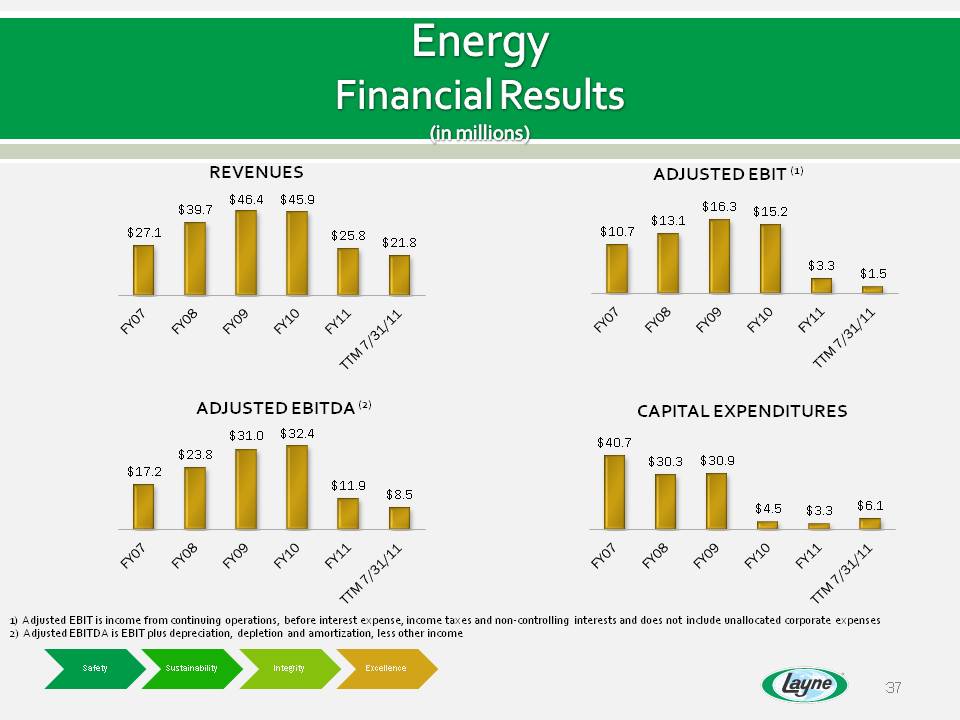
Energy Financial Results (in millions) REVENUES ADJUSTED EBIT (1) 39 $46.4 $45.9 16 3 $27.1 $39.7 $25.8 $21.8 $10.7 $13.1 $16.3 $15.2 $3.3 $1.5 (2) CAPITAL EXPENDITURES ADJUSTED EBITDA $17.2 $23.8 $31.0 $32.4 $11.9 $8.5 $40.7 $30.3 $30.9 $4.5 $3.3 $6.1 ) Safety Sustainability Integrity Excellence 1) Adjusted is income from continuing operations, before interest expense, income taxes and non‐controlling interests and does not include unallocated corporate expenses 2) Adjusted EBITDA is EBIT plus depreciation, depletion and amortization, less other income
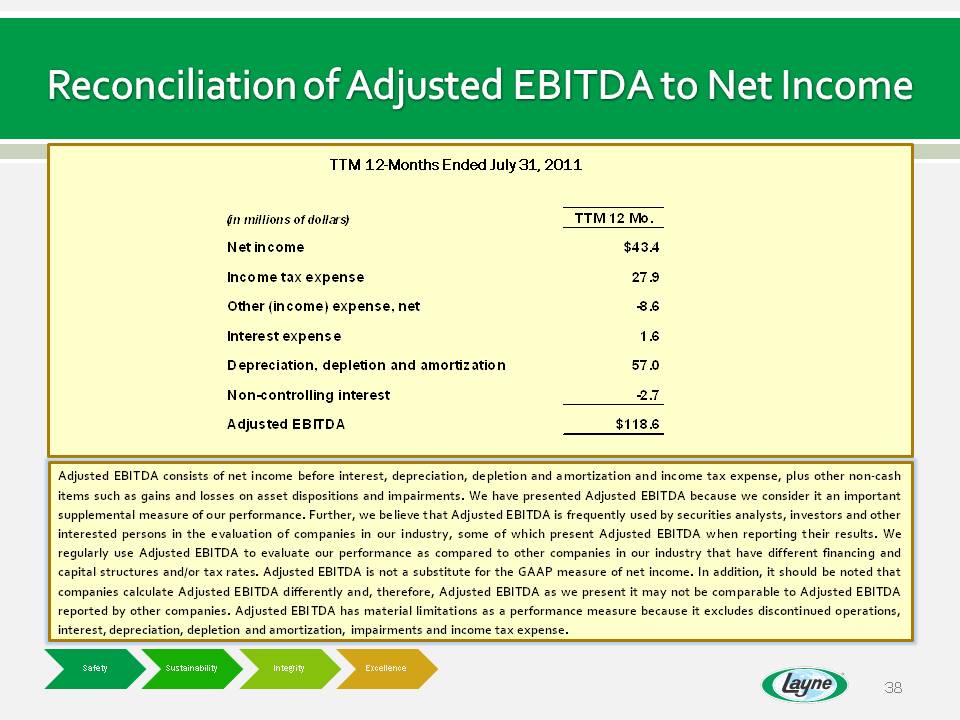
Reconciliation of Adjusted EBITDA to Net Income TTM 12-Months Ended July 31, 2011 (in millions of dollars) TTM 12 Mo. Net income $43.4 Income tax expense 27.9 (income) expense -8 6 Other expense, net 8.6 Interest expense 1.6 Depreciation, depletion and amortization 57.0 Non-controlling interest -2.7 Adjusted EBITDA $118.6 Adjusted EBITDA consists of net income before interest, depreciation, depletion and amortization and income tax expense, plus other non-cash items such as gains and losses on asset dispositions and impairments. We have presented Adjusted EBITDA because we consider it an important supplemental measure of our performance. Further, we believe that Adjusted EBITDA is frequently used by securities analysts, investors and other interested persons in the evaluation of companies in our industry, some of which present Adjusted EBITDA when reporting their results. We regularly use Adjusted EBITDA to evaluate our performance as compared to other companies in our industry that have different financing and capital structures and/or tax rates. Adjusted EBITDA is not a substitute for the GAAP measure of net income. In addition, it should be noted that companies calculate Adjusted EBITDA differently and, therefore, Adjusted EBITDA as we present it may not be comparable to Adjusted EBITDA reported by other companies. Adjusted EBITDA has material limitations as a performance measure because it excludes discontinued operations, interest, depreciation, depletion and amortization, impairments and income tax expense.