Attached files
Table of Contents
UNITED STATES
SECURITIES AND EXCHANGE COMMISSION
Washington, D.C. 20549
FORM 10-Q
| x | Quarterly report pursuant to Section 13 or 15(d) of the Securities Exchange Act of 1934 |
For the quarterly period ended September 30, 2011
| ¨ | Transition report pursuant to Section 13 or 15(d) of the Securities Exchange Act of 1934 |
For the transition period from to
Commission file number: 001-34537
iShares® Diversified Alternatives Trust
(Exact name of registrant as specified in its charter)
| Delaware | 26-4632352 | |
| (State or other jurisdiction of incorporation or organization) |
(I.R.S. Employer Identification No.) |
c/o BlackRock Asset Management International Inc.
400 Howard Street
San Francisco, California 94105
Attn: Product Management Team
iShares® Product Research & Development
(Address of principal executive offices)
(415) 670-2000
(Registrant’s telephone number, including area code)
N/A
(Former name, former address and former fiscal year, if changed since last report)
Indicate by check mark whether the registrant (1) has filed all reports required to be filed by Section 13 or 15(d) of the Securities Exchange Act of 1934 during the preceding 12 months (or for such shorter period that the registrant was required to file such reports), and (2) has been subject to such filing requirements for the past 90 days. Yes x No ¨
Indicate by check mark whether the registrant has submitted electronically and posted on its corporate Web site, if any, every Interactive Data File required to be submitted and posted pursuant to Rule 405 of Regulation S-T (§232.405 of this chapter) during the preceding 12 months (or for such shorter period that the registrant was required to submit and post such files). Yes x No ¨
Indicate by check mark whether the registrant is a large accelerated filer, an accelerated filer, a non-accelerated filer or a smaller reporting company. See the definitions of “large accelerated filer,” “accelerated filer” and “smaller reporting company” in Rule 12b-2 of the Exchange Act.
| Large accelerated filer | ¨ | Accelerated filer | ¨ | |||||
| Non-accelerated filer | ¨ | Smaller reporting company | x | |||||
| (Do not check if a smaller reporting company) | ||||||||
Indicate by check mark whether the registrant is a shell company (as defined in Rule 12b-2 of the Exchange Act). Yes ¨ No x
Table of Contents
Table of Contents
PART I – FINANCIAL INFORMATION
iShares® Diversified Alternatives Trust
Statements of Financial Condition
At September 30, 2011 (Unaudited) and December 31, 2010
| September 30, 2011 |
December 31, 2010 |
|||||||
| Assets |
||||||||
| Current Assets |
||||||||
| Cash and cash equivalents |
$ | 7,108,869 | $ | 3,309,973 | ||||
| Cash and cash equivalents held at brokers (restricted) |
6,032,492 | 2,695,461 | ||||||
| Foreign currencies held at brokers (restricted) (a) |
6,793,142 | 6,926,407 | ||||||
| Short-term investments |
108,286,922 | 100,261,940 | ||||||
| Interest receivable |
2,918 | 1,834 | ||||||
| Unrealized appreciation on forward currency contracts (Note 9) |
7,030,844 | 3,620,413 | ||||||
| Net unrealized appreciation (depreciation) on futures contracts (Note 9) |
2,152,595 | (2,043,296 | ) | |||||
|
|
|
|
|
|||||
| Total Assets |
$ | 137,407,782 | $ | 114,772,732 | ||||
|
|
|
|
|
|||||
| Liabilities and Shareholders’ Capital |
||||||||
| Current Liabilities |
||||||||
| Sponsor’s fees payable |
$ | 98,629 | $ | 89,735 | ||||
| Unrealized depreciation on forward currency contracts (Note 9) |
10,069,216 | 3,744,316 | ||||||
|
|
|
|
|
|||||
| Total Liabilities |
10,167,845 | 3,834,051 | ||||||
|
|
|
|
|
|||||
| Commitments and Contingent Liabilities (Note 7) |
— | — | ||||||
| Shareholders’ Capital |
||||||||
| Redeemable capital Shares, no par value, unlimited amount authorized (at redemption value) – 2,600,000 issued and outstanding at September 30, 2011 and 2,200,000 issued and outstanding at December 31, 2010 |
127,229,537 | 110,931,481 | ||||||
| Additional paid-in capital |
10,400 | 7,200 | ||||||
|
|
|
|
|
|||||
| Total Shareholders’ Capital |
127,239,937 | 110,938,681 | ||||||
|
|
|
|
|
|||||
| Total Liabilities and Shareholders’ Capital |
$ | 137,407,782 | $ | 114,772,732 | ||||
|
|
|
|
|
|||||
| (a) | Cost of foreign currencies at September 30, 2011 and December 31, 2010: $6,854,050 and $6,830,250, respectively. |
See notes to financial statements.
1
Table of Contents
iShares® Diversified Alternatives Trust
Statements of Operations (Unaudited)
For the three and nine months ended September 30, 2011 and 2010
| Three Months Ended September 30, |
Nine Months Ended September 30, |
|||||||||||||||
| 2011 | 2010 | 2011 | 2010 | |||||||||||||
| Investment Income |
||||||||||||||||
| Interest |
$ | 21,296 | $ | 33,950 | $ | 107,511 | $ | 64,145 | ||||||||
|
|
|
|
|
|
|
|
|
|||||||||
| Total investment income |
21,296 | 33,950 | 107,511 | 64,145 | ||||||||||||
|
|
|
|
|
|
|
|
|
|||||||||
| Expenses |
||||||||||||||||
| Sponsor’s fees |
308,239 | 194,578 | 878,411 | 381,389 | ||||||||||||
| Brokerage commissions and fees |
25,338 | 13,456 | 60,795 | 27,606 | ||||||||||||
|
|
|
|
|
|
|
|
|
|||||||||
| Total expenses |
333,577 | 208,034 | 939,206 | 408,995 | ||||||||||||
|
|
|
|
|
|
|
|
|
|||||||||
| Net investment loss |
(312,281 | ) | (174,084 | ) | (831,695 | ) | (344,850 | ) | ||||||||
|
|
|
|
|
|
|
|
|
|||||||||
| Realized and Unrealized Gain (Loss) |
||||||||||||||||
| Net realized gain (loss) on: |
||||||||||||||||
| Short-term investments |
8,766 | 199 | 11,528 | 199 | ||||||||||||
| Forward currency contracts |
(1,282,950 | ) | (154,349 | ) | 18,063 | 40,492 | ||||||||||
| Futures contracts |
(4,083,480 | ) | (51,792 | ) | (4,516,838 | ) | 360,802 | |||||||||
| Net change in unrealized appreciation/depreciation on: |
||||||||||||||||
| Foreign currency translations |
(147,110 | ) | 197,606 | (157,065 | ) | 179,249 | ||||||||||
| Forward currency contracts |
(2,143,611 | ) | 718,618 | (2,914,469 | ) | 269,598 | ||||||||||
| Futures contracts |
806,983 | 790,708 | 4,195,891 | 801,900 | ||||||||||||
|
|
|
|
|
|
|
|
|
|||||||||
| Net realized and unrealized gain (loss) |
(6,841,402 | ) | 1,500,990 | (3,362,890 | ) | 1,652,240 | ||||||||||
|
|
|
|
|
|
|
|
|
|||||||||
| Net gain (loss) |
$ | (7,153,683 | ) | $ | 1,326,906 | $ | (4,194,585 | ) | $ | 1,307,390 | ||||||
|
|
|
|
|
|
|
|
|
|||||||||
| Net gain (loss) per Share |
$ | (2.77 | ) | $ | 0.81 | $ | (1.72 | ) | $ | 1.19 | ||||||
| Weighted-average Shares outstanding |
2,578,348 | 1,644,565 | 2,435,897 | 1,094,872 | ||||||||||||
See notes to financial statements.
2
Table of Contents
iShares® Diversified Alternatives Trust
Statements of Changes in Shareholders’ Capital
For the nine months ended September 30, 2011 (Unaudited)
and the year ended December 31, 2010
| Nine Months Ended September 30, 2011 |
Year Ended December 31, 2010 |
|||||||
| Shareholders’ Capital, Beginning of Period |
$ | 110,938,681 | $ | 14,855,197 | ||||
| Contributions |
35,684,786 | 94,893,939 | ||||||
| Redemptions |
(15,188,945 | ) | — | |||||
| Net investment loss |
(831,695 | ) | (564,823 | ) | ||||
| Net realized gain (loss) on: |
||||||||
| Short-term investments |
11,528 | 199 | ||||||
| Forward currency contracts |
18,063 | 699,926 | ||||||
| Futures contracts |
(4,516,838 | ) | 3,045,389 | |||||
| Net change in unrealized appreciation/depreciation on: |
||||||||
| Foreign currency translations |
(157,065 | ) | 102,402 | |||||
| Forward currency contracts |
(2,914,469 | ) | (175,836 | ) | ||||
| Futures contracts |
4,195,891 | (1,917,712 | ) | |||||
|
|
|
|
|
|||||
| Shareholders’ Capital, End of Period |
$ | 127,239,937 | $ | 110,938,681 | ||||
|
|
|
|
|
|||||
| Net Asset Value per Share, End of Period |
$ | 48.94 | $ | 50.43 | ||||
See notes to financial statements.
3
Table of Contents
iShares® Diversified Alternatives Trust
Statements of Cash Flows (Unaudited)
For the nine months ended September 30, 2011 and 2010
| Nine Months Ended September 30, |
||||||||
| 2011 | 2010 | |||||||
| Cash Flows from Operating Activities |
||||||||
| Net gain (loss) |
$ | (4,194,585 | ) | $ | 1,307,390 | |||
| Adjustments to reconcile net gain (loss) to net cash used in operating activities: |
||||||||
| Purchases of short-term investments |
(333,600,170 | ) | (124,066,500 | ) | ||||
| Sales/maturities of short-term investments |
325,678,403 | 50,356,444 | ||||||
| Accretion of discount |
(91,687 | ) | (61,534 | ) | ||||
| Net realized gain on short-term investments |
(11,528 | ) | (199 | ) | ||||
| Change in operating assets and liabilities: |
||||||||
| Cash and cash equivalents held at brokers (restricted) |
(3,337,031 | ) | (902,732 | ) | ||||
| Foreign currencies held at brokers, at cost (restricted) |
(23,800 | ) | (3,319,021 | ) | ||||
| Interest receivable |
(1,084 | ) | 421 | |||||
| Net unrealized appreciation (depreciation) on futures contracts |
(4,234,595 | ) | (776,569 | ) | ||||
| Sponsor’s fees payable |
8,894 | 60,798 | ||||||
|
|
|
|
|
|||||
| Net cash used in operating activities |
(19,807,183 | ) | (77,401,502 | ) | ||||
|
|
|
|
|
|||||
| Cash Flows from Financing Activities |
||||||||
| Contributions |
35,684,786 | 79,665,478 | ||||||
| Redemptions |
(15,188,945 | ) | — | |||||
|
|
|
|
|
|||||
| Net cash provided by financing activities |
20,495,841 | 79,665,478 | ||||||
|
|
|
|
|
|||||
| Effect of exchange rate changes on cash |
3,110,238 | (474,273 | ) | |||||
|
|
|
|
|
|||||
| Net increase in cash and cash equivalents |
3,798,896 | 1,789,703 | ||||||
|
|
|
|
|
|||||
| Cash and Cash Equivalents |
||||||||
| Beginning of period |
3,309,973 | 166,599 | ||||||
|
|
|
|
|
|||||
| End of period |
$ | 7,108,869 | $ | 1,956,302 | ||||
|
|
|
|
|
|||||
See notes to financial statements.
4
Table of Contents
iShares® Diversified Alternatives Trust
Schedule of Investments (Unaudited)
At September 30, 2011
| Face Amount |
Security Description |
Fair Value | ||||||
| United States Treasury Bills: | ||||||||
| 9,000,000 | 0.03% due 10/13/11 | $ | 8,999,903 | |||||
| 1,000,000 | 0.08% due 10/27/11 | 999,943 | ||||||
| 9,700,000 | 0.07% due 11/10/11 | 9,699,252 | ||||||
| 8,500,000 | 0.09% due 11/17/11 | 8,498,981 | ||||||
| 3,500,000 | 0.04% due 12/15/11 | 3,499,710 | ||||||
| 29,800,000 | 0.01% - 0.07% due 1/12/12 | 29,793,969 | ||||||
| 9,500,000 | 0.03% due 2/23/12 | 9,498,852 | ||||||
| 7,100,000 | 0.00% (a) due 3/08/12 | 7,099,373 | ||||||
| 14,200,000 | 0.01% due 3/12/12 | 14,197,308 | ||||||
| 16,000,000 | 0.01% due 3/15/12 | 15,999,631 | ||||||
|
|
|
|||||||
| Total United States Treasury Bills - 85.10% (b) |
$ | 108,286,922 | ||||||
|
|
|
|||||||
| (a) | Rounds to less than 0.01%. |
| (b) | Percentage is based on shareholders’ capital. |
| • | As of September 30, 2011, open forward currency contracts held by the Trust were as follows: |
| Settlement Date |
Currency to be |
Amount to be Delivered |
Currency to be |
Amount to be Received |
Unrealized Appreciation (Depreciation) |
|||||||||||
| 10/5/2011 |
AUD | 9,383,307 | USD | 9,816,434 | $696,793 | |||||||||||
| 10/5/2011 |
CAD | 25,754,759 | USD | 26,572,163 | 1,857,899 | |||||||||||
| 10/5/2011 |
CHF | 18,088,848 | USD | 21,916,769 | 2,001,336 | |||||||||||
| 10/5/2011 |
EUR | 11,793,893 | USD | 16,923,759 | 1,100,012 | |||||||||||
| 10/5/2011 |
GBP | 4,129,218 | USD | 6,603,076 | 170,646 | |||||||||||
| 10/5/2011 |
JPY | 270,401,885 | USD | 3,525,948 | 17,831 | |||||||||||
| 10/5/2011 |
NOK | 24,775,984 | USD | 4,562,823 | 342,967 | |||||||||||
| 10/5/2011 |
SEK | 74,426,121 | USD | 11,679,134 | 843,360 | |||||||||||
|
|
|
|||||||||||||||
| 7,030,844 | ||||||||||||||||
|
|
|
|||||||||||||||
| 10/5/2011 |
USD | 21,493,975 | AUD | 20,337,302 | (1,728,143) | |||||||||||
| 10/5/2011 |
USD | 10,143,153 | CAD | 9,900,768 | (642,377) | |||||||||||
| 10/5/2011 |
USD | 15,297,309 | CHF | 11,908,698 | (2,186,088) | |||||||||||
| 10/5/2011 |
USD | 15,511,324 | EUR | 10,832,959 | (976,853) | |||||||||||
| 10/5/2011 |
USD | 17,130,428 | GBP | 10,660,893 | (523,056) | |||||||||||
| 10/5/2011 |
USD | 131,068 | JPY | 10,014,885 | (1,138) | |||||||||||
| 10/5/2011 |
USD | 17,951,040 | NOK | 97,497,574 | (1,345,214) | |||||||||||
| 10/5/2011 |
USD | 36,237,488 | SEK | 230,585,275 | (2,666,347) | |||||||||||
|
|
|
|||||||||||||||
| (10,069,216) | ||||||||||||||||
|
|
|
|||||||||||||||
| Net Unrealized Depreciation |
$(3,038,372) | |||||||||||||||
|
|
|
|||||||||||||||
5
Table of Contents
| • | As of September 30, 2011, open futures contracts held by the Trust were as follows: |
| Contract Type |
Number of Contracts |
Expiration Date |
Notional Amount |
Unrealized Appreciation (Depreciation) |
||||||||||||
| Equity Contracts |
||||||||||||||||
| AEX Index |
3 | 10/21/2011 | $ | 225,849 | $ | 6,386 | ||||||||||
| CAC 40 10-Year Euro |
141 | 10/21/2011 | 5,642,285 | 171,463 | ||||||||||||
| OMX 30 Index |
(409 | ) | 10/21/2011 | (5,413,078 | ) | (174,063 | ) | |||||||||
| Hang Seng Index |
(90 | ) | 10/28/2011 | (10,069,688 | ) | 363,229 | ||||||||||
| MSCI Taiwan Index |
268 | 10/28/2011 | 6,860,800 | 42,100 | ||||||||||||
| TOPIX Index |
12 | 12/9/2011 | 1,179,294 | 34,471 | ||||||||||||
| S&P/TSE 60 Index |
(78 | ) | 12/15/2011 | (9,950,885 | ) | 370,393 | ||||||||||
| SPI 200 Index |
5 | 12/15/2011 | 485,950 | (10,472 | ) | |||||||||||
| DAX Index |
68 | 12/16/2011 | 12,478,751 | 691,361 | ||||||||||||
| FTSE 100 Index |
(56 | ) | 12/16/2011 | (4,440,789 | ) | 50,831 | ||||||||||
| S&P 500 E-mini Index |
70 | 12/16/2011 | 3,941,000 | (107,845 | ) | |||||||||||
|
|
|
|||||||||||||||
| 1,437,854 | ||||||||||||||||
|
|
|
|||||||||||||||
| Interest Rate Contracts |
||||||||||||||||
| 10-Year Mini JGB |
(19 | ) | 12/8/2011 | (3,506,175 | ) | 11,715 | ||||||||||
| Euro Bund |
10 | 12/8/2011 | 1,831,287 | (5,179 | ) | |||||||||||
| Japan 10-Year Bond |
(7 | ) | 12/9/2011 | (12,916,580 | ) | 47,224 | ||||||||||
| Australian 10-Year Bond |
(234 | ) | 12/15/2011 | (25,987,331 | ) | 157,528 | ||||||||||
| Canada 10-Year Bond |
(39 | ) | 12/19/2011 | (4,974,320 | ) | (70,563 | ) | |||||||||
| US 10-Year Note |
217 | 12/20/2011 | 28,230,344 | 170,219 | ||||||||||||
| Long Gilt |
97 | 12/28/2011 | 19,642,345 | 403,797 | ||||||||||||
|
|
|
|||||||||||||||
| 714,741 | ||||||||||||||||
|
|
|
|||||||||||||||
| Net Unrealized Appreciation |
$ | 2,152,595 | ||||||||||||||
|
|
|
|||||||||||||||
See notes to financial statements.
6
Table of Contents
iShares® Diversified Alternatives Trust
Notes to Financial Statements (Unaudited)
September 30, 2011
1 - Organization
The iShares® Diversified Alternatives Trust, (the “Trust”) is a Delaware statutory trust organized under the laws of the State of Delaware on July 30, 2009 and commenced operations on October 6, 2009. iShares® Delaware Trust Sponsor LLC is the sponsor of the Trust (the “Sponsor”). The sole member and manager of the Sponsor is BlackRock Asset Management International Inc., a Delaware corporation. BlackRock Institutional Trust Company, N.A. is the “Trustee” of the Trust. The Trust holds long and/or short positions in foreign currency forward contracts and exchange-traded futures contracts involving assets such as currencies, interest rates and certain eligible stock and/or bond indices. Investments for the Trust’s portfolio are selected by BlackRock Fund Advisors (the “Advisor”), following investment strategies that utilize quantitative methodologies to identify potentially profitable discrepancies in the relative values or market prices of one or more assets.
The Trust is a commodity pool, as defined in the Commodity Exchange Act (the “CEA”) and the applicable regulations of the Commodity Futures Trading Commission (the “CFTC”), and is operated by the Sponsor, a commodity pool operator registered with the CFTC. The Sponsor is an indirect subsidiary of BlackRock, Inc. The Advisor, an indirect subsidiary of BlackRock, Inc., serves as the commodity trading advisor of the Trust and is registered under the CEA.
The Trust is not an investment company registered under the Investment Company Act of 1940, as amended.
The accompanying unaudited financial statements were prepared in accordance with accounting principles generally accepted in the United States of America (“U.S. GAAP”) for interim financial information and with the instructions for Form 10-Q and the rules and regulations of the U.S. Securities and Exchange Commission (the “SEC”). In the opinion of management, all material adjustments, consisting only of normal recurring adjustments, considered necessary for a fair statement of the interim period financial statements have been made. Interim period results are not necessarily indicative of results for a full-year period. These financial statements and the notes thereto should be read in conjunction with the Trust’s financial statements included in its Annual Report on Form 10-K for the year ended December 31, 2010 as filed with the SEC on March 24, 2011.
2 - Summary of Significant Accounting Policies
| A. | Basis of Accounting |
The following is a summary of significant accounting policies consistently followed by the Trust in the preparation of its financial statements in conformity with U.S. GAAP. The preparation of financial statements in conformity with U.S. GAAP requires management to make certain estimates and assumptions that affect the reported amounts of assets and liabilities and disclosures of contingent assets and liabilities at the date of the financial statements and the reported amounts of revenue and expenses during the reporting period. Actual results could differ from those estimates and these differences could be material.
Certain amounts in the financial statements for the prior year have been reclassified to conform to the current financial statement presentation.
| B. | Investment in Forward and Futures Contracts |
A forward contract is an agreement between two parties, one of whom undertakes to purchase from or sell to the other, on a specified future date, a specified quantity of a specified asset at a specified location in exchange for a specified purchase price. The types of assets involved may vary from foreign currencies to physical commodities and financial assets such as bonds or interest rates. Unlike futures contracts, forward contracts are usually the subject of negotiation between the parties involved. As a result, forward contracts may have a variety of maturities and involve different amounts of the specified asset.
Futures contracts are standardized forward contracts traded on an exchange. As such, futures contracts and the parties to a futures contract are subject to the regulations of the exchange where the contracts trade. Each exchange may impose certain margin requirements, setting forth the minimum amount of funds that must be deposited by a futures trader with the futures commission merchant in order to initiate futures trading or to maintain an open position in futures contracts.
7
Table of Contents
Forward and futures contracts are derivative instruments and are valued at fair value. The Trust’s derivatives are not designated as hedges, and all changes in the fair value are reflected in the Statements of Operations. The current market value of all open futures contracts, whether traded on a United States exchange or a non-United States exchange, is determined by State Street Bank and Trust Company (the “Trust Administrator”). Such current market value is based upon the settlement price for that particular futures contract traded on the applicable exchange on the date with respect to which net asset value is being determined; provided that if a futures contract could not be liquidated on such day, due to the operation of daily limits (if applicable) or other rules, procedures or actions of the exchange upon which that position is traded or otherwise, the settlement price on the most recent day on which the position could have been liquidated is the primary basis for determining the market value of such position for such day.
The current market value of all open forward contracts is based upon the prices determined by the Trust Administrator utilizing data from an internationally recognized valuation service for assets of that nature. The Trustee periodically assesses the appropriateness of the methodologies used by the valuation service provider in determining the price of forward contracts.
The Trustee may in its discretion (and, under extraordinary circumstances, will) value any asset of the Trust pursuant to other principles that it deems fair and equitable. In this context, “extraordinary circumstances” includes, for example, periods during which a valuation price for a forward contract or a settlement price of a futures contract is not available due to events such as systems failure, natural or man-made disaster, act of God, armed conflict, act of terrorism, riot or labor disruption or any similar intervening circumstance or due to a trading or other restriction imposed by a relevant futures exchange.
The investment objective of the Trust is to maximize absolute returns from its investments in certain futures and/or forward contracts selected by the Advisor following strategies that utilize quantitative methodologies to identify potentially profitable discrepancies in the relative values or market prices of one or more commodities, currencies, interest rates or certain eligible stock or bond indices, and seek to reduce the risks and volatility inherent in these investments by taking long and short positions in historically correlated assets. In pursuing its investment objectives, the Trust is subject to equity price risk, interest rate risk and foreign currency exchange rate risk. The return on assets in the Trust, if any, is not intended to track the performance of any index or other benchmark.
For futures contracts, counterparty credit risk is minimized because futures contracts are exchange-traded and the exchange’s clearing house acts as a central counterparty to all exchange-traded futures contracts (although customers continue to have credit exposure to the clearing member who holds their account). Forward contracts are not exchange-traded, and are therefore subject to counterparty credit risk of The Royal Bank of Scotland plc, the prime broker of the Trust.
Please refer to Note 9 for additional disclosures regarding the Trust’s investments in forward and futures contracts.
| C. | Cash and Cash Equivalents |
The Trust defines cash and cash equivalents to be highly liquid investments with original maturities of three months or less.
As of September 30, 2011 and December 31, 2010, the Trust had cash and cash equivalents held at brokers of $6,032,492 and $2,695,461 respectively, which were restricted and held as collateral against margin obligations for open forward and/or futures contracts.
| D. | Foreign Currencies |
The Trust may hold foreign currencies as collateral for futures contracts traded on exchanges located outside the United States. Foreign currencies are translated into U.S. dollars at the prevailing spot exchange rate. Net realized gain or loss on foreign currencies, if any, arises from the sale of such foreign currencies and is presented on the Statements of Operations. Net change in unrealized gain or loss on foreign currency translation on the Statements of Operations arises from changes in foreign currency values resulting from changes in exchange rates during the period.
The Trust does not isolate the effect of fluctuations in foreign exchange rates from the effect of fluctuations in the market prices of securities. Such fluctuations are reflected by the Trust as a component of realized and unrealized gains and losses from investments for financial reporting purposes.
As of September 30, 2011 and December 31, 2010, the Trust had foreign currencies held at brokers of $6,793,142 and $6,926,407, respectively, which were restricted and held as collateral against margin obligations for open futures contracts.
8
Table of Contents
| E. | Short-Term Investments |
Short-term investments on the Statements of Financial Condition consist principally of short-term fixed income securities with original maturities of one year or less. These investments are valued at fair value.
| F. | Securities Transactions, Income and Expense Recognition |
Securities transactions are accounted for on the trade date. Realized gains and losses on investment transactions are determined using the specific identification method. Other income and expenses are recognized on the accrual basis.
| G. | Income Taxes |
The Trust is not an association taxable as a corporation and is treated as a partnership for federal, state and local income tax purposes.
No provision for federal, state, and local income taxes has been made in the accompanying financial statements because the Trust is not subject to income taxes. Shareholders are individually responsible for their own tax payments on their proportionate share of income, gain, loss, deduction, expense and credit.
| H. | Calculation of Net Asset Value |
On each business day on which NYSE Arca, Inc. (“NYSE Arca”) is open for regular trading, as soon as practicable after the close of regular trading of the Shares on NYSE Arca (normally 4:15 p.m., New York time), the Trustee determines the net asset value of the Trust. Net asset value of the Trust means the total assets of the Trust including all cash and cash equivalents or other debt securities less total liabilities of the Trust, each determined on the basis of U.S. GAAP, consistently applied under the accrual method of accounting. In particular, net asset value of the Trust includes any unrealized profit or loss on open forward contracts and futures contracts, and any other credit or debit accruing to the Trust but unpaid or not received by the Trust.
| I. | Recent Accounting Standard |
In May 2011, the Financial Accounting Standards Board issued amended guidance to improve disclosure about fair value measurements which will require the following disclosures for fair value measurements categorized as Level 3: quantitative information about the unobservable inputs and assumptions used in the fair value measurement, a description of the valuation policies and procedures and a narrative description of the sensitivity of the fair measurement to changes in unobservable inputs and the interrelationships between those unobservable inputs. In addition, the amounts and reasons for all transfers in and out of Level 1 and Level 2 will be required to be disclosed. The amended guidance is effective for financial statements for the fiscal year beginning after December 15, 2011, and interim periods within those fiscal years. Management is evaluating the impact of this guidance on the Trust’s financial statements and disclosures.
3 - Offering of the Shares
The Trust offers Shares on a continuous basis. The Trust issues and redeems Shares only in one or more blocks of 100,000 Shares (“Baskets”) for consideration in cash equal to the net asset value per Basket announced by the Trust on the first business day after the purchase or redemption order is received by the Trust. These transactions take place only with certain broker-dealers with whom the Trust has entered into written arrangements regarding the issuance and redemption of Shares (such authorized broker-dealers are the “Authorized Participants”). Only institutions that enter into an agreement with the Trust to become Authorized Participants may purchase or redeem Baskets. The Trust will not redeem individual Shares or Baskets held by parties who are not Authorized Participants.
Redemptions of Shares in exchange for a consideration in cash are treated as sales for financial statement purposes.
4 - Trust Expenses
The Trust incurs all brokerage commissions and other transaction related fees and expenses in connection with the trading activities of the Trust. These expenses are recorded as brokerage commissions and fees in the Statements of Operations as incurred.
9
Table of Contents
The Sponsor pays the amounts that would otherwise be considered the ordinary operating expenses, if any, of the Trust. In return, the Sponsor receives an allocation from the Trust that accrues daily at an annualized rate equal to 0.95% of the adjusted net asset value of the Trust.
The Sponsor is obligated under the trust agreement to pay the following administrative, operational and marketing expenses: (1) the fees of the Trustee, the Advisor, Wilmington Trust Company (the “Delaware Trustee”), the Trust Administrator and SEI Investments Distribution Co., (2) NYSE Arca listing fees, (3) printing and mailing costs, (4) audit fees, (5) fees for registration of the Shares with the SEC, (6) tax reporting costs and (7) legal expenses up to $100,000 annually.
5 - Related Parties
iShares® Delaware Trust Sponsor LLC, is the Sponsor of the Trust, and BlackRock Fund Advisors is the Advisor of the Trust. The Sponsor and the Advisor are considered to be related parties to the Trust.
6 - Indemnification
The trust agreement provides that the Sponsor and its shareholders, directors, officers, employees, affiliates (as such term is defined under the United States Securities Act of 1933, as amended) and subsidiaries shall be indemnified from the Trust and held harmless against any loss, liability, cost, expense or judgment arising out of or in connection with the performance of their obligations under the trust agreement or any actions taken in accordance with the provisions of the trust agreement incurred without their (1) negligence, bad faith, willful misconduct or willful malfeasance or (2) reckless disregard of their obligations and duties under the trust agreement.
7 - Commitments and Contingent Liabilities
In the normal course of business, the Trust may enter into contracts with service providers that contain general indemnification clauses. The Trust’s maximum exposure under these arrangements is unknown as this would involve future claims that may be made against the Trust that have not yet occurred.
8 - Financial Highlights
The Trust is presenting the following financial highlights related to investment performance and operations for the period from January 1, 2011 through September 30, 2011. The net investment income (loss) and total expense ratios are calculated using average net assets. The net asset value presentation is calculated using daily Shares outstanding. The net investment income (loss) and expense ratios have been annualized. The total return is based on the change in the net asset value of a Share during the period.
| Net asset value per Share, beginning of period |
$ | 50.43 | ||
| Net investment loss |
(0.34 | ) | ||
| Net realized and unrealized loss |
(1.15 | ) | ||
|
|
|
|||
| Net decrease in net assets from operations |
(1.49 | ) | ||
|
|
|
|||
| Net asset value per Share, end of period |
$ | 48.94 | ||
|
|
|
|||
| Ratio to average net assets: |
||||
| Net investment loss (a) |
(0.90 | )% | ||
| Expenses (a) |
1.02 | % | ||
| Total return (b) |
(2.95 | )% | ||
| (a) | Percentage is annualized. |
| (b) | Percentage is not annualized. |
10
Table of Contents
9 - Investing in Forward and Futures Contracts
Substantially all of the Trust’s assets are invested in forward and/or futures contracts. The return on assets in the portfolio, if any, is not intended to track the performance of any index or other benchmark. There is no assurance the Trust will achieve its investment objectives.
For the nine months ended September 30, 2011 and the year ended December 31, 2010, the average month-end notional amounts of open forward currency contracts were $238,295,581 and $133,811,286, respectively. For the nine months ended September 30, 2011 and the year ended December 31, 2010, the average month-end notional amounts of open futures contracts were $736,063,768 and $405,818,327, respectively.
The following table shows the fair values of the open forward currency and futures contracts, by risk exposure category, on the Statements of Financial Condition as of September 30, 2011 and December 31, 2010:
| September 30, 2011 |
Asset Derivatives |
Fair Value | Liability Derivatives |
Fair Value | ||||||||
| Foreign exchange contracts |
Unrealized appreciation on forward currency contracts | $ | 7,030,844 | Unrealized depreciation on forward currency contracts | $ | 10,069,216 | ||||||
| Equity contracts |
Unrealized appreciation on futures contracts | 1,730,234 | Unrealized depreciation on futures contracts | 292,380 | ||||||||
| Interest rate contracts |
Unrealized appreciation on futures contracts | 790,483 | Unrealized depreciation on futures contracts | 75,742 | ||||||||
| December 31, 2010 |
||||||||||||
| Foreign exchange contracts |
Unrealized appreciation on forward currency contracts | $ | 3,620,413 | Unrealized depreciation on forward currency contracts | $ | 3,744,316 | ||||||
| Equity contracts |
Unrealized appreciation on futures contracts | 227,254 | Unrealized depreciation on futures contracts | 555,551 | ||||||||
| Interest rate contracts |
Unrealized appreciation on futures contracts | 85,806 | Unrealized depreciation on futures contracts | 1,800,805 | ||||||||
11
Table of Contents
The following table shows the effect of the forward currency and futures contracts, by risk exposure category, on the Statements of Operations for the nine months ended September 30, 2011 and 2010:
| Statements of |
Realized Gain (Loss) |
Change in Unrealized Appreciation/ Depreciation |
||||||||
| Nine Months Ended September 30, 2011 |
||||||||||
| Foreign exchange contracts |
Net realized gain on forward currency contracts | $ | 18,063 | $ | — | |||||
| Net change in unrealized appreciation/depreciation on forward currency contracts | — | (2,914,469 | ) | |||||||
| Equity contracts |
Net realized loss on futures contracts | (1,551,069 | ) (a) | — | ||||||
| Net change in unrealized appreciation/depreciation on futures contracts | — | 1,766,151 | ||||||||
| Interest rate contracts |
Net realized loss on futures contracts | (3,026,564 | ) (a) | — | ||||||
| Net change in unrealized appreciation/depreciation on futures contracts | — | 2,429,740 | ||||||||
| Nine Months Ended September 30, 2010 |
||||||||||
| Foreign exchange contracts |
Net realized gain on forward currency contracts | $ | 40,492 | $ | — | |||||
| Net change in unrealized appreciation/depreciation on forward currency contracts | — | 269,598 | ||||||||
| Equity contracts |
Net realized loss on futures contracts | (612,760 | ) (a) | — | ||||||
| Net change in unrealized appreciation/depreciation on futures contracts | — | 4,957 | (a) | |||||||
| Interest rate contracts |
Net realized gain on futures contracts | 945,861 | (a) | — | ||||||
| Net change in unrealized appreciation/depreciation on futures contracts | — | 797,038 | (a) | |||||||
| (a) | Amounts do not reconcile to the Statements of Operations due to brokerage commissions and fees. |
12
Table of Contents
10 - Investment Valuation
In accordance with Financial Accounting Standards Board Accounting Standards Codification Topic 820, Fair Value Measurements and Disclosures, the Trust values investments using a fair value hierarchy that prioritizes the inputs to valuation techniques used to measure fair value. Inputs may be based on independent market data (“observable inputs”) or they may be internally developed (“unobservable inputs”). The hierarchy gives the highest priority to unadjusted quoted prices in active markets for identical assets or liabilities (Level 1 measurements) and the lowest priority to unobservable inputs (Level 3 measurements). The three levels of the fair value hierarchy are as follows:
| Level 1 | – | Inputs that reflect unadjusted quoted prices in active markets for identical assets or liabilities that the Trust has the ability to access as of the measurement date; | ||
| Level 2 | – | Inputs other than quoted prices included within Level 1 that are observable for the asset or liability either directly or indirectly, including inputs in markets that are not considered to be active; and | ||
| Level 3 | – | Inputs that are unobservable for the asset or liability. | ||
U.S. Treasury bills are classified as Level 2 investments, as these trade in markets that are not considered active, but whose values are based on inputs such as quoted market prices, dealer quotations or valuations provided by alternative pricing sources that are supported by observable inputs.
Forward currency contracts are not exchange-traded and do not have quoted prices for identical assets in active markets. These contracts are valued using pricing information obtained from third-party pricing vendors who derive the value of these contracts from observable market inputs such as expiration dates of forward contracts, forward rates and spot exchange rates. Therefore, forward currency contracts are classified as Level 2 investments.
Futures contracts are valued using settlement prices for the particular futures contract traded on the applicable exchanges. Futures contracts are classified as Level 1 investments, as quoted prices for identical assets in active markets are available.
The following table summarizes the valuation of the Trust’s investments by the fair value hierarchy levels as of September 30, 2011 and December 31, 2010:
| September 30, 2011 |
Level 1 | Level 2 | Level 3 | Total | ||||||||||||
| U.S. Treasury bills |
$ | — | $ | 108,286,922 | $ | — | $ | 108,286,922 | ||||||||
| Forward currency contracts |
— | (3,038,372 | ) | — | (3,038,372 | ) | ||||||||||
| Futures contracts |
||||||||||||||||
| Equity contracts |
1,437,854 | — | — | 1,437,854 | ||||||||||||
| Interest rate contracts |
714,741 | — | — | 714,741 | ||||||||||||
|
|
|
|
|
|
|
|
|
|||||||||
| Total futures contracts |
2,152,595 | — | — | 2,152,595 | ||||||||||||
|
|
|
|
|
|
|
|
|
|||||||||
| December 31, 2010 |
||||||||||||||||
| U.S. Treasury bills |
$ | — | $ | 100,261,940 | $ | — | $ | 100,261,940 | ||||||||
| Forward currency contracts |
— | (123,903 | ) | — | (123,903 | ) | ||||||||||
| Futures contracts |
||||||||||||||||
| Equity contracts |
(328,297 | ) | — | — | (328,297 | ) | ||||||||||
| Interest rate contracts |
(1,714,999 | ) | — | — | (1,714,999 | ) | ||||||||||
|
|
|
|
|
|
|
|
|
|||||||||
| Total futures contracts |
(2,043,296 | ) | — | — | (2,043,296 | ) | ||||||||||
|
|
|
|
|
|
|
|
|
|||||||||
11 - Subsequent Events
In connection with the preparation of the financial statements of the Trust as of and for the period ended September 30, 2011, management has evaluated the impact of all subsequent events on the Trust through the date the financial statements were issued and has determined that there were no subsequent events requiring adjustment or disclosure in the financial statements.
13
Table of Contents
Item 2. Management’s Discussion and Analysis of Financial Condition and Results of Operations
This information should be read in conjunction with the financial statements and notes to financial statements included in Item 1 of Part I of this Form 10-Q. The discussion and analysis that follows may contain statements that relate to future events or future performance. In some cases, such forward-looking statements can be identified by terminology such as “may,” “should,” “expect,” “plan,” “anticipate,” “believe,” “estimate,” “predict,” “potential” or the negative of these terms or other comparable terminology. None of the Trust, the Sponsor, the Trustee or the Delaware Trustee assumes responsibility for the accuracy or completeness of any forward-looking statements. None of the Trust, the Sponsor, the Trustee or the Delaware Trustee is under a duty to update any of the forward-looking statements to conform such statements to actual results or to a change in expectations or predictions.
Introduction
The iShares® Diversified Alternatives Trust (the “Trust”) is a Delaware statutory trust that issues units of beneficial interest (“Shares”) representing fractional undivided beneficial interests in its net assets. The Trust holds long and/or short positions in foreign currency forward contracts and exchange-traded futures contracts involving assets such as commodities, currencies, interest rates and certain eligible stock and/or bond indices. Investments for the Trust’s portfolio are selected by BlackRock Fund Advisors (the “Advisor”) following investment strategies that utilize quantitative methodologies to identify potentially profitable discrepancies in the relative values or market prices of one or more assets.
iShares® Delaware Trust Sponsor LLC, a Delaware limited liability company, is the “Sponsor” of the Trust. BlackRock Institutional Trust Company, N.A. is the “Trustee” of the Trust. The Trust is a commodity pool, as defined in the Commodity Exchange Act (the “CEA”) and the applicable regulations of the Commodity Futures Trading Commission (the “CFTC”), and is operated by the Sponsor, a commodity pool operator registered with the CFTC. The Advisor serves as the commodity trading advisor of the Trust and is registered under the CEA. The Trust has delegated some of the administration of the Trust to State Street Bank and Trust Company (the “Trust Administrator”). Wilmington Trust Company, a Delaware banking corporation, serves as the “Delaware Trustee” of the Trust.
The Trust offers Shares on a continuous basis. The Trust issues and redeems Shares only in one or more blocks of 100,000 Shares (“Baskets”). These transactions take place only with certain broker-dealers with whom the Trust has entered into written arrangements regarding the issuance and redemption of Shares (we refer to these broker-dealers as “Authorized Participants”), in each case in exchange for a consideration per Share equal to the net asset value per Share announced by the Trust on the first Business Day after the purchase or redemption order is received by the Trust. A “Business Day” is defined as any day other than: (a) a Saturday or a Sunday; or (b) a day on which NYSE Arca, Inc. (“NYSE Arca”) is closed for regular trading. Only institutions that enter into an agreement with the Trust to become Authorized Participants may purchase or redeem Baskets. The Trust has delegated the processing of creation and redemption orders of Baskets to SEI Investments Distribution Co.
The Trust is a passive investor in the cash or U.S. Treasury securities and other short-term securities (“Short-Term Securities”) posted as margin to collateralize the portfolio of futures and/or forward contracts, cash and other investments held by the Trust (the “Portfolio”). The Trust does not engage in any activities designed to obtain a profit from, or to ameliorate losses caused by, changes in the value of Short-Term Securities posted as margin.
Shares of the Trust trade on NYSE Arca under the symbol “ALT.”
Computation of Trust’s Net Asset Value
On each Business Day, as soon as practicable after the close of regular trading of the Shares on NYSE Arca (normally 4:15 p.m., New York time), the Trustee determines the net asset value of the Trust, the “NAV” and the amount equal to the product of the NAV and the number of shares constituting a Basket (“Basket Amount”) as of that date. The NAV is the net asset value of the Trust divided by the number of outstanding Shares.
“Net asset value of the Trust” means the total assets of the Trust, including all cash and cash equivalents or other debt securities less total liabilities of the Trust, each determined on the basis of accounting principles generally accepted in the United States of America (“U.S. GAAP”), consistently applied under the accrual method of accounting. In particular, net asset value of the Trust includes any unrealized profit or loss on open forward contracts and futures contracts, and any other credit or debit accruing to the Trust but unpaid or not received by the Trust.
14
Table of Contents
On each day on which the Trustee must determine the net asset value of the Trust and the NAV, the Trust Administrator must value all futures and forward trading positions and other Short-Term Securities and non-cash assets in the Portfolio and communicate such valuation to the Trustee for use by the Trustee in the determination of the Trust’s net asset value.
The current market value of all open futures contracts, whether traded on a United States exchange or a non-United States exchange, is determined by the Trust Administrator based upon the settlement price for that particular futures contract traded on the applicable exchange on the date with respect to which net asset value is being determined; provided, that if a futures contract could not be liquidated on such day due to the operation of daily limits (if applicable) or other rules, procedures or actions of the exchange upon which that position is traded or otherwise, the settlement price on the most recent day on which the position could have been liquidated may be the basis for determining the market value of the position for that day.
The current market value of all open forward contracts is based upon the prices determined by the Trust Administrator utilizing data from an internationally recognized valuation service for those types of assets.
The Trustee may in its discretion (and, under extraordinary circumstances, will) value any asset of the Trust pursuant to other principles that it deems fair and equitable. In this context, “extraordinary circumstances” include, for example, periods during which a valuation price for a forward contract or a settlement price of a futures contract is not available due to events such as systems failure, natural or man-made disaster, act of God, armed conflict, act of terrorism, riot or labor disruption or any similar intervening circumstance or due to a trading or other restriction imposed by a relevant futures exchange.
On each Business Day, the Trustee subtracts the Trust’s accrued fees (other than fees computed by reference to the value of the Trust or its assets), expenses and other liabilities on that day from the value of the Trust’s assets as of the close of trading on that day. The difference is the Trust’s “Adjusted Net Asset Value.” Fees computed by reference to the value of the Trust or its assets are calculated based on the Adjusted Net Asset Value. The Trustee subtracts the fees of the Trust calculated on an Adjusted Net Asset Value basis to determine the Trust’s net asset value.
The Trust Administrator may be replaced if, in the judgment of the Trustee, it ceases to provide regular or accurate valuations.
Overall Performance
The Trust returned (2.95)% for the nine months ended September 30, 2011 (the “reporting period”). The negative performance was largely driven by the currency, short-term fixed income and the equity market investments. The long-term fixed income market investments had a positive contribution to the performance.
Market Environment/Background
The global markets experienced significant events and volatility for the nine months ended September 30, 2011. The year began with optimism in the U.S., Asian, and the European Union (EU) region markets. This optimism carried through April and most major countries/indices outperformed, with some disruptions in March as a result of the immense natural disaster in Japan. However, this bull market came to a halt in May and continued to have difficulty finding its footing. This was driven by the mounting pressure on sovereign debt in the EU region as well as the anemic recovery of the U.S., which was further aggravated by the political impasse over the debt ceiling. These events led to a situation where there was fear of risk in the market and investors were highly concerned about getting a return of their capital rather than a return on their capital. Investors faced immense uncertainty which led to massive risk aversion and global sell-off.
Although optimism about the health of the U.S. economy grew at the beginning of the year, the reports on U.S. macro-economic data remained mixed and unemployment numbers were persistently high, which raised concern over the fragile recovery of the U.S. economy. The U.S. market faced three main issues: 1) Political impasse over debt ceiling and loss of trust in the direction of U.S. policy to address economic recovery 2) the Federal Reserve’s acknowledgement of the structural problems in the economy and 3) extremely low investor sentiment, which reached its lowest level in thirty years (based on a survey conducted by the University of Michigan).
Moreover, the decline in government spending and tightening monetary policy at the state level were factors that contributed to higher-than-expected unemployment numbers, even though the private sector maintained its pace of hiring. The U.S. rating was downgraded one notch by Standard and Poor’s, and the equity market, as measured by the S&P 500 Index, delivered a poor performance of (14)% during the reporting period. The dollar index was not as volatile as the euro (more than 9%) and depreciated steadily through June 2011. However, as the markets digested the high uncertainty ahead, the dollar began to appreciate and the index ended up returning about 6% during the reporting period.
15
Table of Contents
The EU markets were highly volatile during the reporting period as Greece, Ireland, and Portugal sovereign debt crises continued to cast a cloud over the euro zone and global recovery. Both Greece’s and Ireland’s credit ratings were downgraded and the outlook on Belgium was cut to negative in this reporting period. EU markets experienced some optimism based on the sweeping compromise between the European Central Bank (ECB), International Monetary Fund (IMF), and EU officials which granted Greece a massive bailout of approximately $155 billion. European officials also requested banks to roll over their Greek debt in order to avoid restructuring. But this optimism was short-lived, amid speculation that Italy may be engulfed by the crisis. This concern hinted that the core EU may also suffer from debt issue and the situation could spiral out of control in the near future.
European officials scrambled in the third quarter to calm the markets and prevent the first sovereign default in the euro area. The fear was that this crisis could cripple the banking system. The German and French equity markets were particularly volatile (more than 26%) during the reporting period. Both DAX and CAC 40 delivered poor performances of about (26.1)% and (28.2)%, respectively. Euro currency was also quite volatile (more than 11%), but surprisingly appreciated about 0.7% by the end of the reporting period. The resilience of the euro in light of the sovereign debt crises has been somewhat surprising.
In the early part of the reporting period, the Nordic countries’ macro economic data were strong and Sweden raised its forecast for growth in the next few years. Additionally, the central bank raised its benchmark repo again in April and July, and the Swedish krona advanced against major currencies. Norway also benefitted from the sharp rise in the oil price and its currency appreciated substantially. However, between June and September, these currencies experienced high volatility. The concern over global growth and the sovereign debt crisis in the EU region continued to put downward pressure on these currencies. The reason was that faltering economies do not support any strong global growth in the near future and the strength of these two economies relies on export. The Swedish krona depreciated 1.8% and the Norwegian krone depreciated 0.2% during the reporting period.
Japan kicked off the year with some optimism. The Bank of Japan raised its economic assessment as faster overseas growth bolstered exports and production. However, the massive earthquake and tsunami in March devastated the country, and the aftermath derailed hopes of economic growth and prosperity in the short term. Japan began to struggle with industrial production, and the supply chains were disrupted significantly.
Based on the careful assessment of the situation, the Investment Committee of the Advisor did not find the uncertainty surrounding this exogenous shock to be consistent with the Trust’s systematic process in the short-term and closed out of all the Japanese positions in the equity, bond, and currency markets in mid-March. This action was based on two ongoing key drivers, namely the nuclear containment and the electricity shortfall. However, the country was able to pull together and pursue a Draconian conservation campaign to manage the electricity shortfall effectively. They also were able to bring the nuclear situation under control. The Investment Committee proactively monitored the situation and the key drivers on a weekly basis. By mid-August, all the information indicated that the country has made significant progress on both fronts and the risk of an energy or nuclear shock is back to normal level. Given that the Japanese market has comparatively recognized this “normal” state, Japan was re-introduced to the Trust’s investment universe in the subsequent fund rebalance in September.
At the beginning of 2011, the Middle East and North African unrest raised concerns over the spread of the instability into the rest of the Middle East. This instability could potentially cause serious disruption in oil supply and push the price of oil upward. Abrupt price increase could, in principle, hamper global growth levels and introduce unexpected inflation in the Western world, which could hinder the fragile global economic recovery. The oil price reached the $115 mark late April. However, concern over the euro zone debt crisis and the subdued outlook on the U.S. economy did not support the near future demand and the oil price took a dive and reached as low as $75 during the third quarter.
Portfolio Update
The Trust closed out of all the Japanese positions in the equity, bond, and currency markets in mid-March, due to the massive earthquake and tsunami in that country. This temporary removal was a response to an extreme situation where the current suite of signals provided minimal information relevant to Japan and helped the Trust to mitigate risk. With the ongoing and significant improvement of the two key drivers, mentioned above, the Trust felt comfortable in adding back Japan to the asset universe in September 2011.
The equity yield-curve arbitrage strategy, which was approved by the Investment Committee in May, was added to the current suite of strategies as of June 1, 2011. With this addition, the equity asset class takes advantage of all three strategies offered by the Trust. The existing equity relative value strategy was also enhanced to account for irregularities in accounting practices across different countries. These additions/changes helped the Trust to enhance its equity performance during the reporting period.
16
Table of Contents
As a result of heightened uncertainty in the global markets, the fund’s short term volatility began to rise steadily in July and increased sharply in the month of August. To manage the risk of the portfolio effectively and maintain risk within the stated range of 6% to 8% in the long term, the fund’s target risk was resized in September’s rebalance.
Trust’s Strategies’ Performance
The Trust’s investments in equity markets delivered a negative performance of (0.43)% during the reporting period (see figure 1). In general, equity markets were highly volatile, which was primarily driven by all of the factors mentioned above. The under-performance in the Trust’s equity market investments was driven by the long positions in the German, French and Japanese equity markets. The short positions in the Canadian, Swedish and Hong Kong equity markets contributed positively to the performance of this asset class.
The Trust’s investments in futures on short-term bonds (bonds with maturities of less than one year) suffered a negative performance of (0.82)% during the reporting period (see Figure 1). The short-term interest rate market sentiment insights were generally positive for the first half of the reporting period. However, the euro zone sovereign debt crises made the short-term interest rate market more volatile between June and September 2011. The large short position in Euribor combined with the long position in Eurosterling was the major detractors. The long position in Eurodollar delivered a small positive performance.
The Trust’s investments in futures on long-term bonds (bonds with maturities of more than one year) delivered a positive performance of 0.46% during the reporting period (see Figure 1). The large long positions in the U.S. Treasuries and UK Gilt added to the performance in this reporting period. On the other hand, the short positions in the German, Canadian, and Australian bonds detracted from performance and offset some of the gains.
The Trust’s investments in currency markets suffered the largest negative performance of (2.16)% during the reporting period (see Figure 1). The short positions in Swiss franc and euro combined with the long position in Norwegian krone detracted from the performance. The long positions in Swedish krona and Australian dollar contributed positively to the performance and helped to offset a small portion of the loss.
The Trust exploited three strategies (namely, relative value, momentum, and yield curve arbitrage or carry) across three different asset classes during the reporting period. Of these three strategies, the yield curve arbitrage and relative value strategies delivered positive performances of 1.09% and 0.91%, respectively. On the other hand, the momentum strategies returned (4.95)%. The underperformance in momentum strategy was the result of highly volatile equity, fixed income, and currency markets, which did not allow for the establishment of sizeable trends that momentum techniques could benefit from. See Figure 2 for the performance of each strategy during the reporting period.
The Trust’s annualized portfolio return volatility was 7.6% during the reporting period, based on the daily performance of the Trust. The Trust experienced a sharp increase in volatility relative to last year’s reported number. This was primarily driven by Japan’s natural disaster, the euro zone sovereign debt crisis, and concern over the U.S.’s anemic recovery and their effects on local and global markets. The realized volatility was well within the stated target risk, and the Trust continues to maintain an expected annualized portfolio return volatility of 6% to 8%. The proprietary risk model uses more than 19 years of historical return data to calculate the expected annualized portfolio return volatility.
The realized Sharpe ratio of the portfolio was pushed in the negative territory for this reporting report and its value dropped to (0.21) since inception. The relatively large drop in the return of the portfolio, combined with the sharp increase in the portfolio’s volatility, which was observed primarily in the third quarter, led to this negative risk-adjusted return. The upward shift in the Trust’s volatility was the result of an alarming uncertainty and larger-than-usual global markets volatilities. Trust continues to target a long-term Sharpe ratio between 0.50 and 0.75.
17
Table of Contents
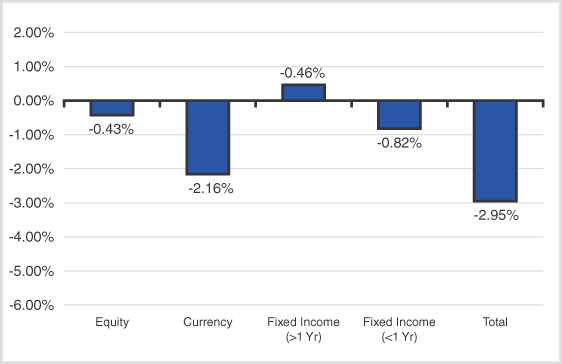
Figure 1: Asset class total return during the reporting period
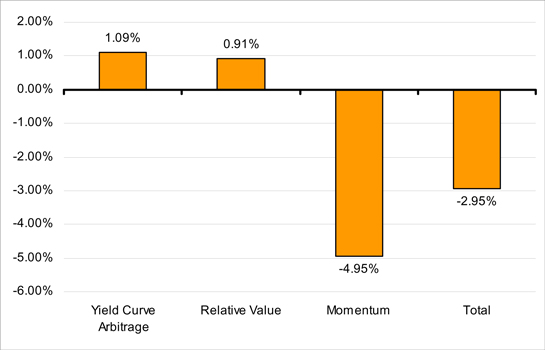
Figure 2: Strategy total return during the reporting period
18
Table of Contents
Results of Operations
The Trust invested in three broad asset classes: currency, equity, and fixed income through investments in forward and futures contracts and Short-Term Securities posted as margin to collateralize the portfolio of futures and/or forward contracts. The fixed income asset class includes bond futures with duration greater than one year and short-term interest rate futures less than or equal to one year. See below for a discussion on the performance of the Trust for the quarter and nine months ended September 30, 2011.
The Quarter Ended September 30, 2011
The Trust’s net asset value decreased from $129,332,415 at June 30, 2011 to $127,239,937 at September 30, 2011. The decrease in the Trust’s net asset value primarily resulted from an increase in net realized and unrealized loss from investments.
Net loss for the period was $7,153,683, resulting from a net investment loss of $312,281 and a net realized and unrealized loss of $6,841,402. For the quarter ended September 30, 2011, the Trust had a net gain of $8,766 on short-term investments, a net realized and unrealized loss of $3,426,561 from forward currency contracts, a net realized and unrealized loss of $867,040 from equity index futures, a net realized and unrealized loss of $2,434,795 from fixed income futures, and a net unrealized loss of $147,110 from foreign currency translations. Net realized and unrealized gain and loss for the period from futures contracts noted above do not reconcile to the Statement of Operations due to brokerage commissions and fees.
The increase of $125,543 in total expenses from $208,034 for the quarter ended September 30, 2010 to $333,577 for the quarter ended September 30, 2011, was primarily due to an increase in the Sponsor’s fee. The Sponsor’s fee increased due to an increase in the Trust’s net assets.
The Nine Months Ended September 30, 2011
The Trust’s net asset value increased from $110,938,681 at December 31, 2010 to $127,239,937 at September 30, 2011. The increase in the Trust’s net asset value primarily resulted from an increase in outstanding Shares, which rose from 2,200,000 at December 31, 2010 to 2,600,000 at September 30, 2011, due to 700,000 Shares (7 Baskets) being created and 300,000 Shares (3 baskets) being redeemed during the period.
Net loss for the period was $4,194,585, resulting from a net investment loss of $831,695 and a net realized and unrealized loss of $3,362,890. For the nine months ended September 30, 2011, the Trust had a gain of $11,528 on short-term investments, a net realized and unrealized loss of $2,896,406 from forward currency contracts, a net realized and unrealized gain of $215,082 from equity index futures, a net realized and unrealized loss of $596,824 from fixed income futures, and a net unrealized loss of $157,065 from foreign currency translations. Net realized and unrealized gain and loss for the period from futures contracts noted above do not reconcile to the Statement of Operations due to brokerage commissions and fees.
The increase of $530,211 in total expenses from $408,995 for the nine months ended September 30, 2010 to $939,206 for the nine months ended September 30, 2011, was primarily due to an increase in the Sponsor’s fee. The Sponsor’s fee increased due to an increase in the Trust’s net assets.
Liquidity and Capital Resources
A significant portion of the assets of the Trust are held in cash, U.S. Treasury bills and other Short-Term Securities which are used, as needed, to secure the Trust’s trading obligations in respect of a portfolio of futures and/or forward contracts as described elsewhere in this report. The percentage that cash, U.S. Treasury bills and Short-Term Securities given as collateral bears to the total assets of the Trust varies from day to day, depending on the changes in the market values of the contracts held in the Portfolio.
The Trust’s liquidity needs arise in connection with payment of (1) mark-to-market and termination costs of futures and forward contracts with respect to which the Trust is “out of the money,” (2) redemption of Baskets, (3) the Sponsor’s fee, (4) trading fees and commissions, and (5) any expenses not assumed by the Sponsor. The Sponsor is not aware of any trends, demands, conditions or events that are reasonably likely to result in material changes to the Trust’s liquidity needs.
The Trust is expected to generate liquidity from (1) mark-to-market and termination payments received with respect to futures and forward contracts with respect to which the Trust is “in the money,” (2) the sale of Baskets, (3) any interest on its cash and other instruments (including, when and to the extent they become available to the Trust, securities held as collateral for the Trust’s trading obligations), and (4) the disposition of its assets. Pursuant to the trust agreement, the Trust is prohibited from incurring any indebtedness for borrowed money.
19
Table of Contents
The Trust’s futures contracts may from time to time be subject to periods of illiquidity due to market conditions, regulatory limits or other reasons. Futures exchanges limit the fluctuations during a single day of prices of the contracts traded on such exchanges by regulations known as “daily limits.” Once the price of a futures contract has increased or decreased by an amount equal to the daily limit, positions in that contract can not be taken or liquidated unless the parties are willing to affect the trade at a price equal to or within the daily limit.
The Trust’s Portfolio or one or more of its futures or forward contract positions may prove to be illiquid. Such illiquidity could cause or exacerbate losses to the Trust.
Because the Portfolio may include a variety of trading positions, the Trust’s capital is at risk due to changes in the value of such positions or other assets (market risk) or the inability of counterparties to perform (credit risk).
Market Risk
The Portfolio consists of positions in certain futures and/or forward contracts and cash and financial instruments which may be used, as needed, to secure the Trust’s trading obligations with respect to those trading positions. Depending upon the level of diversification of the Portfolio at any given time, fluctuations in the value of one or more trading positions of the Trust may have a significant impact on the value of the Shares. The value of any futures and/or forward contracts in the Portfolio at any time is expected to reflect the market value of the underlying asset, although this correlation may not be exact. The market risk associated with the trading positions in the Portfolio may, potentially, be the entire Portfolio. The Trust’s exposure to market risk is also influenced by a number of factors, including the liquidity of the assets in the Portfolio, market conditions in U.S. and non-U.S. markets, market volatility and activities of other market participants.
Credit Risk
In respect of each trading position in the Portfolio, the Trust is exposed to the credit risk of a default by the counterparties to over-the-counter trades and, with respect to exchange-traded contracts, of a default by relevant brokers or the clearing institutions or exchanges through which such trades settle. In the case of such a default, the Trust could be unable to recover amounts due to it on its trading positions and assets posted as margin. The Portfolio is also exposed to the credit risk of the obligors of any Short-Term Securities posted as margin.
Off-Balance Sheet Arrangements and Contractual Obligations
The Trust does not use and is not expected to use special purpose entities to facilitate off-balance sheet financing arrangements. The Trust does not have and is not expected to have loan guarantee arrangements or other off-balance sheet arrangements of any kind other than agreements entered into in the normal course of business, which may include indemnification provisions related to certain risks service providers undertake in performing services that are in the interest of the Trust. While the Trust’s exposure under such indemnification provisions cannot be estimated, these general business indemnifications are not expected to have a material impact on the Trust’s financial position. The Trust is contractually obligated to maintain margin with its clearing futures commission merchant and its prime broker. Under extreme circumstances, such contractual obligations could demand substantially all of the assets of the Trust.
Critical Accounting Policies
The financial statements of the Trust and accompanying notes are prepared in accordance with U.S. GAAP. The preparation of these financial statements relies on estimates and assumptions that impact the Trust’s financial positions and results of operations. These estimates and assumptions affect the Trust’s application of accounting policies. Please refer to Note 2 to the financial statements of the Trust for a further discussion of the Trust’s accounting policies.
Item 3. Quantitative and Qualitative Disclosures About Market Risk
Quantitative Disclosure
Please refer to the Schedule of Investments in the financial statements for quantitative disclosure for open forward currency contracts and open futures contracts held by the Trust as of September 30, 2011.
20
Table of Contents
Qualitative Disclosure
The investment objective of the Trust is to maximize absolute returns from a portfolio of foreign currency forward contracts and exchange-traded futures contracts that may involve commodities, currencies, interest rates and certain eligible stock or bond indices while seeking to reduce the risks and volatility inherent in those investments by taking long and short positions in historically correlated assets. As a result, at any time the Trust may have substantial exposure to interest rate risk, foreign currency exchange rate risk, commodity price risk and equity price risk.
Part I, Item 1A. “Risk Factors” of the registrant’s Annual Report on Form 10-K for the year ended December 31, 2010, filed with the Securities and Exchange Commission on March 24, 2011 discussed these risks in detail. Specifically, please refer to “Risks Relating to U.S. Government and Sovereign Debt Markets” and “Risks Relating to Interest Rate Derivatives Markets” for further discussion of interest rate risk, “Risks Relating to Currency Markets” for further discussion of foreign currency exchange rate risk, “Risks Relating to Commodities Markets” for further discussion of commodity price risk and “Risks Relating to Security Index Futures Markets” for further discussion of equity price risk.
In addition, the Advisor utilizes a portfolio construction process in which each potential strategy and underlying asset is ranked in terms of expected return, volatility and trading cost. This portfolio construction process is quantitative and relies on the use of computer models developed by affiliates of the Advisor for the computation of expected return, volatility and trading cost and the determination of optimal positions and consequent leverage in accordance with the risk and return targets of the Portfolio. These risk and return targets take into account certain financial measurements known as annualized portfolio return volatility and Sharpe ratio. Annualized portfolio return volatility is a quantitative measure used to assess a portfolio’s deviation above or below its average returns over a one year period. The Portfolio’s construction targets an allocation of annualized portfolio return volatility of 6-8%, which is allocated equally across the investment strategies of the Trust.
The Advisor expects a Sharpe ratio of 0.50 to 0.75 for the Portfolio. A Sharpe ratio is a quantitative measure of the excess return per unit of risk in an investment asset or a trading strategy. The Advisor measures excess returns as the realized portfolio return minus a one-month Treasury bill benchmark return for the same period being measured. The Advisor measures risk as the annualized portfolio return volatility described above. For example, a 0.50 Sharpe ratio indicates that for each one percent of excess return, an investor may expect 2% of annualized portfolio return volatility (0.50 = 1%/2%). Also, a 0.75 Sharpe ratio indicates that for each one percent of excess return, an investor may expect approximately 1.33% of annualized portfolio return volatility (0.75 = 1%/1.33%). Some or all of the Advisor’s expectations or targets may not be realized by the Trust.
The principals of the Advisor determine the asset allocation for the Portfolio which seeks to achieve a target excess return at a targeted risk level. The Advisor expects to allocate Trust investments periodically among yield and futures curve arbitrage strategies, technical strategies and fundamental relative value strategies such as those listed above using a “mean variance optimization.” Mean variance optimization is a method used to determine portfolio allocations by considering risk and return metrics. The goal of mean variance optimization is to diversify risk based on quantitative analysis of historical relationships without reducing expected return. There is no guarantee that the Advisor will be able to achieve this goal for the Trust.
Item 4. Controls and Procedures
The duly authorized officers of the Sponsor performing functions equivalent to those a principal executive officer and principal financial officer of the Trust would perform if the Trust had any officers, and with the participation of the Trustee, have evaluated the effectiveness of the Trust’s disclosure controls and procedures, and have concluded that the disclosure controls and procedures of the Trust were effective as of the end of the period covered by this report to provide reasonable assurance that information required to be disclosed in the reports that the Trust files or submits under the Securities Exchange Act of 1934, as amended, is recorded, processed, summarized and reported, within the time periods specified in the applicable rules and forms, and that it is accumulated and communicated to the duly authorized officers of the Sponsor performing functions equivalent to those a principal executive officer and principal financial officer of the Trust would perform if the Trust had any officers, as appropriate to allow timely decisions regarding required disclosure.
There are inherent limitations to the effectiveness of any system of disclosure controls and procedures, including the possibility of human error and the circumvention or overriding of the controls and procedures.
There were no changes in the Trust’s internal control over financial reporting that occurred during the period covered by this report that have materially affected, or are reasonably likely to materially affect, the Trust’s internal control over financial reporting.
21
Table of Contents
None.
There have been no material changes to the Risk Factors last reported under Part I, Item 1A of the registrant’s Annual Report on Form 10-K for the year ended December 31, 2010, filed with the Securities and Exchange Commission on March 24, 2011.
Item 2. Unregistered Sales of Equity Securities and Use of Proceeds
a) None.
b) As described in the Trust’s first registration statement on Form S-1 (No. 333-153099), which was declared effective on November 12, 2009, proceeds received by the Trust from the issuance and sale of Shares to Authorized Participants consists of cash, which is invested in United States government securities and other financial instruments that, in compliance with the rules of the futures exchanges and other markets where the Trust trades, are eligible to secure the Trust’s trading obligations.
c) 100,000 Shares (1 Basket) were redeemed during the quarter ended September 30, 2011.
| Period |
Total Number of Shares Redeemed |
Average Price Per Share |
||||||
| 7/01/11 to 7/31/11 |
— | $ | — | |||||
| 8/01/11 to 8/31/11 |
— | — | ||||||
| 9/01/11 to 9/30/11 |
100,000 | 49.13 | ||||||
|
|
|
|||||||
| Total |
100,000 | 49.13 | ||||||
|
|
|
|||||||
Item 3. Defaults Upon Senior Securities
None.
None.
22
Table of Contents
| Exhibit No. |
Description | |
| 4.1 | First Amended and Restated Trust Agreement incorporated by reference to Exhibit 4.1 filed with Amendment No. 5 to Registration Statement No. 333-153099 on October 13, 2009 | |
| 4.2 | Creation and Redemption Procedures incorporated by reference to Exhibit 4.2 filed with Amendment No. 5 to Registration Statement No. 333-153099 on October 13, 2009 | |
| 4.3 | Standard Terms of Authorized Participant Agreement incorporated by reference to Exhibit 4.3 filed with Amendment No. 5 to Registration Statement No. 333-153099 on October 13, 2009 | |
| 10.1 | Investment Advisory Agreement incorporated by reference to Exhibit 10.1 filed with Amendment No. 5 to Registration Statement No. 333-153099 on October 13, 2009 | |
| 10.2 | Futures Commission Merchant Agreement incorporated by reference to Exhibit 10.2 filed with Amendment No. 5 to Registration Statement No. 333-153099 on October 13, 2009 | |
| 10.3* | Foreign Exchange Prime Brokerage Agency Agreement incorporated by reference to Exhibit 10.3 filed with Post Effective Amendment No. 2 to Registration Statement 333-153099 on October 12, 2010 | |
| 31.1 | Certification by Principal Executive Officer Pursuant to Rule 13a-14(a) under the Securities Exchange Act of 1934, as amended, for iShares® Diversified Alternatives Trust | |
| 31.2 | Certification by Principal Financial Officer Pursuant to Rule 13a-14(a) under the Securities Exchange Act of 1934, as amended, for iShares® Diversified Alternatives Trust | |
| 32.1 | Certification by Principal Executive Officer Pursuant to 18 U.S.C. Section 1350, as Adopted Pursuant to Section 906 of the Sarbanes-Oxley Act of 2002 | |
| 32.2 | Certification by Principal Financial Officer Pursuant to 18 U.S.C. Section 1350, as Adopted Pursuant to Section 906 of the Sarbanes-Oxley Act of 2002 | |
| 101.INS** | XBRL Instance Document | |
| 101.SCH** | XBRL Taxonomy Extension Schema Document | |
| 101.CAL** | XBRL Taxonomy Extension Calculation Linkbase Document | |
| 101.LAB** | XBRL Taxonomy Extension Label Linkbase Document | |
| 101.PRE** | XBRL Taxonomy Extension Presentation Linkbase Document | |
| * | Confidential portions of this document have been filed separately with the Securities and Exchange Commission pursuant to a request for confidential treatment. |
| ** | Pursuant to Rule 406T of Regulation S-T, these interactive data files are deemed not filed or part of a registration statement or prospectus for purposes of Sections 11 or 12 of the Securities Act of 1933, as amended not filed for the purposes of Section 18 of the Securities and Exchange Act of 1934, as amended, and otherwise are not subject to liability under those sections. |
23
Table of Contents
Pursuant to the requirements of the Securities Exchange Act of 1934, the registrant has duly caused this report to be signed on its behalf by the undersigned in the capacities* indicated, thereunto duly authorized.
iShares® Delaware Trust Sponsor LLC
Sponsor of the iShares® Diversified Alternatives Trust (registrant)
| /s/ Patrick J. Dunne |
| Patrick J. Dunne |
| President and Chief Executive Officer |
| (Principal executive officer) |
| Date: November 14, 2011 |
| /s/ Jack Gee |
| Jack Gee |
| Chief Financial Officer |
| (Principal financial officer) |
| Date: November 14, 2011 |
| * | The registrant is a trust and the persons are signing in their respective capacities as officers of iShares® Delaware Trust Sponsor LLC, the Sponsor of the registrant. |
24