Attached files
| file | filename |
|---|---|
| 8-K - Prestige Consumer Healthcare Inc. | a8-kpressreleasenov102011.htm |
| EX-99.1 - PRESS RELEASE - Prestige Consumer Healthcare Inc. | fy12-q2earningsreleaseexhi.htm |
November 10, 2011 Review of Second Quarter F’12 Results Matthew Mannelly, CEO Ronald Lombardi, CFO Exhibit 99.2

2 Safe Harbor Disclosure This presentation contains certain “forward-looking” statements within the meaning of the Private Securities Litigation Reform Act of 1995, such as statements about the Company‟s growth strategies, investments in advertising and promotion, market position, product introductions and innovations, and future financial performance. Words such as "continue," "will," "believe," “intend,” “expect,” “anticipate,” “plan,” “potential,” “estimate,” “may,” “should,” “could,” “would,” and similar expressions identify forward- looking statements. Such forward-looking statements represent the Company‟s expectations and beliefs and involve a number of known and unknown risks, uncertainties and other factors that may cause actual results to differ materially from those expressed or implied by such forward-looking statements. These factors include, among others, the failure to successfully commercialize new and enhanced products, the effectiveness of the Company‟s advertising and promotions investments, continuing decline in the household cleaning products market, the severity of the cold/cough season, the effectiveness of the Company‟s marketing and distribution infrastructure, and other risks set forth in Part I, Item 1A. Risk Factors in the Company‟s Annual Report on Form 10-K for the year ended March 31, 2011. You are cautioned not to place undue reliance on these forward-looking statements, which speak only as of the date of this presentation. Except to the extent required by applicable securities laws, the Company undertakes no obligation to update any forward-looking statement contained herein, whether as a result of new information, future events, or otherwise.

3 Second Quarter Highlights Solid financial performance for Q2: − Q2 sales of $105.5 million, up 34.8% from the prior year‟s Q2; on the heels of Q1 sales of $95.3 million, up 10.8% − Revenue growth of over 4% for five Core OTC brands compared to last year‟s Q2, fifth consecutive quarter of growth − Reported EPS of $0.26 vs. $0.22, an 18.2% increase − FCF of $17.8 million allowing for continued pay down of debt* Strategy of Increased A&P Support Is Working − Nine Core OTC Brands Consumption Up 12.1% − Innovation in product and marketing demonstrating it makes a difference Household shows improvement versus previous six quarters PBH Consumer continue to prosper in this economy – Our Consumer portfolio and solid balance sheet due to strong free cash flow leave PBH well-positioned in current environment *Non-GAAP Free Cash Flow is reconciled to GAAP Net Cash provided by operating activities in our Earnings Release in the “About Non- GAAP Financial Measures” section.
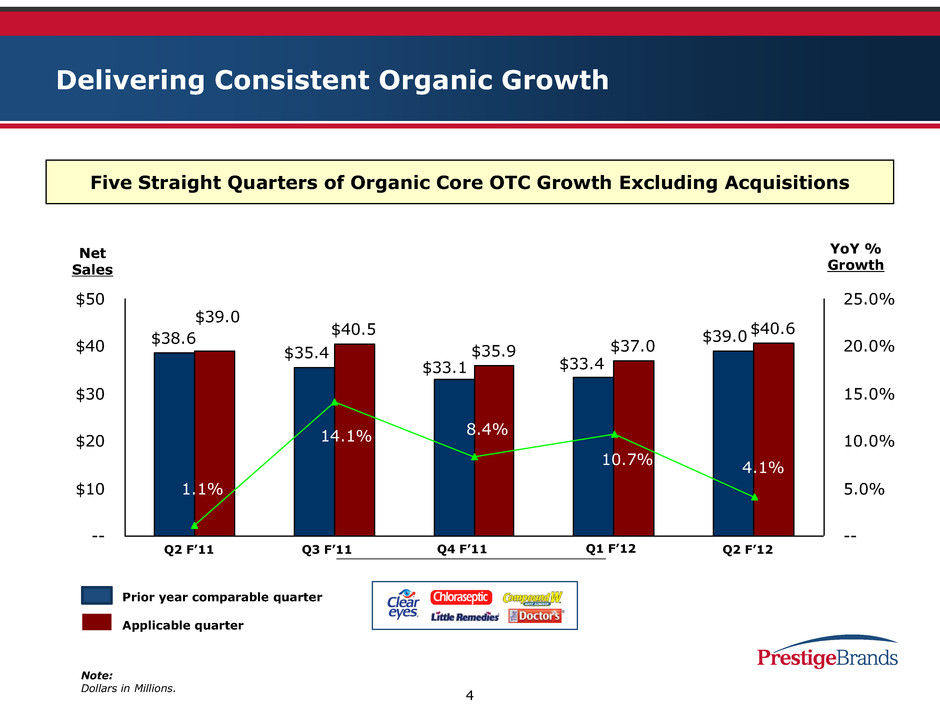
4 Net Sales Five Straight Quarters of Organic Core OTC Growth Excluding Acquisitions Delivering Consistent Organic Growth Prior year comparable quarter Applicable quarter Note: Dollars in Millions. YoY % Growth $38.6 $40.5 $35.9 $37.0 $40.6 $35.4 $33.1 $33.4 $39.0 $39.0 1.1% 14.1% 8.4% 10.7% 4.1% -- $10 $20 $30 $40 $50 -- 5.0% 10.0% 15.0% 20.0% 25.0% Q2 F’11 Q3 F’11 Q4 F’11 Q1 F’12 Q2 F’12

5 Solid OTC Sales Growth Q2 FY 2011 Q2 FY 2012 (Dollars in Millions) $78.3 $39.0 $105.5 $40.6 $26.4$27.5 $0.0 $25.0 $50.0 $75.0 $100.0 $125.0 Prestige Total 5 Core Legacy OTC Brands (Excluding Acquisitions) Household 34.8% 4.1% (3.9%)

6 Consumption at Retail Driven by Effective A&P Investment Notes: Consumption is based on IRI (FDM) for 12 week period ending October 2, 2011. Category Brand (2.0%) (2.4%) 5.0% 12.1% (10.7%) (15.0%) (5.0%) 5.0% 15.0% 25.0% 35.0% Prestige Total 9 Core OTC Household (1.3%)
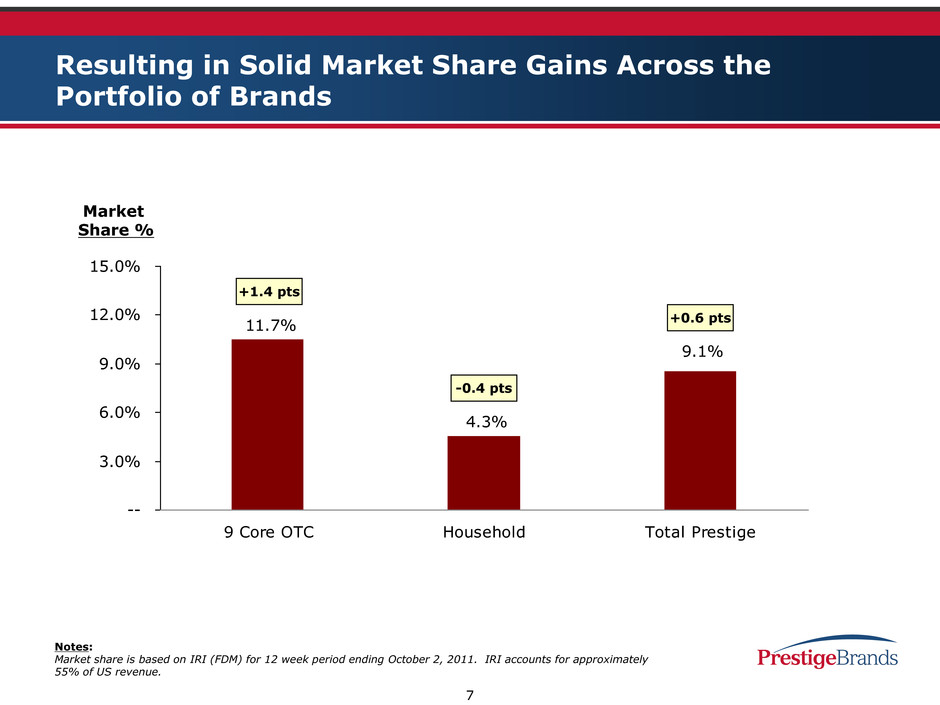
7 Resulting in Solid Market Share Gains Across the Portfolio of Brands Notes: Market share is based on IRI (FDM) for 12 week period ending October 2, 2011. IRI accounts for approximately 55% of US revenue. 11.7% 4.3% 9.1% -- 3.0% 6.0% 9.0% 12.0% 15.0% 9 Core OTC Household Total Prestige Market Share % +0.6 pts -0.4 pts +1.4 pts

8 Clear Eyes; A Vision of A Growing Brand Innovation in eye care gives consumers new cooling sensation with Clear Eyes Cooling Comfort New memorable TV ads featuring Ben Stein bring clear message of brand attributes Coupons in print and online stimulate consumer purchase and interest in newest SKUs Results: Clear Eyes outperforms the category* ® * Based on IRI Consumption Data (FDM) for the 12 week period ending October 2, 2011 -3.4% 8.6% -4% -2% 0% 2% 4% 6% 8% 10% Clear Eyes Category

9 PediaCare Surrounds Consumers 360 Innovated as the first in the market to bring new, safer dosing syringe system to parents New expanded marketing/advertising efforts reach out to consumers on TV, in print, on the web, and through professional pediatric channels PR effort featuring Dr. Jim Sears from TV‟s “The Doctors” speaks to caregivers about new dosing system Pediatric magazine ads in Contemporary Pediatrics, AAP News, etc. reach MDs to reinforce message to consumers Attendance at pediatric conferences educates and drives awareness to professional audiences Results: PediaCare Soars!* o Dr. Jim Sears ® 123.1% -3.1% -20% 0% 20% 40% 60% 80% 100% 120% 140% PediaCare Category • Based on IRI Consumption Data (FDM) for the 12 week period ending October 2, 2011

10 Progress Toward Household Stabilization Goal Q1 F’12 Q2 F’ 12 $24.1 $26.4 (9.1%) (3.9%) 1) STRENGTHEN: Competitiveness at retail through enhanced consumer value (Bonus Pack in second half) 2) EXPAND: Distribution across portfolio (Home Depot) 3) DEEPEN: Dollar Store penetration with Comet Classic and additional promotions in second half 4) LEVERAGE: Hispanic Markets; Comet Lavender Powder (Wal-Mart) Four Initiatives To Stabilize Comet® The overall market for household cleaning products continues to decline slightly across total household category (0.4%) Decline vs. same quarter of FY ‘11 Net Revenues (in millions)

11 PBH Portfolio Well-Positioned For Future… and Versus Competition OTC portfolio has grown from 57% to 75% in the last two years; now includes nine core brands PBH brands in strong position – Compete in niche categories – Eight #1 or #2 brands in their respective categories, representing approximately 60% of revenues – Building a diversified portfolio PediaCare® and Little Remedies® represent approximately 13% of revenues – < 7% of revenues are in children's analgesics and cough/cold – Significantly increased A&P support over last two seasons (20-30%) to build brand equity – Multiple brands have presented new long-term opportunities (trade, professional) – Private label has been biggest benefactor of competitive withdrawal – Innovative marketing at strong levels is building consumer connections
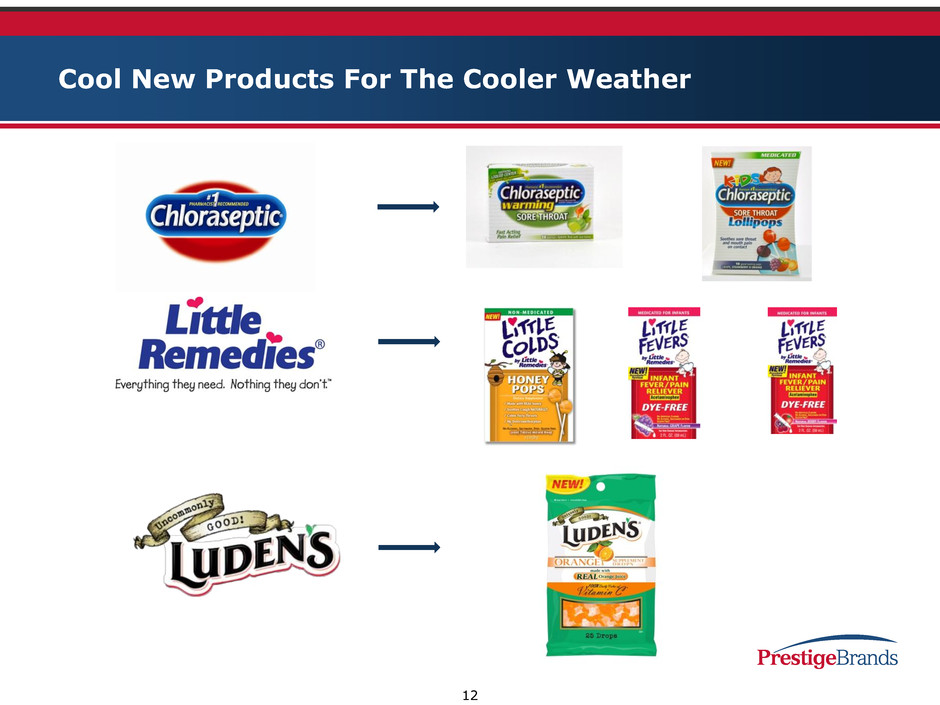
12 Cool New Products For The Cooler Weather
13 Strong Balance Sheet for This Economic Environment Excellent Free Cash Flow ~ $60+ million annually in various economic conditions* Robust Free Cash Flow provides leverage comfort due to rapid debt repayments* Leverage ratio of approximately 3.6x trailing Proforma EBITDA Capex <$1 million per year Attractive financial profile allows flexibility in capital structure Effective credit risk management program *Non-GAAP Free Cash Flow is reconciled to GAAP Net Cash provided by operating activities in our Earnings Release in the “About Non-GAAP Financial Measures” section.

14 One Year After Acquiring Blacksmith; Where Are We Now? Transformed to 75% OTC: fulfilling our stated objectives Now 9 core OTC brands supported by strong A&P for future growth Strengthened expertise in cough/cold, pediatrics and oral care Strong consumer franchises combined with increased importance to Retailers Blacksmith and Dramamine® brands meeting our initial projections Demonstrated results as part of ongoing strategy
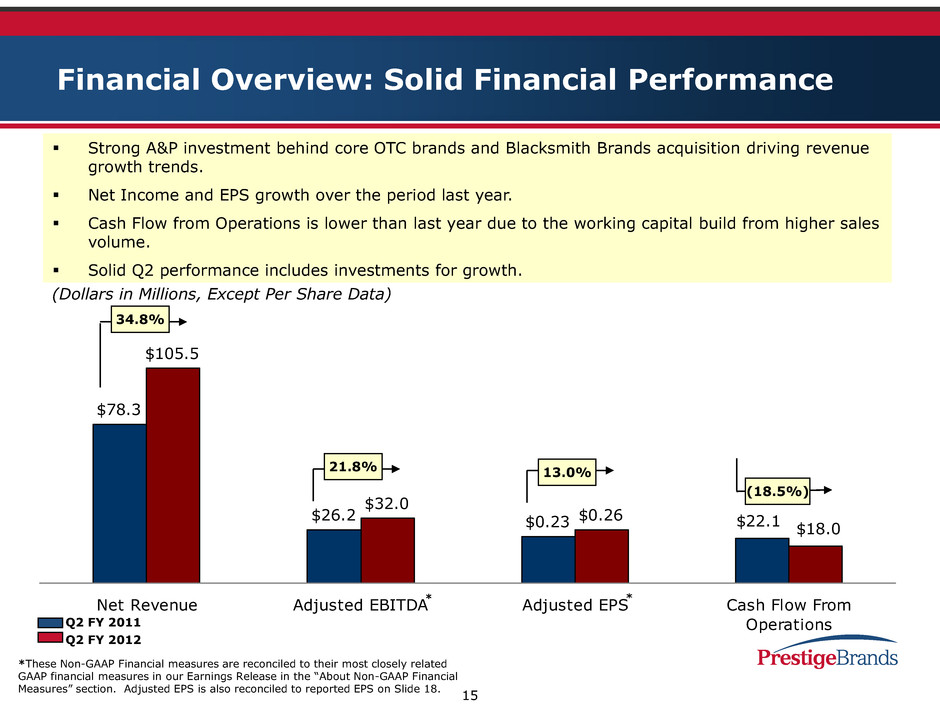
15 Financial Overview: Solid Financial Performance (Dollars in Millions, Except Per Share Data) $78.3 $26.2 $105.5 $32.0 $0.23 $22.1$0.26 $18.0 Net Revenue Adjusted EBITDA Adjusted EPS Cash Flow From Operations 21.8% 34.8% 13.0% (18.5%) Q2 FY 2011 Q2 FY 2012 Strong A&P investment behind core OTC brands and Blacksmith Brands acquisition driving revenue growth trends. Net Income and EPS growth over the period last year. Cash Flow from Operations is lower than last year due to the working capital build from higher sales volume. Solid Q2 performance includes investments for growth. * *These Non-GAAP Financial measures are reconciled to their most closely related GAAP financial measures in our Earnings Release in the “About Non-GAAP Financial Measures” section. Adjusted EPS is also reconciled to reported EPS on Slide 18.

16 Consolidated Financial Summary Net Revenue grew by $27.2 million or 34.8% over year ago. – 4.1% growth in legacy core OTC. – Acquisitions added $27.6 million. – Excluding acquisitions, revenue nearly flat as OTC gains were offset by lower HH revenue. As expected, gross margin was 3.3 ppt lower than last year largely due to the impact of the acquired Blacksmith Brands and HH. A&P investment continues to drive growth. Acquisitions added $4.1 million. G&A increase of $0.7 million due to the impact of acquisitions, headcount additions to support growth and the timing of incentive compensation accruals. Adjusted Net Income increased by 13.5% after one-time items. *These Non-GAAP Financial measures are reconciled to their most closely related GAAP financial measures in our Earnings Release in the “About Non-GAAP Financial Measures” section. Adjusted Net Income and Adjusted EPS are also reconciled to their reported GAAP amounts on Slide 18. (Dollars in Millions, Except Per Share Data) 3 Months Ended % Q2 '12 Q2 '11 Change Net Revenue $105.5 $78.3 34.8% Gross Profit 53.9 42.6 26.6% % Margin 51.1% 54.4% A&P 13.1 8.3 58.7% % of Net Revenue 12.4% 10.5% G&A 8.8 8.1 9.4% % of Net Revenue 8.4% 10.3% Adjusted EBITDA * 32.0 26.2 21.8% % Margin 30.3% 33.5% Adjusted Net Income * $12.9 $11.4 13.5% Adjusted EPS * $0.26 $0.23 13.0% EPS - As Reported $0.26 $0.22 18.2%
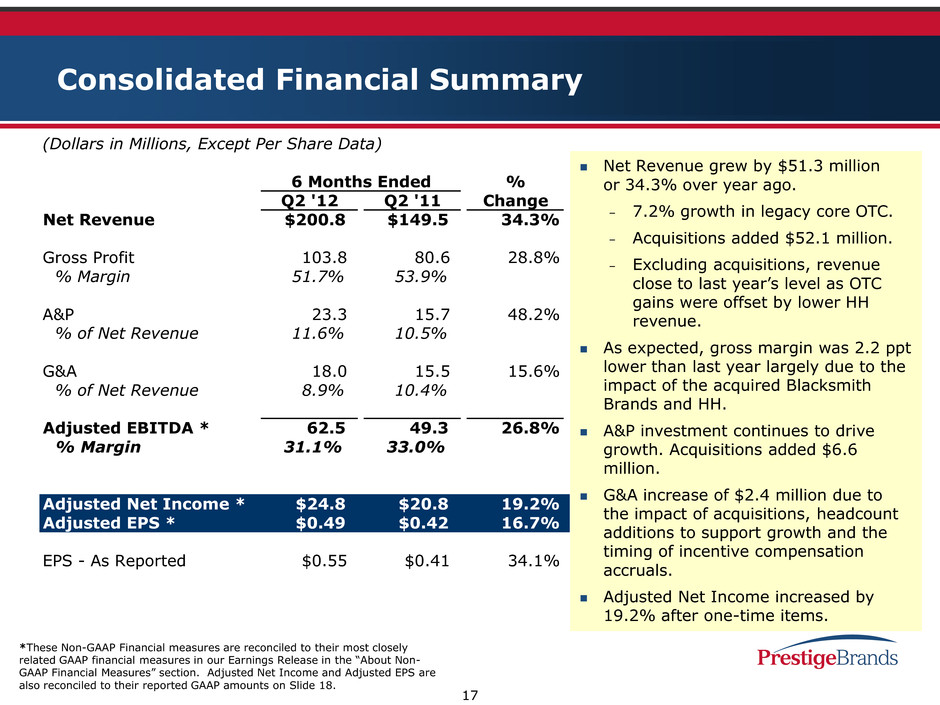
17 Consolidated Financial Summary Net Revenue grew by $51.3 million or 34.3% over year ago. – 7.2% growth in legacy core OTC. – Acquisitions added $52.1 million. – Excluding acquisitions, revenue close to last year‟s level as OTC gains were offset by lower HH revenue. As expected, gross margin was 2.2 ppt lower than last year largely due to the impact of the acquired Blacksmith Brands and HH. A&P investment continues to drive growth. Acquisitions added $6.6 million. G&A increase of $2.4 million due to the impact of acquisitions, headcount additions to support growth and the timing of incentive compensation accruals. Adjusted Net Income increased by 19.2% after one-time items. *These Non-GAAP Financial measures are reconciled to their most closely related GAAP financial measures in our Earnings Release in the “About Non- GAAP Financial Measures” section. Adjusted Net Income and Adjusted EPS are also reconciled to their reported GAAP amounts on Slide 18. (Dollars in Millions, Except Per Share Data) 6 Months Ended % Q2 '12 Q2 '11 Change Net Revenue $200.8 $149.5 34.3% Gross Profit 103.8 80.6 28.8% % Margin 51.7% 53.9% A&P 23.3 15.7 48.2% % of Net Revenue 11.6% 10.5% G&A 18.0 15.5 15.6% % of Net Revenue 8.9% 10.4% Adjusted EBITDA * 62.5 49.3 26.8% % Margin 31.1% 33.0% Adjusted Net Income * $24.8 $20.8 19.2% Adjusted EPS * $0.49 $0.42 16.7% EPS - As Rep rted $0.55 $0.41 34.1%

18 Net Income and EPS Reconciliation (Dollars in Millions, Except Per Share Data) 3 Months Ended 6 Months Ended Q2 FY 2012 Q2 FY 2012 Net Net Income EPS Income EPS Q2 FY 2012 Adjusted for One-Time Items * $12.9 $0.26 $24.8 $0.49 One-Time Adjustments: Lawsuit Settlement net of Professional Fees -- -- 4.3 0.09 Tax Impact of One-Time Adjustments -- -- (1.6) (0.03) Tax Rate Adjustment -- -- 0.2 0.00 Total One-Time Adjustments -- -- 2.9 0.06 Q2 FY 2012 As Reported $12.9 $0.26 $27.7 $0.55 *These Non-GAAP Financial measures are being reconciled to their reported GAAP amounts. For further information about Non-GAAP Financial Measures, refer to our Earnings Release in the “About Non-GAAP Financial Measures” section.

19 Q2 Segment Financial Summary OTC segment revenue grew 55.7% with legacy core OTC up 4.1% in Q2 behind dedicated A&P support. Acquisitions added $27.6 million. Household revenue declined 3.9% due to continued strong competitive pricing and a challenging retail environment. OTC Gross Margin declined due to the expected impact of the Blacksmith Brands acquisition. HH Gross Margin declined due to the lower revenue volume and higher promotional activity. A&P increased due to acquisitions and higher investment behind the Core OTC brands during the quarter. HH A&P was lower than the prior year due to timing of expenditures. (Dollars in Millions) 3 Months Ended OTC Household Total Net Revenue: Q2 '12 $79.1 $26.4 $105.5 Q2 '11 50.8 27.5 78.3 % Change 55.7% (3.9%) 34.8% Gross Profit: Q2 '12 46.1 7.8 53.9 % Margin 58.2% 29.7% 51.1% Q2 '11 33.0 9.6 42.6 % Margin 65.0% 34.8% 54.4% A&P: Q2 '12 12.2 0.9 13.1 Q2 '11 6.9 1.3 8.2 % Change 75.9% (30.9%) 58.7% Contribution: Q2 '12 33.9 6.9 40.8 Q2 '11 26.1 8.3 34.4 % Change 29.8% (15.9%) 18.9%

20 Fiscal Year to Date Segment Financial Summary OTC segment revenue grew 57.3% with legacy core OTC up 7.2% behind dedicated A&P support. Acquisitions added $52.1 million. Household revenue declined 6.5% due to continued strong competitive pricing and a challenging retail environment. OTC Gross Margin declined due to the expected impact of the Blacksmith Brands acquisition. HH Gross Margin declined due to the lower revenue volume and higher promotional activity. A&P increased due to acquisitions and higher investment behind the Core OTC brands during the quarter. HH A&P was lower than the prior year due to timing of expenditures. (Dollars in Millions) 6 Months Ended OTC Household Total Net Revenue: Q2 '12 $150.3 $50.5 $200.8 Q2 '11 95.5 54.0 149.5 % Change 57.3% (6.5%) 34.3% Gross Profit: Q2 '12 88.5 15.3 103.8 % Margin 58.9% 30.3% 51.7% Q2 '11 61.9 18.7 80.6 % Margin 64.8% 34.6% 53.9% A&P: Q2 '12 20.6 2.7 23.3 Q2 '11 12.1 3.7 15.8 % Change 70.4% (25.2%) 48.2% Contribution: Q2 '12 67.9 12.6 80.5 Q2 '11 49.8 15.0 64.8 % Change 36.3% (16.3%) 24.1%

21 Prestige Strength: Cash Flow from Operations Quarterly and Semi-annual cash flows are lower than last year due to the working capital build from higher sales volumes. Debt Profile & Covenant Compliance: Total Indebtedness at 9/30/11, $452 million, reflects a Q2 pay down of $17.0 million and $40.0 million for the year to date. The company is compliant with all covenant requirements. (Dollars in Millions) 3 Months Ended 6 Months Ended Q2 '12 Q2 '11 Q2 '12 Q2 '11 Net Income $12.9 $11.0 $27.7 $20.6 Depreciation & Amortization 2.6 2.5 5.1 5.1 Other Non-Cash Operating Items 4.1 5.3 8.7 9.0 Working Capital (1.6) 3.3 (8.0) 8.1 Cash Flow from Operations $18.0 $22.1 $33.5 $42.8

22 Well-Positioned for The Second Half of FY 2012 Strategic focus on core OTC brands will continue to drive future value creation Brand building investments lead to continued solid financial performance in the second half of F „12 A&P investments to increase during cough/cold season as usual Progress made, work continues on Household stabilization Strong balance sheet for this economic environment Cautiously optimistic for FY12 given economy, retail and consumer confidence, comparisons to last year‟s high-incident cough/cold season

23 Clear Roadmap for Value Creation Drive Core Organic Growth Exclusive OTC M&A Focus Strategic Portfolio Management

24
