Attached files
| file | filename |
|---|---|
| 8-K - FORM 8-K - NEWBRIDGE BANCORP | d253533d8k.htm |
 www.newbridgebank.com
NASDAQ: NBBC
Third Quarter 2011
Investor Presentation
Exhibit 99.1 |
 Forward Looking Statements
2
Information in this presentation may contain forward looking statements. Such
statements involve known and unknown risks, uncertainties and other factors
that may cause actual results to differ materially. Forward looking
statements are often characterized by the use of qualifying words such as “expects,”
“anticipates,” “believes,” “estimates,” “plans,”
“projects,” or other statements concerning opinions or judgments of the
Company and its management about future events. The accuracy of such
forward looking statements could be affected by factors including, but not limited
to, the financial success or changing conditions or strategies of the Company’s
customers or vendors, fluctuations in interest rates, actions of government
regulators, the availability of capital and personnel, or general economic
conditions. Additional factors are discussed in the Company’s filings with the
SEC, including without limitation, Forms 10-K, 10-Q and 8-K. NewBridge Bancorp
undertakes no obligations to revise these statements following the date of this presentation. |
 Table
of Contents NBBC Overview
Recent Performance
Loan Portfolio Analysis
Outlook and Summary
3 |
 Corporate Profile
•
Headquarters:
Greensboro, NC
•
Ticker:
NBBC
•
Assets:
$1.7 billion
•
Branch locations:
30
•
Tangible book:
$6.91 per share
•
Price to tangible book:
56%
•
Common equity to assets:
6.36%
•
Risk weighted capital:
14.63%
As of September 30, 2011.
4 |
 Corporate Profile
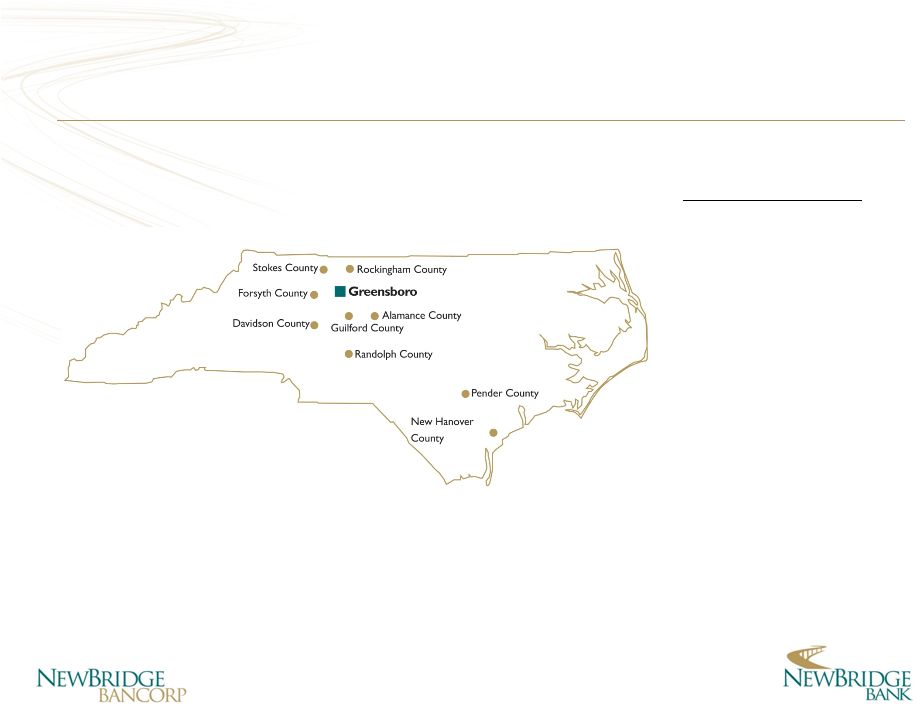
Branch Locations
Triad Branches
27
Coastal Branches
3
TOTAL
30
5 |
 Background
•
NewBridge Bancorp formed July 2007 from a merger of equals
–
Two mature franchises in NC’s third largest MSA
–
Strong core deposits with an opportunity to expand market share
•
New management team overcoming challenges
–
Legacy organizations lacked uniform credit culture and defined
performance culture
–
Bank locations were not positioned to serve the financial districts
of the MSA
–
Largest market share competitor experienced a liquidity crisis
6 |
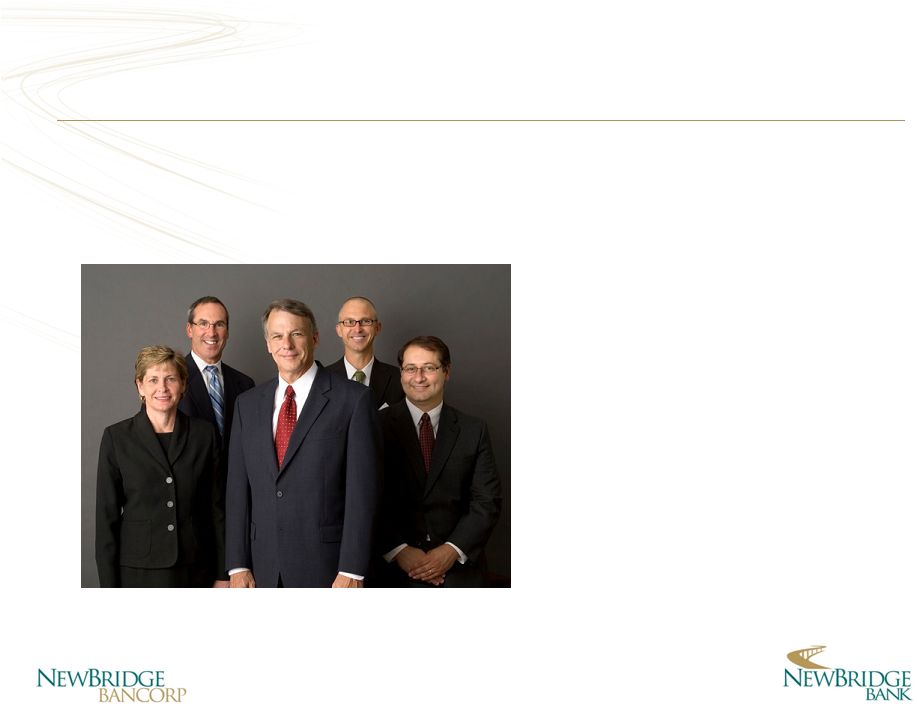 Leadership
•
LIVING
our Guiding Principles
•
FOCUSING
on our Vision and Mission
•
EXECUTING
our Strategic, Operating and Profit Plans
Pressley A. Ridgill, CPA, CFP
®
(59)
President and Chief Executive Officer
35 years of banking and financial services experience
Ramsey K. Hamadi, CPA, MBA (42)
Executive Vice President and Chief Financial Officer
20 years of banking and financial services experience
David P. Barksdale (47)
Executive Vice President and Chief Banking Officer
20 years of banking experience
William W. Budd, Jr. (48)
Executive Vice President and Chief Credit Officer
25 years of banking experience
Robin S. Hager (49)
Executive Vice President and Chief Resource Officer
26 years of banking experience
Pictured (from left to right): Robin Hager, Wes Budd, Pressley Ridgill (center),
David Barksdale and Ramsey Hamadi.
7 |
 Significant Accomplishments
•
Profitable in each of the last eight quarters
•
Charged off $134 million, or 8.3%, of peak level loans and OREO
•
Reduced branches from 42 to 30
•
Reduced staff from 690 to 437
•
Eliminated $14 million of annualized costs
•
Increased core deposits from 55% to 71%
•
Improved asset liability management practices resulting in more than
a 120 basis point improvement in NIM
•
Developed robust risk management policies and procedures
8 |
 Table
of Contents NBBC Overview
Recent Performance
Loan Portfolio Analysis
Outlook and Summary
9 |
 Q3
2011 Results •
The Company reported net income of $1.1 million in the third quarter, and
$3.2 million year to date
•
Pre-tax income improved 38% over the prior year third quarter; 74% for the
year
•
Net interest margin improved, and averaged 4.20% for the quarter
and
4.21% for the year
•
Nonperforming assets were down 5% from Q2 2011 and 19% from peak
level
•
Non-accruing loans were down 8% for the quarter to $36.3 million
•
Total risk based capital remains strong at 14.63%
•
Core deposits grew 7% for the year
•
Noninterest expense declined $2.3 million year to date
•
Added three new loan production offices and seven senior level lenders
10 |
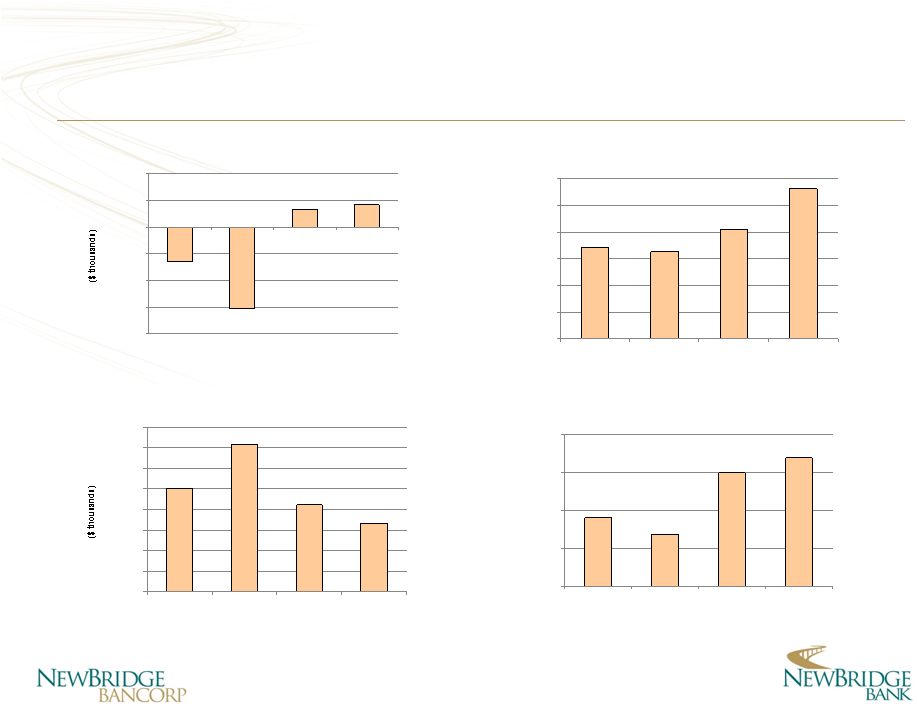  Trends
Net Interest Margin
(at year end, except as noted below)
*as of September 30
Total Risk Based Capital
(at year end, except as noted below)
*as of September 30
11
9.00%
10.00%
11.00%
12.00%
13.00%
14.00%
15.00%
2008
2009
2010
2011*
2.50%
3.00%
3.50%
4.00%
4.50%
2008
2009
2010
2011*
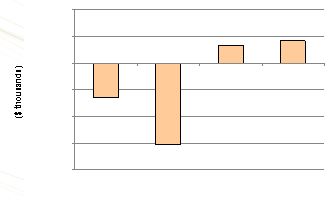
($20,000)
($15,000)
($10,000)
($5,000)
$0
$5,000
$10,000
2008*
2009
2010
2011**
$0
$5,000
$10,000
$15,000
$20,000
$25,000
$30,000
$35,000
$40,000
2008
2009
2010
2011*
Provision for Credit Losses
*excluding write-off of goodwill
**annualized
Net Income
*annualized |
 Managing Net Interest Margin
•
NIM increased to 4.20%
•
Maintained disciplined loan pricing strategies
–
Interest rate floors, pricing on yield curve
–
Courage and confidence to price according to risk
•
Continued our core deposit relationship strategies
–
Core deposits total 71% of deposits
–
Deposit costs decreased 32 basis points from prior year third
quarter to 0.71%
–
Core deposits grew 7% for the year
•
Improved asset liability management practices
12 |
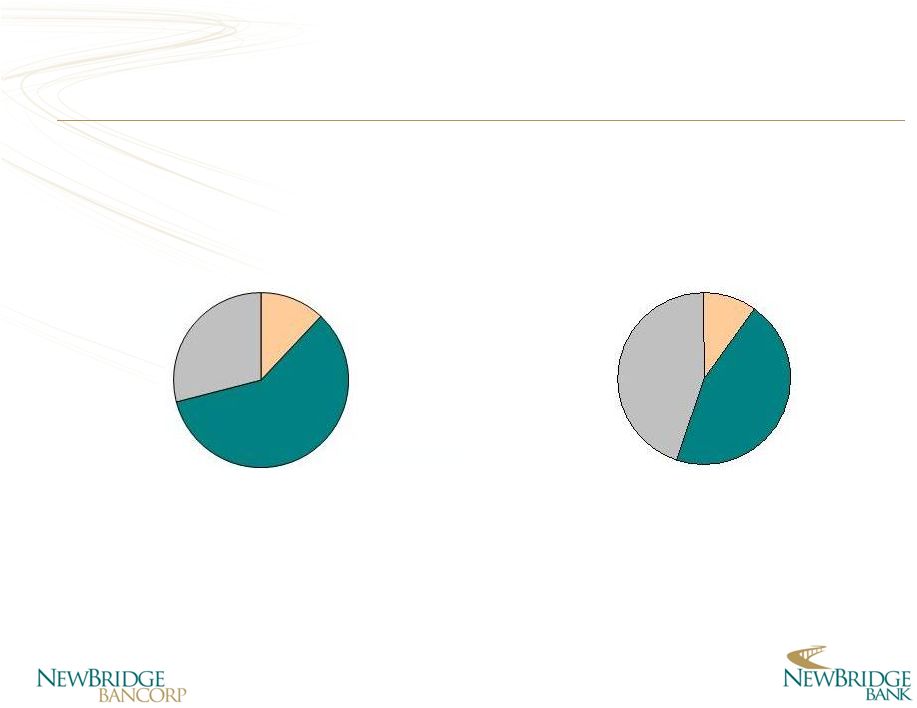 Growing Core Deposits
13
DDA
12%
NOW,
Savings &
Money
Market
59%
Time
Deposits
29%
September 2011
December 2009
Time
Deposits
45%
DDA
10%
NOW,
Savings &
Money Market
45% |
 Non-Interest Income
•
Wealth Management, Mortgage Banking and Private Banking
•
Investment and Trust Services restructured to become Wealth
Management
–
Addition of new wealth management professionals (March 2011)
–
Growth of $65 million in Trust assets, or 85%, since last year
–
Investment Services revenues increased 8% over prior year
•
Bradford Mortgage acquisition resulting in an efficient mortgage
company
•
Growth in mortgage revenue and wealth management have largely
offset declines in deposit fee income
•
Private Banking initiative launched (late 2009)
14 |
 Controlling Non-Interest Expense
•
Annual non-interest expense has declined $14 million since merger
•
Implemented disciplined Profit Plan accountability
•
2011 operating expense declined $2.8 million through September
•
Lowered 2010 non-interest expense $5.0 million
•
Franchise Validation Plan developed and implemented
–
Reduced branches from 42 at merger to 30
–
Reduced staff from 690 at merger to 437, including 30 in the third
quarter of 2011
–
Opened new LPOs in Raleigh, Asheboro and Morganton, NC
–
Recently completed third-party review to improve efficiency
15 |
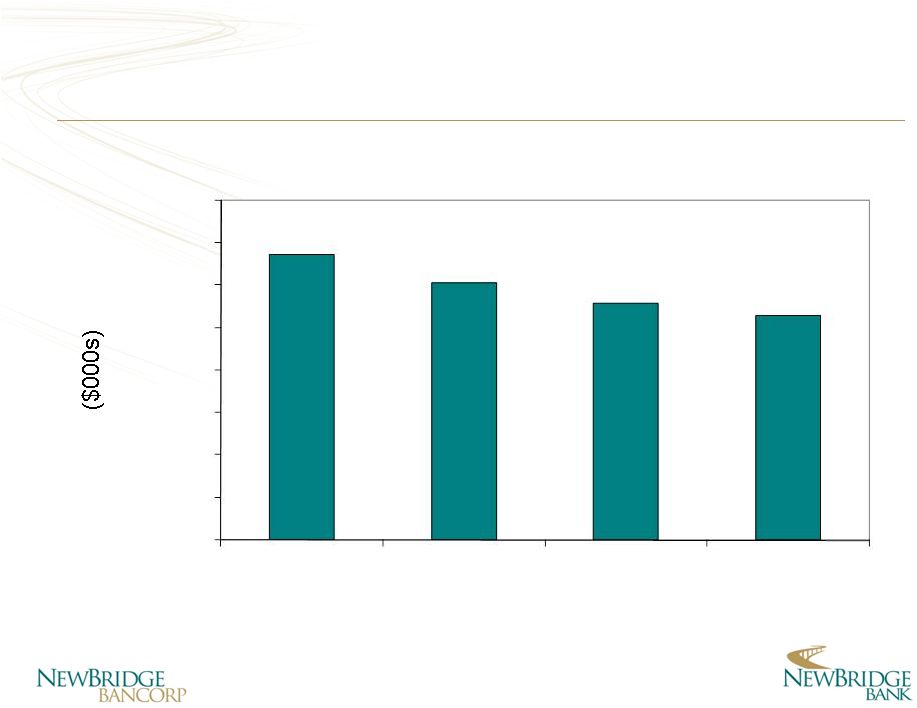 Reduce Non-Interest Expense
16
$0
$10,000
$20,000
$30,000
$40,000
$50,000
$60,000
$70,000
$80,000
2008
2009
2010
3Q 2011
(Annualized)
$14 million in
annual cost
saves since
merger |
 Table
of Contents NBBC Overview
Recent Performance
Loan Portfolio Analysis
Outlook and Summary
17 |
 Improving Asset Quality
Nonperforming loans, net of TDRs, declined 53% from June 2009 peak
NPAs and past dues peaked in February 2010
30-89 day past dues are down 21% since December 2010
AD&C portfolio has contracted $70 million, or 50%, year over year
NBBC is materially below the FFIEC high CRE concentration definition
Texas Ratio*:
57% at March 2011
54% at June 30, 2011
51% at September 30, 2011
*Texas ratio equals nonperforming assets divided by the sum of tangible common
equity and allowance for credit losses. 18 |
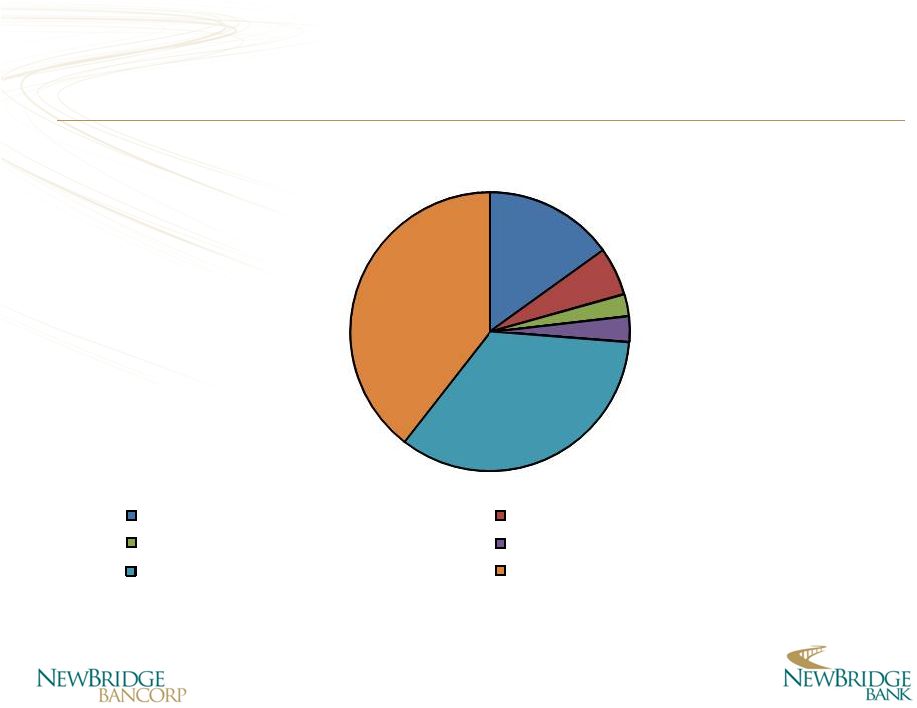 Loan
Composition *Includes owner occupied R/E of $229.0 million.
September 30, 2011
19
15%
6%
3%
3%
34
%*
39%
Commercial Income Producing
Rental 1-4
Commercial Const. and A&D/Raw Land
Residential Const. and Lots/A&D
C and I*
Consumer |
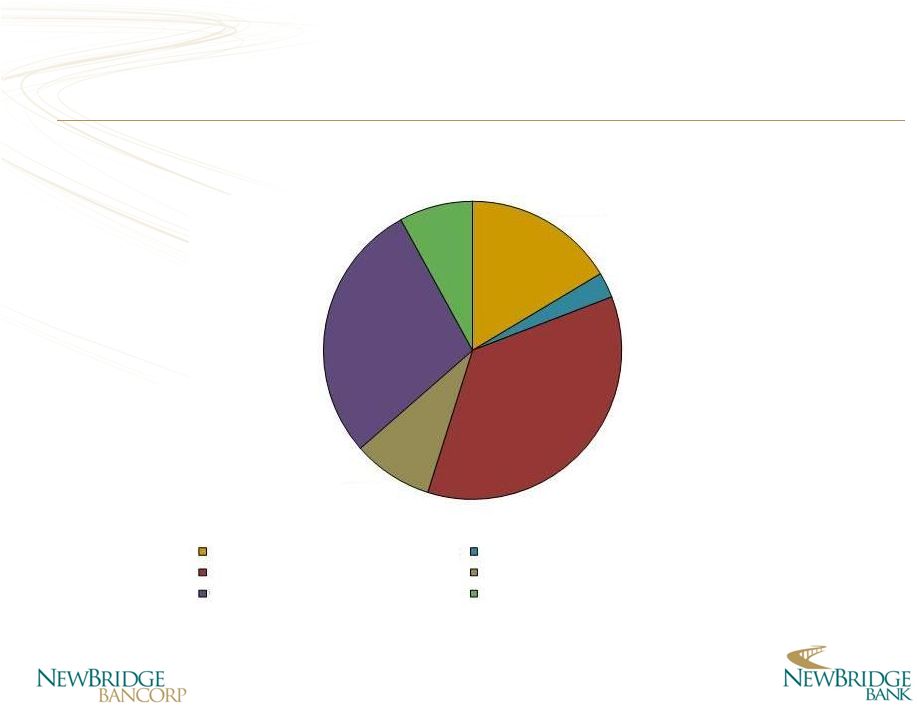 $11.3
$1.9
$24.6
$6.0
$19.6
$5.5
Residential
Construction
-
Pre
Sold
Residential A&D
Commercial Construction
Commercial Raw Land
Acquisition
&
Development
-
Commercial
AD&C Portfolio Mix
($ in millions)
Total AD&C Portfolio: $68.9 million
September 30, 2011
20
Residential
Construction
-
Builder
Spec |
 $18.8
$3.8
$18.9
$12.1
$55.4
$35.7
$28.8
$13.1
Residential rental
C-store
Hotel/motel
Industrial
Office
Retail
Special purpose/other
Restaurant
Income Producing CRE by Collateral Type
($ in millions)
Total Including Producing Portfolio: $186.6 million
September 30, 2011
21 |
 Nonperforming Asset Trends
Nonaccruing Loans, TDR and OREO
22
$15
$25
$35
$45
$55
$65
$75
$85
$95
Q2 09
Q3 09
Q4 09
Q1 10
Q2 10
Q3 10
Q4 10
Q1 11
Q2 11
Q3 11
Nonaccruing loans
Troubled debt restructured loans
OREO |
 23
Nonperforming Asset Trends
Troubled Debt Restructured Loans
$0
$5
$10
$15
$20
$25
Q2 09
Q3 09
Q4 09
Q1 10
Q2 10
Q3 10
Q4 10
Q1 11
Q2 11
Q3 11
Accruing
Non
Accruing
- |
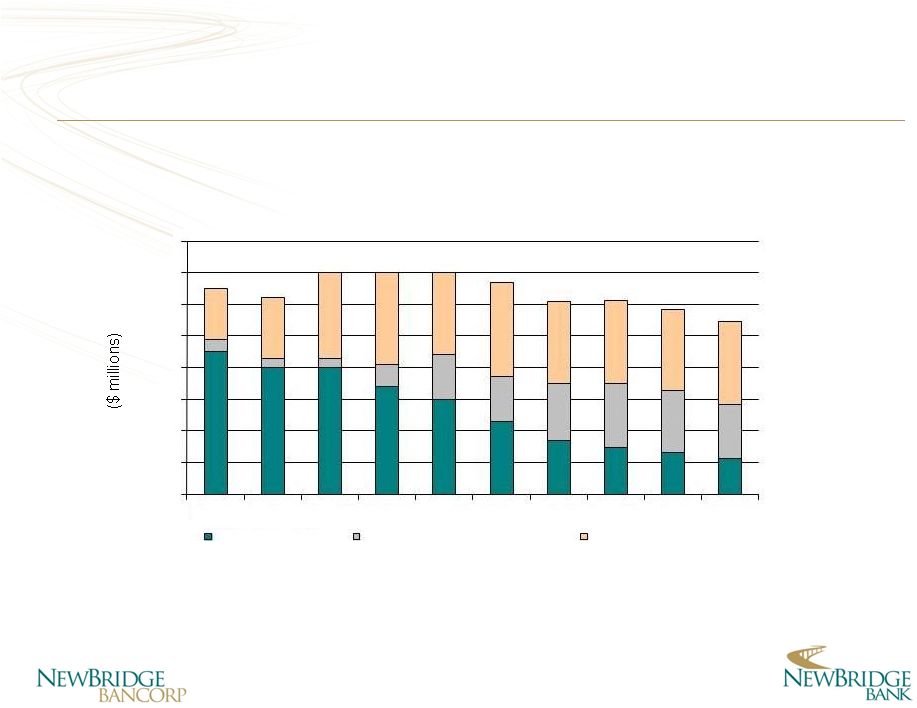
 Impaired and Potential Problem Loans
24
*(Total Classified Assets + OREO) divided by (Tier 1 Capital + ALLL)
September 30, 2011
June 30, 2011
March 31, 2011
Loans evaluated for impairment
33,827
$
37,483
$
36,497
$
38,303
$
Other nonperforming loans
9,635
10,197
13,489
12,282
Total nonperforming loans
43,462
47,680
49,986
50,585
Other potential problem loans
93,459
97,141
96,509
110,924
136,921
$
144,821
$
146,495
$
161,509
$
Classified asset ratio*
80%
84%
86%
94%
Total impaired and potential problem loans
December 31, 2010 |
 Migration of Potential Problem Loans
Substandard
Doubtful
25
$0
$100
$120
$140
1 10
2 10
Q3 10
4 10
1 11
2 11
3 11
Q
Q
Q
Q
Q
Q
$0
$25
$30
Q1 10
Q2 10
Q3 10
Q4 10
Q1 11
Q2 11
Q3 11
$20
$20
$40
$60
$80
$5
$10
$15
$160 |
 ALLL
Analysis •
Charged off $134 million of loans and OREO since 2007
•
Impaired loans have a 23% mark as of Q3 2011
•
ALLL to retained loans is 2.27% as of Q3 2011
–
UBPR
Peer
percentage
–
2.10%
•
94% of ALLL is in general reserves
•
$27.8 million ALLL covers annualized charge-offs by 1.56x
26 |
 Risk
Management Infrastructure •
Internal loan review reports to Board Credit Committee
•
External loan review engaged by Board Credit Committee
•
Appraisal/valuation function is independent from production
•
Centralized construction administration
•
Centralized retail and small business underwriting
•
Loan concentration guidelines by market and product
27 |
 Table
of Contents NBBC Overview
Recent Performance
Loan Portfolio Analysis
Outlook and Summary
28 |
 Outlook
•
Remain profitable as credit related costs expected to decline
•
Net interest margin stable above 4%
•
Credit improvement has relieved pressure to raise capital
–
The Company is exploring a partial repayment of TARP
–
Time
will
provide
investors
with
greater
clarity
regarding
value
of
NBBC
–
Strategic acquisitions could necessitate capital raise
•
Measured investment in profitable business lines
•
Continued focus on cost management culture
•
Prepared to be an opportunistic/strategic acquirer
•
Bolstered loan demand through added LPO offices
29 |
 Summary
•
Thriving community bank with critical mass
•
Improving asset quality
•
Gaining core deposit share in an attractive MSA
•
Experienced management team
•
No immediate capital needs
•
Pursuing organic growth and expansion through LPO’s/acquisition
•
Trading at a discount to tangible book value
•
Disciplined acquirer
30 |
 www.newbridgebank.com
NASDAQ: NBBC
Third Quarter 2011
Investor Presentation |