Attached files
| file | filename |
|---|---|
| 8-K - HAMPDEN BANCORP, INC. 8-K - Hampden Bancorp, Inc. | a50061873.htm |
| EX-99.1 - EXHIBIT 99.1 - Hampden Bancorp, Inc. | a50061873ex99_1.htm |
Exhibit 99.2
Hampden Bancorp, Inc. Thomas R. Burton, CPA President and Chief Executive Officer Robert A. Massey Chief Financial Officer, Senior Vice President and Treasurer Sandler O’Neill + Partners November 10th, 2011 www.hampdenbank.com NASDAQ: HBNK
2 Forward-Looking Statements Certain statements herein constitute “forward-looking statements” within the meaning of the Private Securities Litigation Reform Act of 1995. These statements are based on the beliefs and expectations of management as well as the assumptions made using information available to management. Because these statements reflect the views of management concerning future events, these statements involve risks, uncertainties and assumptions. As a result, actual results may differ from those contemplated by these statements. Forward-looking statements can be identified by the fact that they do not relate strictly to historical or current facts. They often include words like “believe”, “expect”, “anticipate”, “estimate”, and “intend” or future or conditional verbs such as “will”, “would”, “should”, “could”, or “may.” Certain factors that could have a material adverse affect on the operations of the Bank include, but are not limited to, increased competitive pressure among financial service companies, national and regional economic rates, changes in consumer spending, borrowing and conditions, changes in interest savings habits, legislative and regulatory changes, adverse changes in the securities markets, inability of key third-party providers to perform their obligations to Hampden Bank, changes in relevant accounting principles and guidelines and our ability to successfully implement our branch expansion strategy. Additionally, other risks and uncertainties are described in the Company’s Annual Report on Form 10-K filed with the Securities and Exchange Commission (the “SEC”) which is available through the SEC’s website at www.sec.gov. These risks and uncertainties should be considered in evaluating forward-looking statements and undue reliance should not be placed on such statements. Readers are cautioned not to place undue reliance on these forward-looking statements, which speak only as of the date of this report. The Company disclaims any intent or obligation to update any forward-looking statements, whether in response to new information, future events or otherwise.
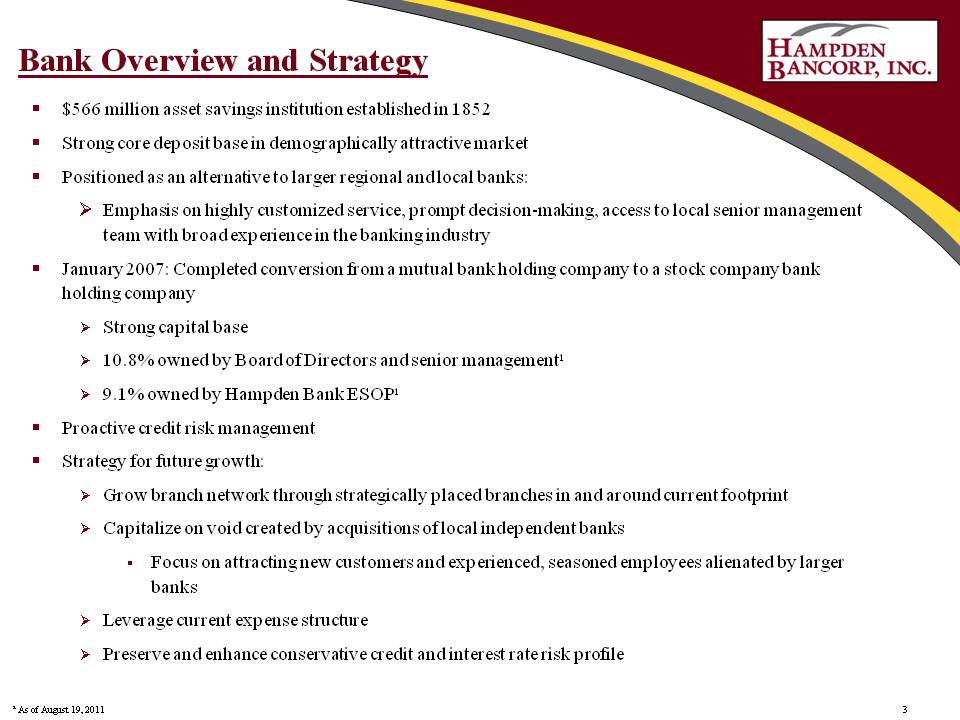
3 Bank Overview and Strategy 566 million asset savings institution established in 1852 Strong core deposit base in demographically attractive market Positioned as an alternative to larger regional and local banks: Emphasis on highly customized service, prompt decision-making, access to local senior management team with broad experience in the banking industry January 2007: Completed conversion from a mutual bank holding company to a stock company bank holding company Strong capital base 10.8% owned by Board of Directors and senior management¹ 9.1% owned by Hampden Bank ESOP¹ Proactive credit risk management Strategy for future growth: Grow branch network through strategically placed branches in and around current footprint Capitalize on void created by acquisitions of local independent banks Focus on attracting new customers and experienced, seasoned employees alienated by larger banks Leverage current expense structure Preserve and enhance conservative credit and interest rate risk profile ¹ As of August 19, 2011
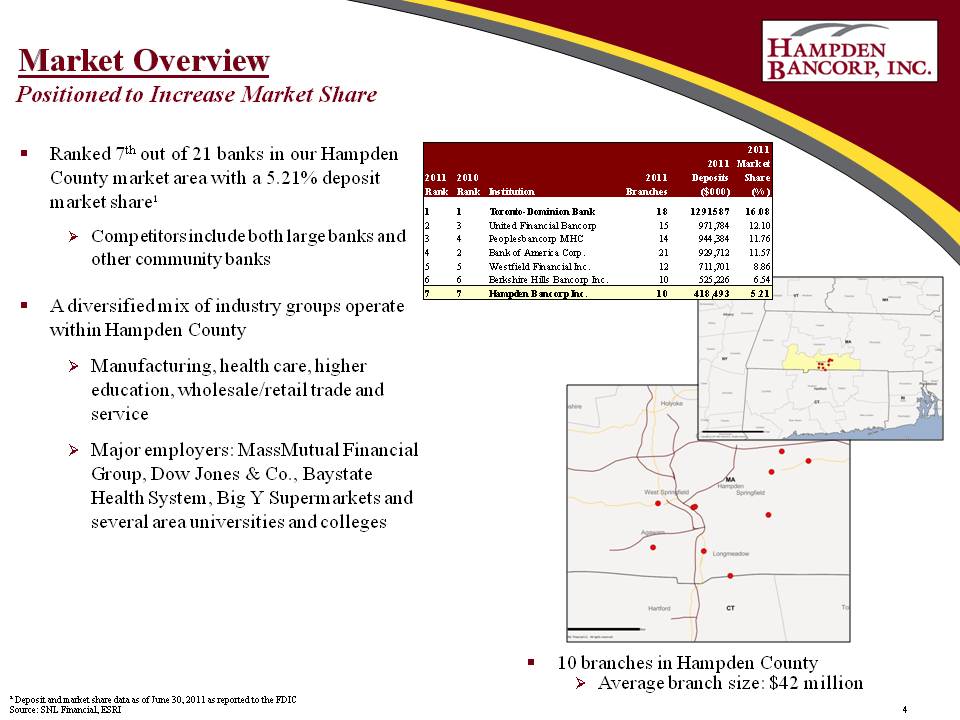
4 Market Overview Positioned to Increase Market Share Ranked 7th out of 21 banks in our Hampden County market area with a 5.21% deposit market share¹ Competitors include both large banks and other community banks A diversified mix of industry groups operate within Hampden County 2011 Rank 2010 Rank Institution 2011 Branches 2011 Deposits ($000) 2011 Market Share (%) 1 1 Toronto-Dominion Bank 18 1291587 16.08 2 3 United Financial Bancorp 15 971,784 12.10 3 4 Peoplesbancorp MHC 14 944,384 11.76 4 2 Bank of America Corp. 21 929,712 11.57 5 5 Westfield Financial Inc. 12 711,701 8.86 6 6 Berkshire Hills Bancorp Inc. 10 525,226 6.54 7 7 Hampden Bancorp Inc. 10 418,493 5.21 Manufacturing, health care, higher education, wholesale/retail trade and service Major employers: MassMutual Financial Group, Dow Jones & Co., Baystate Health System, Big Y Supermarkets and several area universities and colleges 10 branches in Hampden County Average branch size: $42 million ¹ Deposit and market share data as of June 30, 2011 as reported to the FDIC Source: SNL Financial, ESRI
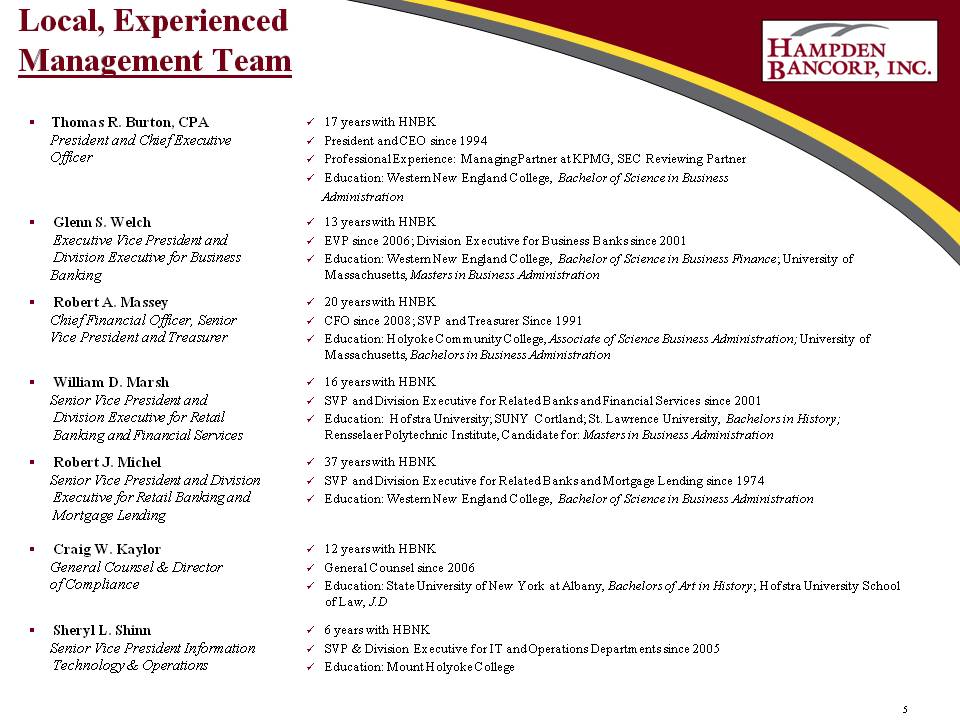
5 Local, Experienced Management Team Thomas R. Burton, CPA President and Chief Executive Officer 17 years with HNBK President and CEO since 1994 Professional Experience: Managing Partner at KPMG, SEC Reviewing Partner Education: Western New England College, Bachelor of Science in Business Administration Glenn S. Welch Executive Vice President and Division Executive for Business Banking 13 years with HNBK EVP since 2006; Division Executive for Business Banks since 2001 Education: Western New England College, Bachelor of Science in Business Finance; University of Massachusetts, Masters in Business Administration Robert A. Massey Chief Financial Officer, Senior Vice President and Treasurer 20 years with HNBK CFO since 2008; SVP and Treasurer Since 1991 Education: Holyoke Community College, Associate of Science Business Administration; University of Massachusetts, Bachelors in Business Administration William D. Marsh Senior Vice President and Division Executive for Retail Banking and Financial Services 16 years with HBNK SVP and Division Executive for Related Banks and Financial Services since 2001 Education: Hofstra University; SUNY Cortland; St. Lawrence University, Bachelors in History; Rensselaer Polytechnic Institute, Candidate for: Masters in Business Administration Robert J. Michel Senior Vice President and Division Executive for Retail Banking and Mortgage Lending 37 years with HBNK SVP and Division Executive for Related Banks and Mortgage Lending since 1974 Education: Western New England College, Bachelor of Science in Business Administration Craig W. Kaylor General Counsel & Director of Compliance 12 years with HBNK General Counsel since 2006 Education: State University of New York at Albany, Bachelors of Art in History; Hofstra University School of Law, J.D Sheryl L. Shinn Senior Vice President Information Technology & Operations 6 years with HBNK SVP & Division Executive for IT and Operations Departments since 2005 Education: Mount Holyoke College
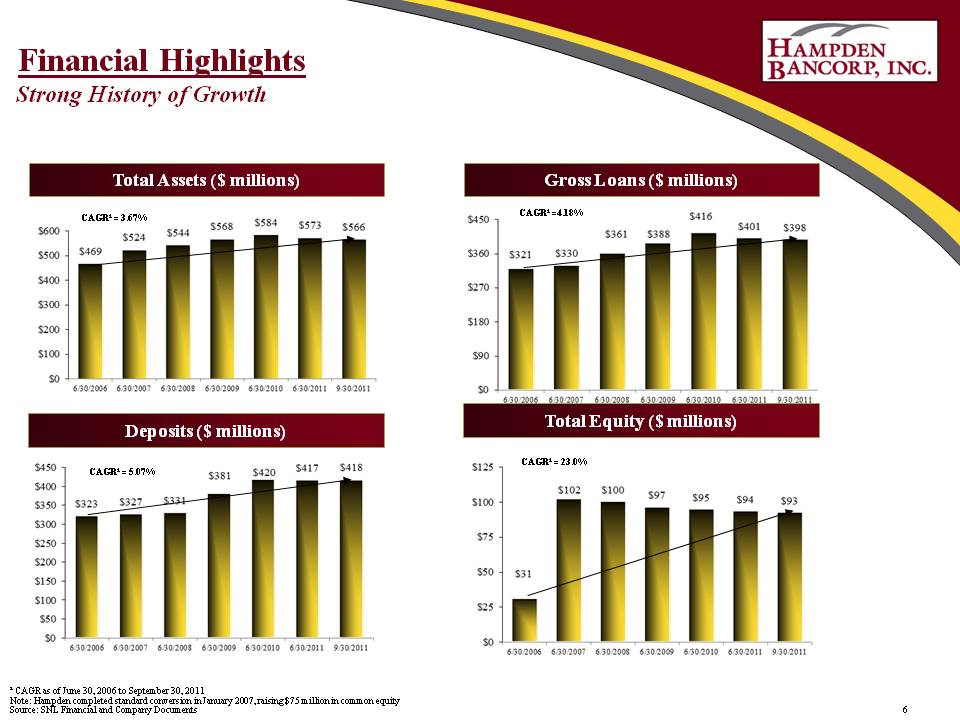
6 Financial Highlights Strong History of Growth CAGR¹ = 3.67% CAGR¹ =4.18% CAGR¹ = 5.07% CAGR¹ = 23.0% ¹ CAGR as of June 30, 2006 to September 30, 2011 Note: Hampden completed standard conversion in January 2007, raising $75 million in common equity Source: SNL Financial and Company Documents
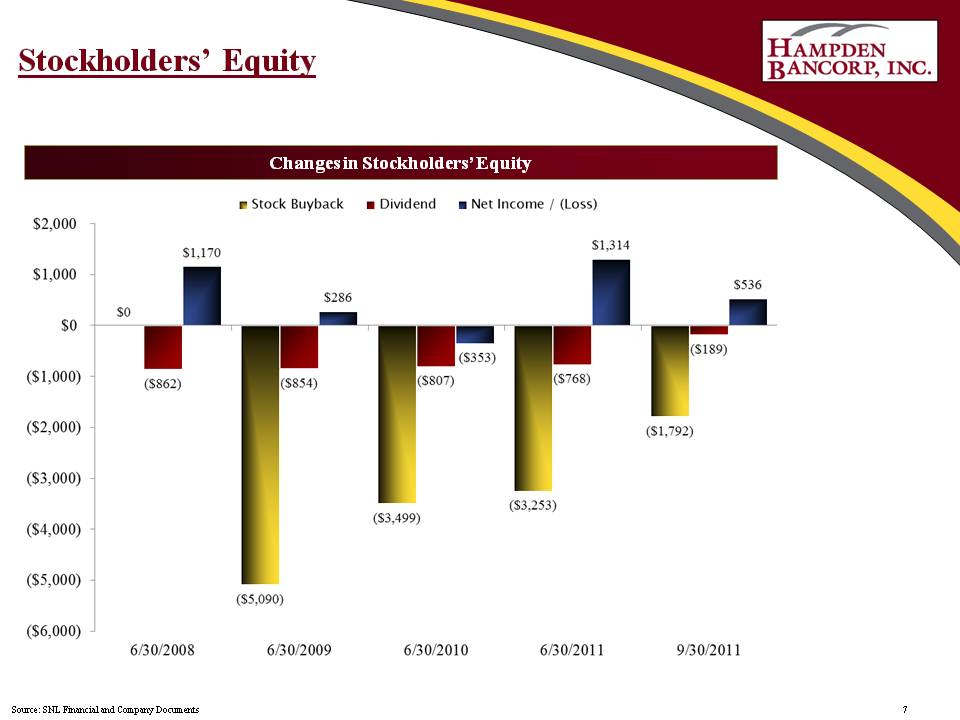
7 Stockholders’ Equity Stock Buyback Dividend Net Income / (Loss) $2,000 $1,000 $0 ($1,000) ($2,000) ($3,000) ($4,000) ($5,000) ($6,000) 6/30/2008 6/30/2009 6/30/2010 6/30/2011 9/30/2011 $0 ($862) $1,170 ($5,090) ($854) $286 ($3,499) ($807) ($353) ($3,253) ($768) $1,314 ($1,792) ($189) $536 Source: SNL Financial and Company Documents
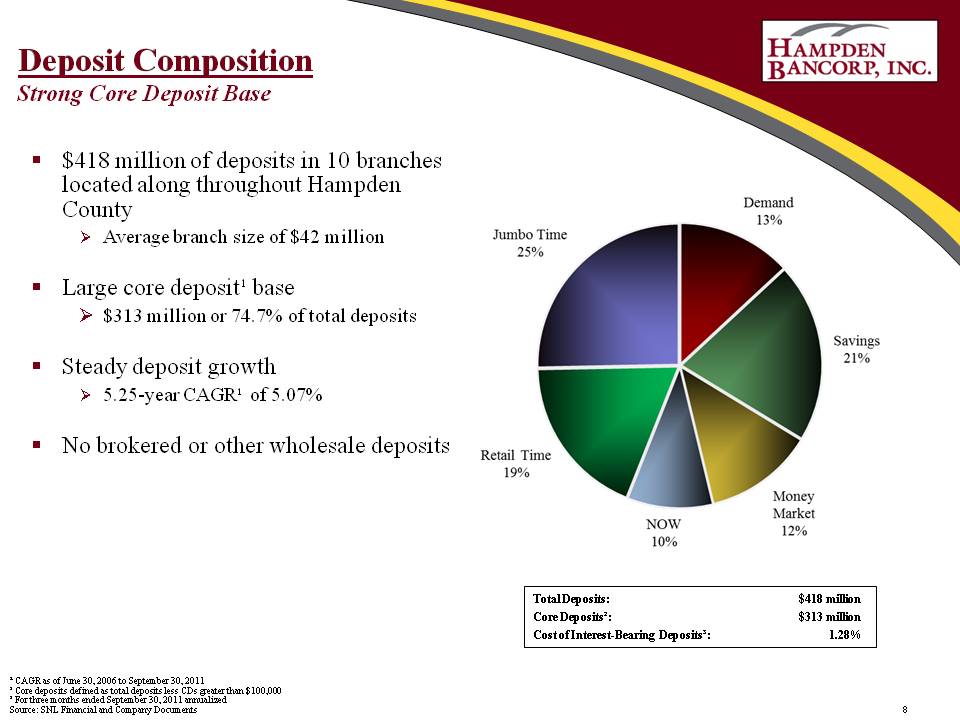
8 Deposit Composition Strong Core Deposit Base $418 million of deposits in 10 branches located along throughout Hampden County Average branch size of $42 million Large core deposit¹ base $ 313 million or 74.7% of total deposits Steady deposit growth 5.25-year CAGR¹ of 5.07% No brokered or other wholesale deposits Jumbo Time 25% Retail Time 19% Demand 13% Savings 21% Money Market 12% NOW 10% Total Deposits: $418 million Core Deposits²: $313 million Cost of Interest-Bearing Deposits³: 1.28% ¹ CAGR as of June 30, 2006 to September 30, 2011 ² Core deposits defined as total deposits less CDs greater than $100,000 ³ For three months ended September 30, 2011 annualized Source: SNL Financial and Company Documents
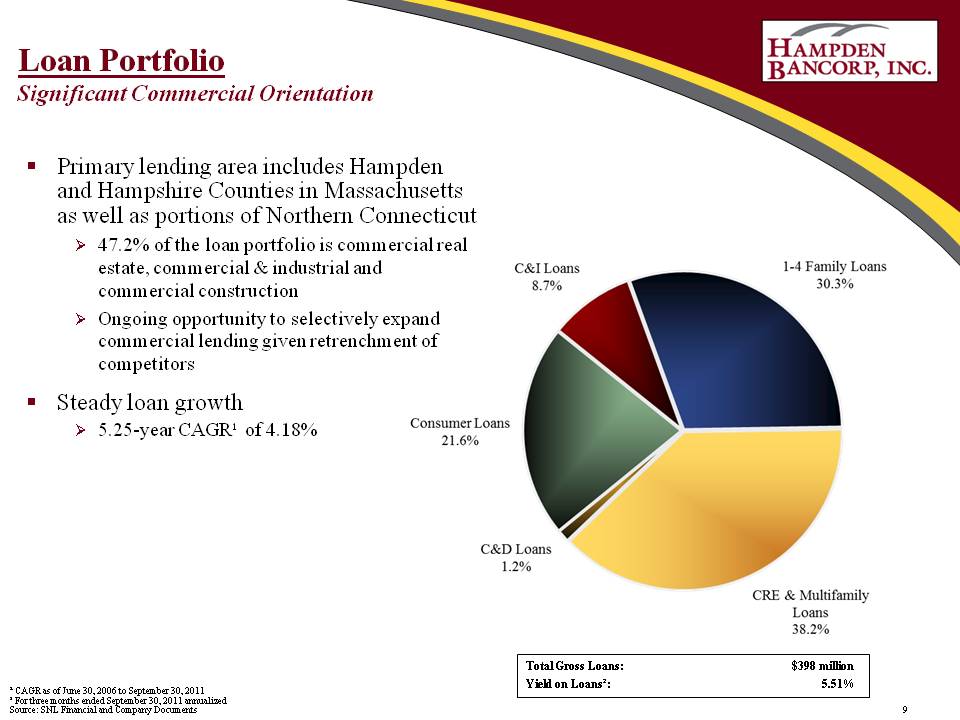
9 Loan Portfolio Significant Commercial Orientation Primary lending area includes Hampden and Hampshire Counties in Massachusetts as well as portions of Northern Connecticut 47.2% of the loan portfolio is commercial real estate, commercial & industrial and commercial construction Ongoing opportunity to selectively expand commercial lending given retrenchment of competitors Steady loan growth 5.25-year CAGR¹ of 4.18% 1-4 Family Loans 30.3% CRE & Multifamily Loans 38.2% C&D Loans 1.2% Consumer Loans 21.6% C&I Loans 8.7% Total Gross Loans: $398 million Yield on Loans²: 5.51% ¹ CAGR as of June 30, 2006 to September 30, 2011 ² For three months ended September 30, 2011 annualized Source: SNL Financial and Company Documents
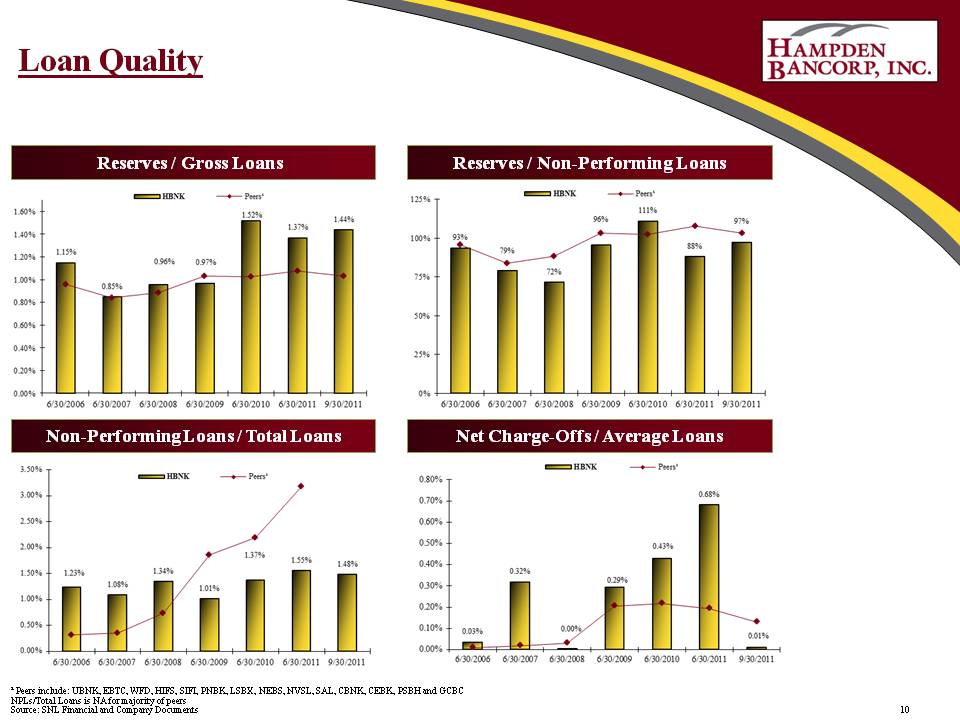
10 Loan Quality ¹ Peers include: UBNK, EBTC, WFD, HIFS, SIFI, PNBK, LSBX, NEBS, NVSL, SAL, CBNK, CEBK, PSBH and GCBC NPLs/Total Loans is NA for majority of peers Source: SNL Financial and Company Documents
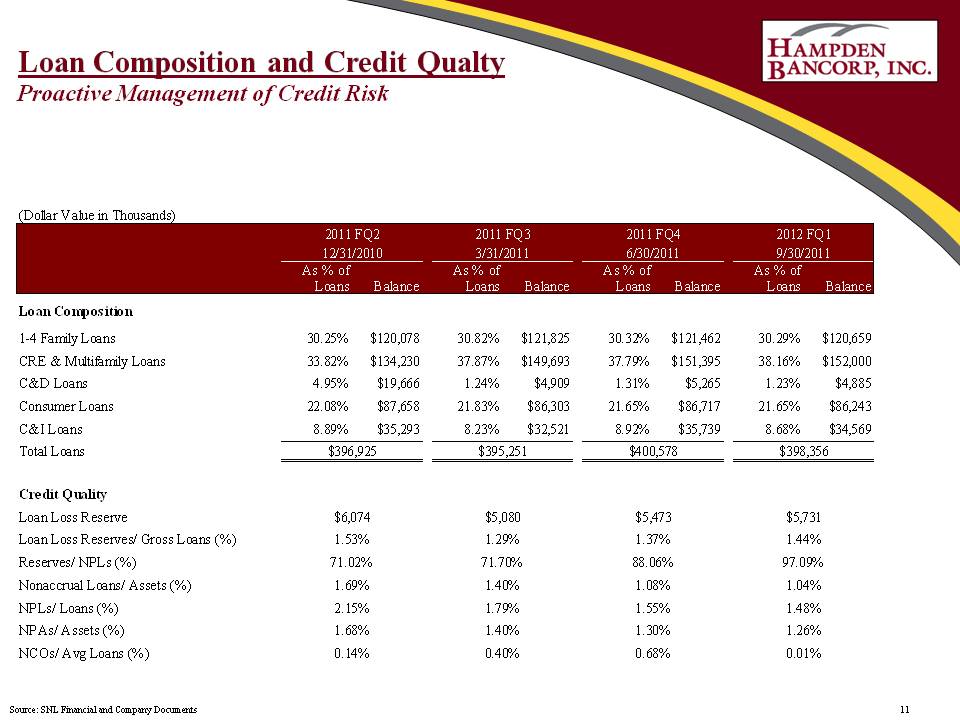
11 Loan Composition and Credit Qualty Proactive Management of Credit Risk (Dollar Value in Thousands) 2011 FQ2 2011 FQ3 2011 FQ4 2012 FQ1 12/31/2010 3/31/2011 6/30/2011 9/30/2011 As % of As % of As % of As % of Loans Balance Loans Balance Loans Balance Loans Balance Loan Composition 1-4 Family Loans 30.25% $120,078 30.82% $121,825 30.32% $121,462 30.29% $120,659 CRE & Multifamily Loans 33.82% $134,230 37.87% $149,693 37.79% $151,395 38.16% $152,000 C&D Loans 4.95% $19,666 1.24% $4,909 1.31% $5,265 1.23% $4,885 Consumer Loans 22.08% $87,658 21.83% $86,303 21.65% $86,717 21.65% $86,243 C&I Loans 8.89% $35,293 8.23% $32,521 8.92% $35,739 8.68% $34,569 Total Loans $396,925 $395,251 $400,578 $398,356 Credit Quality Loan Loss Reserve $6,074 $5,080 $5,473 $5,731 Loan Loss Reserves/ Gross Loans (%) 1.53% 1.29% 1.37% 1.44% Reserves/ NPLs (%) 71.02% 71.70% 88.06% 97.09% Nonaccrual Loans/ Assets (%) 1.69% 1.40% 1.08% 1.04% NPLs/ Loans (%) 2.15% 1.79% 1.55% 1.48% NPAs/ Assets (%) 1.68% 1.40% 1.30% 1.26% NCOs/ Avg Loans (%) 0.14% 0.40% 0.68% 0.01% Source: SNL Financial and Company Documents
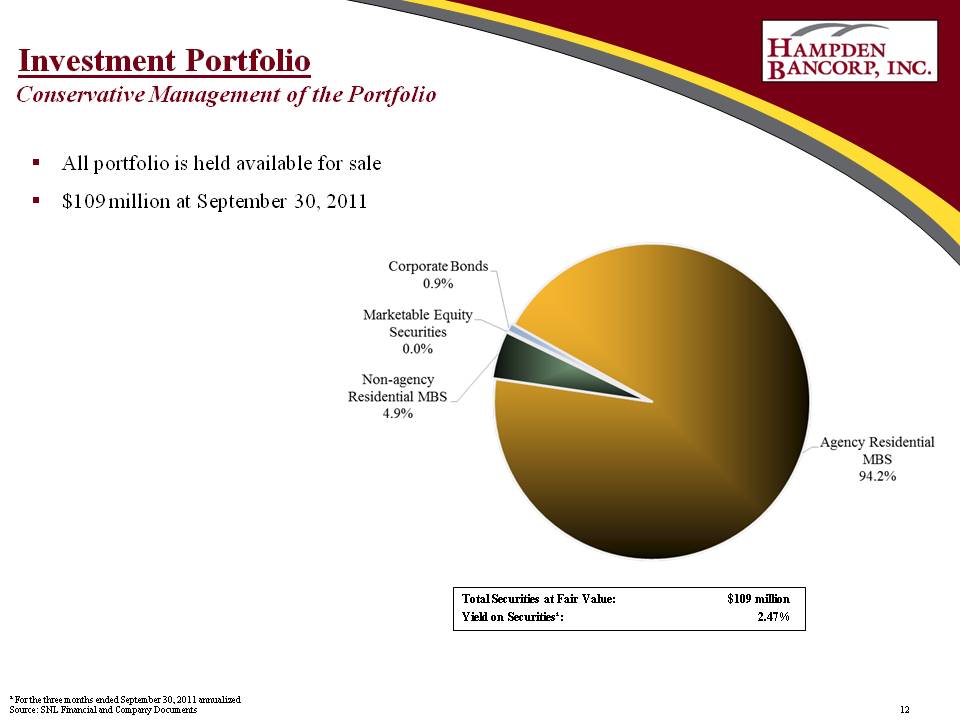
12 Investment Portfolio Conservative Management of the Portfolio All portfolio is held available for sale $109 million at September 30 2011 Corporate Bonds 0.9% Marketable Equity Securities 0.0% Non-agency Residential MBS 4.9% Agency Residential MBS 94.2% Total Securities at Fair Value: $109 million Yield on Securities¹: 2 47% ¹ For the three months ended September 30, 2011 annualized Source: SNL Financial and Company Documents
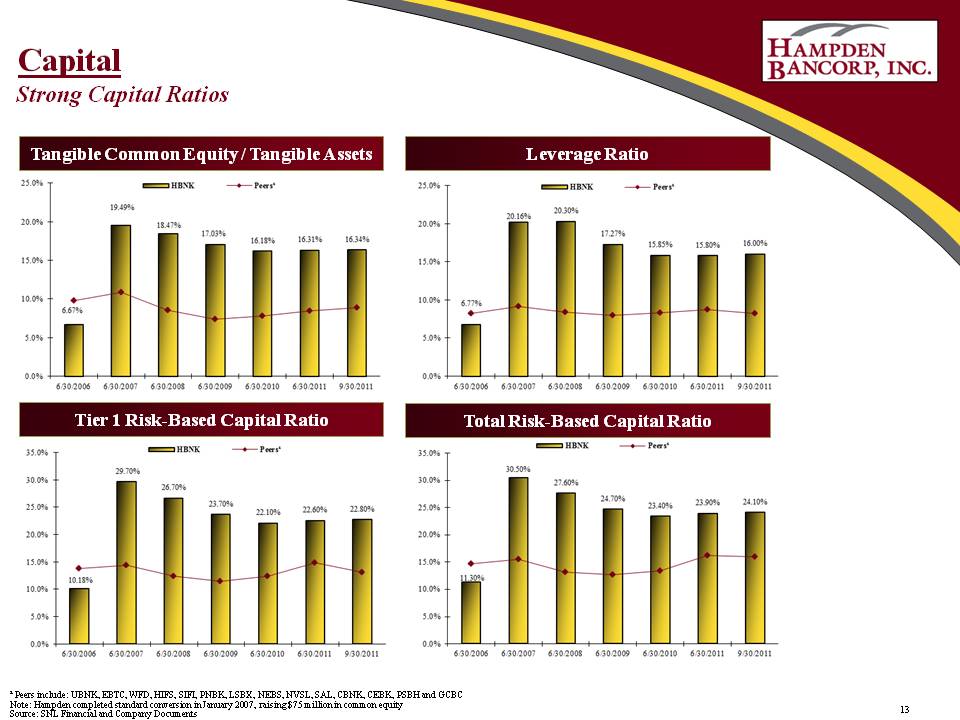
13 Capital Strong Capital Ratios ¹ Peers include: UBNK, EBTC, WFD, HIFS, SIFI, PNBK, LSBX, NEBS, NVSL, SAL, CBNK, CEBK, PSBH and GCBC Note: Hampden completed standard conversion in January 2007, raising $75 million in common equity Source: SNL Financial and Company Documents
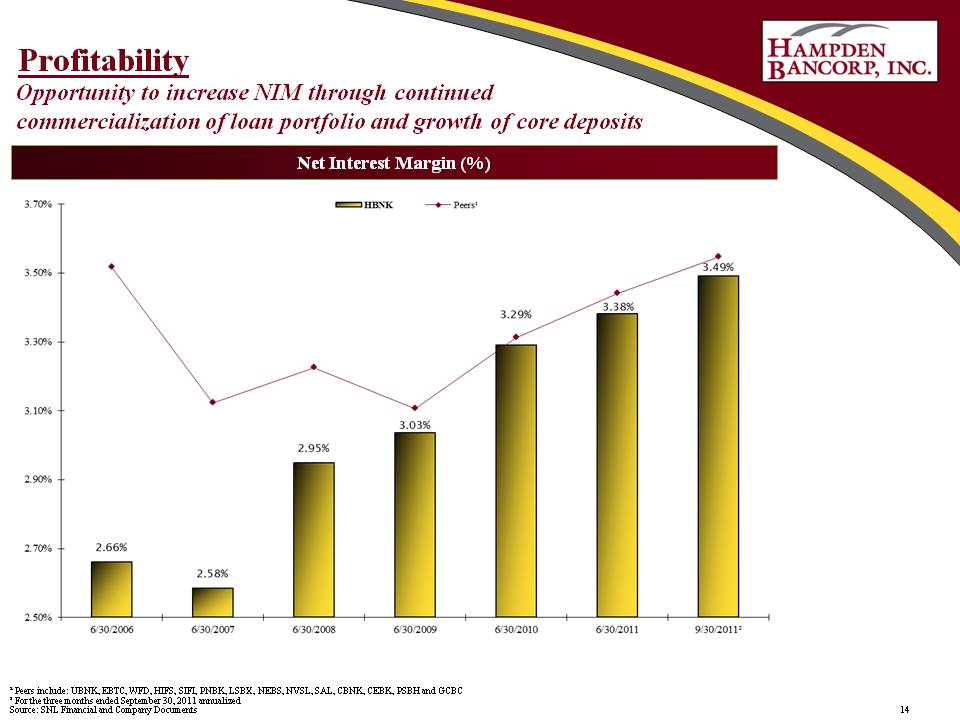
14 Profitability Opportunity to increase NIM through continued commercialization of loan portfolio and growth of core deposits 2.66% 2.58% 2.95% 3.03% 3.29% 3.38% 3.49% 6/30/2006 6/30/2007 6/30/2008 6/30/2009 6/30/2010 6/30/2011 9/30/2011² ¹ Peers include: UBNK, EBTC, WFD, HIFS, SIFI, PNBK, LSBX, NEBS, NVSL, SAL, CBNK, CEBK, PSBH and GCBC ² For the three months ended September 30, 2011 annualized Source: SNL Financial and Company Documents
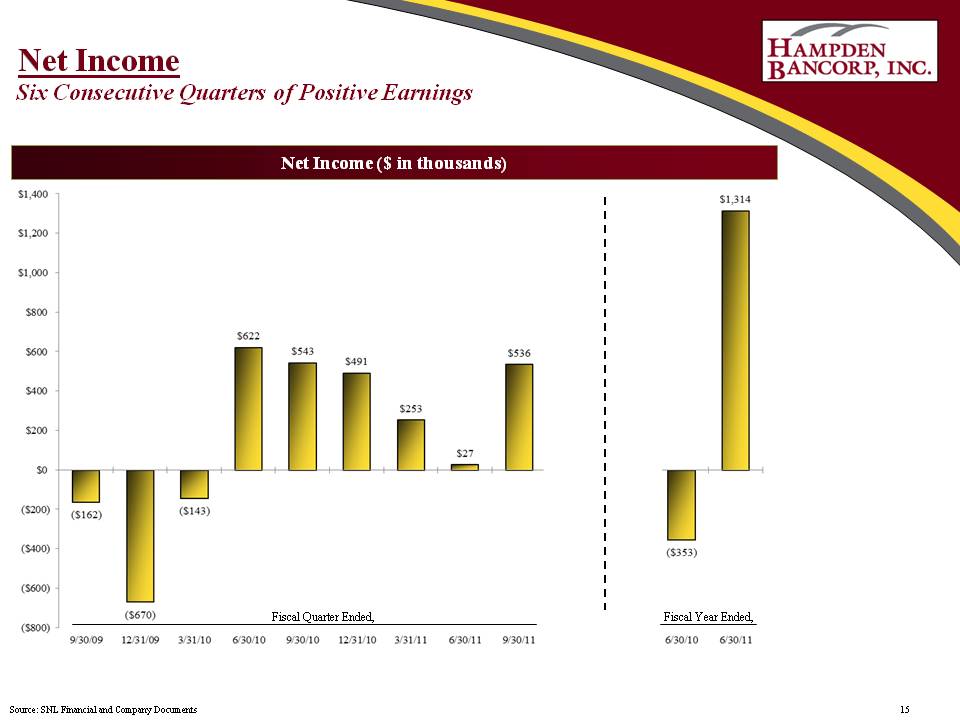
15 Net Income Six Consecutive Quarters of Positive Earnings ($162) ($670) ($143) $622 $543 $491 $253 $27 $535 ($353) $1.314 Fiscal Quarter Ended Fiscal Year Ended 9/30/09 12/31/09 3/31/10 6/30/10 9/30/10 12/31/10 3/31/11 6/30/11 9/30/11 6/30/10 6/30/11 Source: SNL Financial and Company Documents
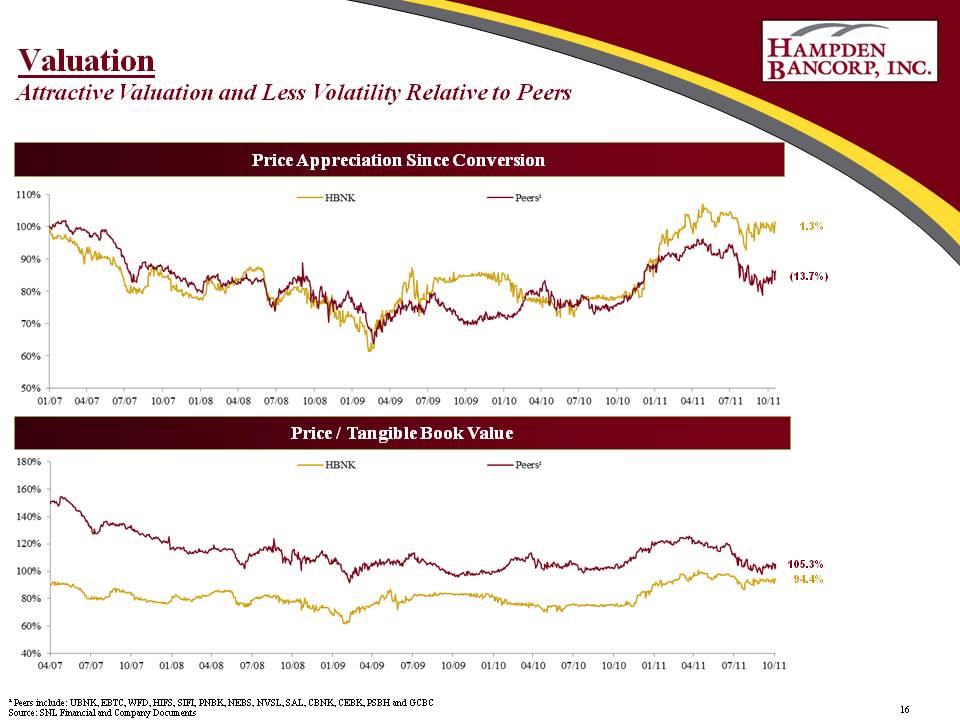
16 Valuation Attractive Valuation and Less Volatility Relative to Peers ¹ Peers include: UBNK, EBTC, WFD, HIFS, SIFI, PNBK, NEBS, NVSL, SAL, CBNK, CEBK, PSBH and GCBC Source: SNL Financial and Company Documents
17 Investment Summary Strong core deposit base in demographically attractive market, with growth opportunity Deep capital base Proactive risk management Experienced management team Current attractive valuation relative to peers