Attached files
| file | filename |
|---|---|
| 8-K - CURRENT REPORT OF MATERIAL EVENTS OR CORPORATE CHANGES - Digital Generation, Inc. | a11-29565_18k.htm |
Exhibit 99.1
|
|
DG (NASDAQ:DGIT) Management Presentation November 2011 11/8/2011 1 ©2011, DG. All rights reserved. |
|
|
Operate proprietary, scalable Internet/TV advertising platforms Benefit from growth & convergence trends in TV and Internet 9,000+ advertisers and 3,800 agencies use DG platforms globally 64 Countries / 43 Offices / 1,700 employees Demonstrated ability to acquire and integrate businesses Long track record of growth, profitability and cash flow generation ©2011 DG, All rights reserved Company Highlights 2 |
|
|
11/8/2011 ©2011, DG. All rights reserved. DG in a Nutshell 3 Largest pure-play provider of ad technology Global service & innovation heritage Well Positioned to benefit from TV, online convergence |
|
|
Interactive Ad Content The DG Platform: Unique Barrier to Entry TV Ad Content TV Media Online Media Broadcast Video Mobile Cable Satellite Display Managing Over $43Bn Worth of Advertising and Content 4 ©2011, DG. All rights reserved. |
|
|
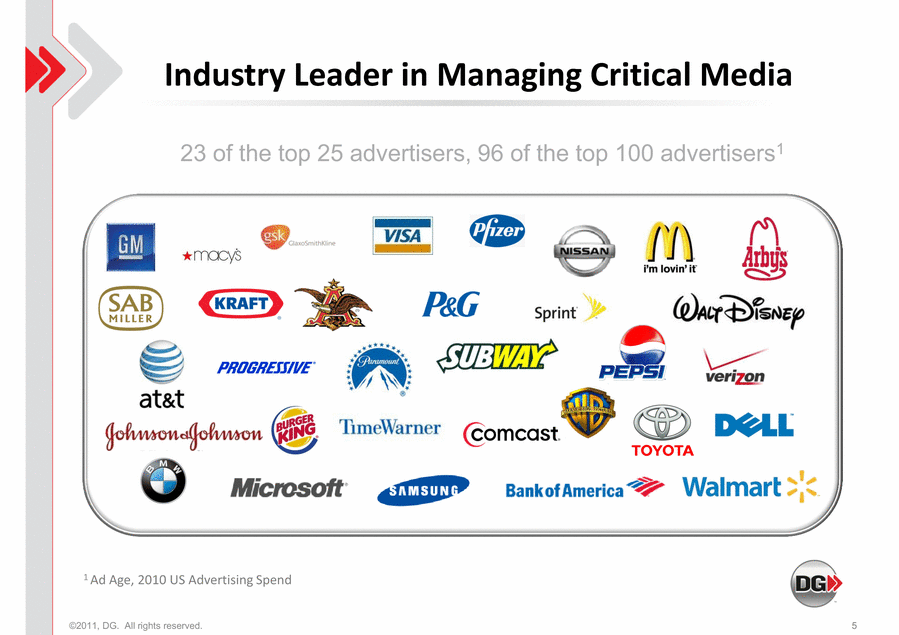
Industry Leader in Managing Critical Media 23 of the top 25 advertisers, 96 of the top 100 advertisers1 1 Ad Age, 2010 US Advertising Spend 5 ©2011, DG. All rights reserved. |
|
|
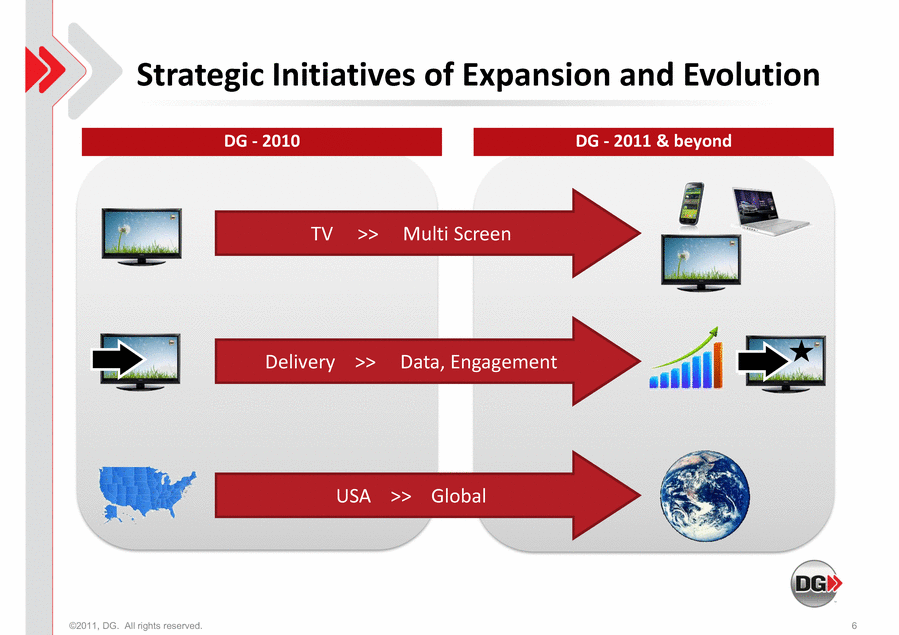
©2011, DG. All rights reserved. Strategic Initiatives of Expansion and Evolution 6 TV >> Multi Screen Delivery >> Data, Engagement USA >> Global DG - 2010 DG - 2011 & beyond |
|
|
©2011, DG. All rights reserved. Channel Expansion in Q3 7 TV >> Multi Screen TV Division 72% Internet Division 28% Q3 2011 TV Division 93% Internet Division 7% Q3 2010 |
|
|
©2011, DG. All rights reserved. TV Unit Offering Expansion in Q3 8 Delivery >> Data, Engagement 38% 52% Q3 '10 Q3 '11 0% 20% 40% 60% 8% 17% Q3 '10 Q3 '11 0% 5% 10% 15% 20% 11% 23% Q3 '10 Q3 '11 0% 5% 10% 15% 20% 25% % of Sites HD Enabled % of HD Deliveries to HD Enabled Sites HD Deliveries as % of Total |
|
|
North America 98% EMEA 2% ©2011, DG. All rights reserved. Geographic Expansion in Q3 9 USA >> Global North America 84% Rest of World 5% EMEA 11% Q3 2011 Revenue Q3 2010 Revenue |
|
|
Opportunities Increasing number of HD TV sets and HD enabled destinations Adoption of file-based distribution by direct response/infomercial businesses EMEA, APAC, and emerging markets Evolution of Advanced TV creates incremental opportunities Actions & objectives Aggressive reorg of engineering under Gal Trifon, Ofer Zadikario Hiring of new VP Products, Elad Manishviz, TV veteran Execute International expansion / SmartJog partnership Increase electronic market share in North America Innovate and deploy new products and services Complete MIJO and TreeHouse synergy programs ©2011 DG, All rights reserved TV Unit Strategic Vision 10 |
|
|
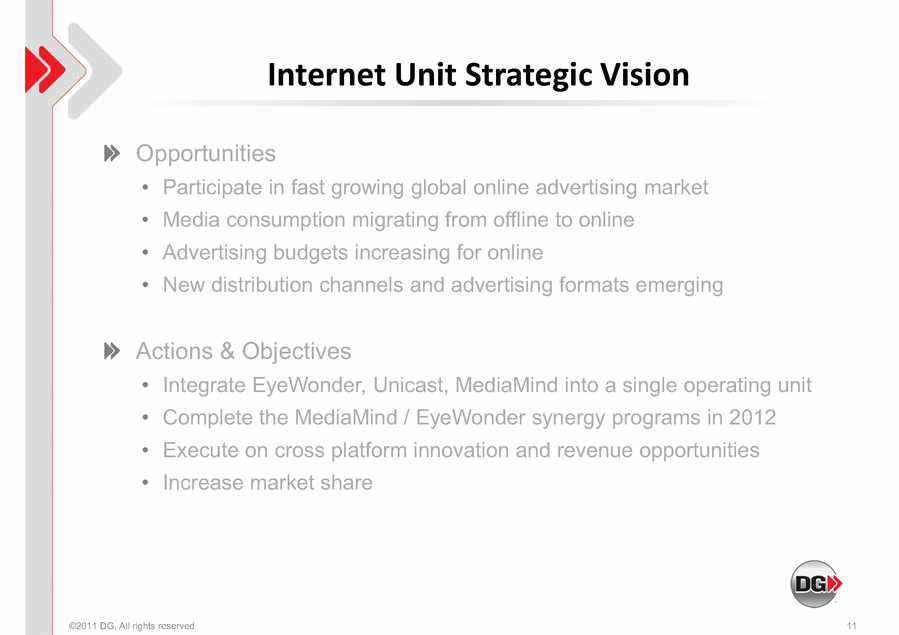
Opportunities Participate in fast growing global online advertising market Media consumption migrating from offline to online Advertising budgets increasing for online New distribution channels and advertising formats emerging Actions & Objectives Integrate EyeWonder, Unicast, MediaMind into a single operating unit Complete the MediaMind / EyeWonder synergy programs in 2012 Execute on cross platform innovation and revenue opportunities Increase market share ©2011 DG, All rights reserved Internet Unit Strategic Vision 11 |
|
|
Market Analysis 2011 Market DoubleClick 37.6% Atlas 19.3% DG (MM, UC and EW) 22.3% PointRoll 12.4% Other 4.7% Share of market for third party buy side advertising technology. Source: Management estimates, PwC, eMarketer, ZenithOptimedia, October 2011, excluding China Note: Numbers may not add up due to rounding. ValueClick/ Mediaplex 3.0% Third Party Ad Serving Total Market: $715 MM Combined Market Share: 22.3% Second largest player 12 ©2011, DG. All rights reserved. |
|
|
FINANCIAL HIGHLIGHTS ©2011, DG. All rights reserved. 13 |
|
|
Track Record of Strong Revenue/EBITDA Growth $68.7 $97.7 $157.1 $190.9 $247.5 2006 2007 2008 2009 2010 Revenue 14 $19.2 $32.3 $60.3 $77.8 $116.3 2006 2007 2008 2009 2010 Adjusted EBITDA CAGR = 38% ($ in millions) CAGR = 57% The definition of Adjusted EBITDA can be found on the last page. ©2011 DG, All rights reserved |
|
|
Track Record of Strong EPS Growth Accretive transactions Financial gains from revenue and cost synergies History of operating success 11/8/2011 ©2011, DG. All rights reserved. 15 -$0.06 $0.61 $0.79 $0.88 $1.50 2006 2007 2008 2009 2010 EPS |
|
|
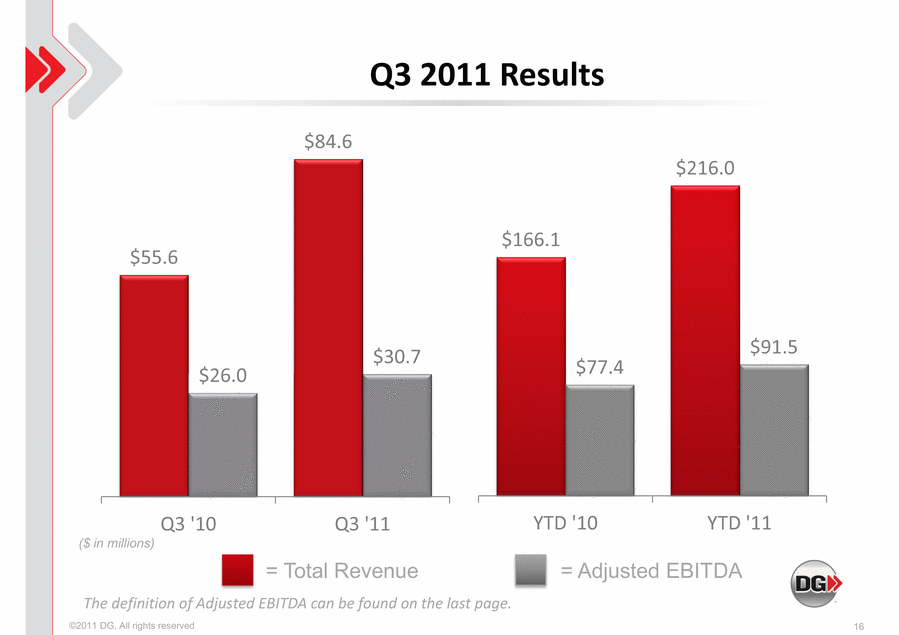
Q3 2011 Results $166.1 $216.0 $77.4 $91.5 YTD '10 YTD '11 ($ in millions) = Total Revenue = Adjusted EBITDA The definition of Adjusted EBITDA can be found on the last page. ©2011 DG, All rights reserved $55.6 $84.6 $26.0 $30.7 Q3 '10 Q3 '11 16 |
|
|
DG achieved $31 million of integration cost savings between 2006 and 2008 DG expects an additional $27.5 million in cost savings by the end of 2012 Demonstrated Ability to Integrate Acquisitions 17 2006 2007 2011–2012 $12 $7 $9 $3 $2 $3.5 $15 $7 2008 ©2011 DG, All rights reserved |
|
|
Total Synergy Summary–as of 9/30/11 Confidential $27.5 $12.1 $0 $5 $10 $15 $20 $25 $30 Total synergies Synergy Acted On ($ in millions) 18 ©2011 DG, All rights reserved |
|
|
Synergy Overview as of 9/30/11 $2,000 $3,500 $15,000 $7,000 $1,580 $1,838 $3,456 $5,259 $- $4,000 $8,000 $12,000 $16,000 Treehouse MIJO MediaMind EyeWonder Publically Announced Synergy Synergy Acted On ($ in thousands) 19 ©2011 DG, All rights reserved |
|
|
DG Pro Forma Capitalization Table 20 ©2011 DG, All rights reserved PF 9/30/11 ($ in Millions) Revolver ($120mm available) $ 0.0 Term Loan B 484.0 Total Debt 484.0 2.8X Less: Cash (67.1) Net Debt $ 416.9 2.4X Leverage (LTM as of September 30, 2011) Leverage (LTM as of September 30, 2011) |
|
|
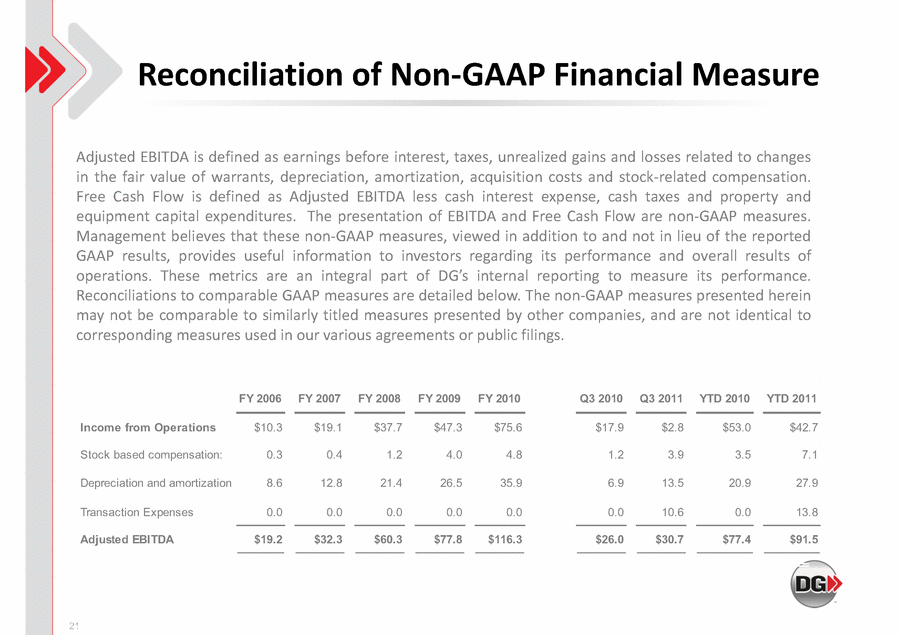
Reconciliation of Non-GAAP Financial Measure 21 Adjusted EBITDA is defined as earnings before interest, taxes, unrealized gains and losses related to changes in the fair value of warrants, depreciation, amortization, acquisition costs and stock-related compensation. Free Cash Flow is defined as Adjusted EBITDA less cash interest expense, cash taxes and property and equipment capital expenditures. The presentation of EBITDA and Free Cash Flow are non-GAAP measures. Management believes that these non-GAAP measures, viewed in addition to and not in lieu of the reported GAAP results, provides useful information to investors regarding its performance and overall results of operations. These metrics are an integral part of internal reporting to measure its performance. Reconciliations to comparable GAAP measures are detailed below. The non-GAAP measures presented herein may not be comparable to similarly titled measures presented by other companies, and are not identical to corresponding measures used in our various agreements or public filings. ($ in millions) ©2011 DG, All rights reserved FY 2006 FY 2007 FY 2008 FY 2009 FY 2010 Q3 2010 Q3 2011 YTD 2010 YTD 2011 Income from Operations $10.3 $19.1 $37.7 $47.3 $75.6 $17.9 $2.8 $53.0 $42.7 Stock based compensation: 0.3 0.4 1.2 4.0 4.8 1.2 3.9 3.5 7.1 Depreciation and amortization 8.6 12.8 21.4 26.5 35.9 6.9 13.5 20.9 27.9 Transaction Expenses 0.0 0.0 0.0 0.0 0.0 0.0 10.6 0.0 13.8 Adjusted EBITDA $19.2 $32.3 $60.3 $77.8 $116.3 $26.0 $30.7 $77.4 $91.5 |
|
|
THANK YOU www.DGit.com CORPORATE HEADQUARTERS 750 l West John Carpenter Freeway l Suite 700 l Irving l Texas l 75039 p. 972.581.2000 f. 972.581.2001 22 ©2011, DG. All rights reserved. |

