Attached files
| file | filename |
|---|---|
| 8-K - FORM 8-K - BROADRIDGE FINANCIAL SOLUTIONS, INC. | d252623d8k.htm |
 November 2011
Continued Market Leadership
through Execution and Innovation
Investor Presentation
©
2011 Broadridge Financial Solutions, Inc.
Broadridge and the Broadridge logo are registered trademarks of Broadridge
Financial Solutions, Inc. Exhibit 99.1 |
 1
Forward-looking statements
Use of non-GAAP financial measures
This
presentation
may
include
certain
Non-GAAP
(generally
accepted
accounting
principles)
financial
measures
in
describing
Broadridge’s
performance.
Management
believes
that
such
Non-GAAP
measures,
when
presented
in
conjunction
with
comparable
GAAP
measures
provide
investors
a
more
complete
understanding
of
Broadridge’s
underlying
operational
results.
These
Non-GAAP
measures
are
indicators
that
management
uses
to
provide
additional
meaningful
comparisons
between
current
results
and
prior
reported
results,
and
as
a
basis
for
planning
and
forecasting
for
future
periods.
These
measures
should
be
considered
in
addition
to
and
not
a
substitute
for
the
measures
of
financial
performance
prepared
in
accordance
with
GAAP.
The
reconciliations
of
such
measures
to
the
comparable
GAAP
figures
are
included
in
this
presentation.
This
presentation
and
other
written
or
oral
statements
made
from
time
to
time
by
representatives
of
Broadridge
may
contain
“forward-looking
statements”
within
the
meaning
of
the
Private
Securities
Litigation
Reform
Act
of
1995.
Statements
that
are
not
historical
in
nature,
and
which
may
be
identified
by
the
use
of
words
like
“expects,”
“assumes,”
“projects,”
“anticipates,”
“estimates,”
“we
believe,”
“could
be”
and
other
words
of
similar
meaning,
are
forward-looking
statements.
In
particular,
information
appearing
in
the
“Fiscal
Year
2012
Financial
Guidance”
section
and
statements
about
our
future
financial
performance
are
forward-looking
statements.
These
statements
are
based
on
management’s
expectations
and
assumptions
and
are
subject
to
risks
and
uncertainties
that
may
cause
actual
results
to
differ
materially
from
those
expressed.
These
risks
and
uncertainties
include
those
risk
factors
discussed
in
Part
I,
“Item
1A.
Risk
Factors”
of
our
Annual
Report
on
Form
10-K
for
the
fiscal
year
ended
June
30,
2011
(the
“2011
Annual
Report”),
as
they
may
be
updated
in
any
future
reports
filed
with
the
Securities
and
Exchange
Commission.
All forward-
looking
statements
speak
only
as
of
the
date
of
this
presentation
and
are
expressly
qualified
in
their
entirety
by
reference
to
the
factors
discussed
in
the
2011
Annual
Report.
These
risks
include:
the
success
of
Broadridge
in
retaining
and
selling
additional
services
to
its
existing
clients
and
in
obtaining
new
clients;
Broadridge’s
reliance
on
a
relatively
small
number
of
clients,
the
continued
financial
health
of
those
clients,
and
the
continued
use
by
such
clients
of
Broadridge’s
sevices
with
favorable
pricing
terms;
changes
in
laws
and
regulations
affecting
the
investor
communication
services
provided
by
Broadridge;
declines
in
participation
and
activity
in
the
securities
markets;
overall
market
and
economic
conditions
and
their
impact
on
the
securities
markets;
any
material
breach
of
Broadridge
security
affecting
its
clients’
customer
information;
the
failure
of
Broadridge’s
outsourced
data
center
services
provider
to
provide
the
anticipated
levels
of
service;
any
significant
slowdown
or
failure
of
Broadridge’s
systems
or
error
in
the
performance
of
Broadridge’s
services;
Broadridge’s
failure
to
keep
pace
with
changes
in
technology
and
demands
of
its
clients;
Broadridge’s
ability
to
attract
and
retain
key
personnel;
the
impact
of
new
acquisitions
and
divestitures;
and
competitive
conditions.
Broadridge
disclaims
any
obligation
to
update
or
revise
forward-looking
statements
that
may
be
made
to
reflect
events
or
circumstances
that
arise
after
the
date
made
or
to
reflect
the
occurrence
of
unanticipated
events,
other
than
as
required
by
law.
Use of material contained herein
The
information
contained
in
this
presentation
is
being
provided
for
your
convenience
and
information
only.
This
information
is
accurate
as
of
the
date
of
its
initial
presentation.
If
you
plan
to
use
this
information
for
any
purpose,
verification
of
its
continued
accuracy
is
your
responsibility.
Broadridge
assumes
no
duty
to
update
or
revise
the
information
contained
in
this
presentation.
You
may
reproduce
information
contained
in
this
presentation
provided
you
do
not
alter,
edit,
or
delete
any
of
the
content
and
provided
you
identify
the
source
of
the
information
as
Broadridge
Financial
Solutions,
Inc.,
which
owns
the
copyright.
Pre-Spin financial information
Financial
information
presented
for
periods
prior
to
the
March
30,
2007
spin-off
of
Broadridge
from
Automatic
Data
Processing,
Inc.
(“ADP”)
represents
the
operations
of
the
brokerage
services
business
which
were
operated
as
part
of
ADP.
Broadridge’s
financial
results
for
periods
before
the
spin-off
from
ADP
may
not
be
indicative
of
our
future
performance
and
do
not
necessarily
reflect
what
our
results
would
have
been
had
Broadridge
operated
as
a
separate,
stand-alone
entity
during
the
periods
presented,
including
changes
in
our
operations
and
capitalization
as
a
result
of
the
spin-off
from
ADP. |
 2
Broadridge Strategy Statement
Our vision is to be the leading provider of Investor
Communications and Technology and Operations Solutions to
Bank/Broker-Dealers, Mutual Funds, and Corporate Issuers
globally
–
We have strong positions in large and attractive markets with opportunities
to grow
–
We have a balanced and diverse portfolio across four related businesses:
broker-dealer communications, mutual funds, issuer services, and
broker- dealer technology and operations
–
We will grow all four businesses by leveraging our unique network, our
market position, and our brand/service reputation
–
We will do so with a combination of organic growth and M&A
–
We anticipate that this approach will drive 6-9% revenue growth,
low-to-mid teens earnings growth, and including a target 2-3%
dividend yield and buybacks, top-quartile total shareholder returns
through FY14 |
 3
Broadridge is a strong, resilient business
with significant growth potential
History of market leadership
–
Proven ability to address increasingly complex customer needs
through technology
–
Innovation and thought leader in industry for >40 years
Strong position in large and attractive markets
–
Leader in investor communications and securities processing
–
Resilient through crisis due to mission-critical nature of services
–
Deeply respected by industry and regulators
–
Ample room for expansion into naturally adjacent markets
Excellent team
–
Results-driven and deeply experienced management team aligned
with shareholders
–
Highly engaged associates—one of the best large companies to work
for in NY
1. As recognized by the NY Society of Human Resources in
2008-2011 1 |
 4
Our market position is differentiated
and sustainable
Revenue growth
Investor Communication Services
$B
2.4
2.0
1.4
2011
2005
Growth through
crisis and recession
•
Proxy services for >85%
of outstanding
shares in US
•
Processed >600 billion shares in 2011
•
Used by >4,000 institutional investors
globally
•
Eliminates >50%
of physical mailings
•
100K
votes through mobile apps in first
two months since launch
New businesses
Tuck-in acquisitions and
partnerships within clear and
strict guardrails
Broadridge is well positioned to accelerate growth
and continue driving significant free cash flow
5% CAGR
Securities Processing Services
Ranked
#1
Brokerage Service
Outsourcing
Provider (2010)
Enable
clients to
process in
>50 countries
Processes
>$4 trillion
in FI trades
per day |
 5
Investor Communication
Services
Securities Processing
Services
We are the leader in several markets
Market
Rank
Bank/Broker-Dealer
Regulatory
Communications
Broker-Dealer
Transactional
Communications
Corporate Issuer
Regulatory
Communications
Mutual Fund Proxy
Mail and Tabulation
Market
Rank
US Brokerage
Processing
US Fixed Income
Processing
Canadian Brokerage
Processing
#1
#1
#1
#1
#1
#1
#1
1. Rank by market share
1
1 |
 6
Since spin-off, we have focused on the
drivers of TSR
TSR driver
Key actions
Portfolio
Drive profitable growth
Spending >$300M annually on technology
Introduced >20 new products since spin-off
Made several strategic acquisitions
Divested Ridge and pruned underperforming products
Operational
excellence
Improve margins by leveraging scale
Migrating data center from ADP to IBM
Smart-shoring –
20% of associates now in India
Strict financial controls
Financial
strategy
Generate strong cash flow for our shareholders
Paid down debt to 1:1 Adjusted Debt/EBITDAR within 18 months
of spin
Doubled dividend in 2010, increased by further 7% in 2011
(current payout ratio 35%)
Repurchased ~25M shares since spin, with additional ~7M
available for repurchase at September 30, 2011
In last four years we have strengthened our position,
restructured our portfolio and returned significant cash
1. Adjusted
Debt-to-EBITDAR
ratio
calculated
as
(Debt
+
5x
Rent
Expense)
/
(EBITDA
+
Rent
Expense)
1
2
3 |
 7
Since spin-off, we have reduced “spin debt”
and returned capital
Change
in cash²
198
155
395
Dividends
213
392
Freed-up
capital
281
FCF
(Non-
GAAP)
1,072
Capex
191
Cash flow
from
operations
(GAAP)
1,263
Use of cash FY07–11, $M
Focus on prudent capital stewardship
1. Gross buy-backs of $509 less proceeds from stock option exercises of
$115 2. FY11 ending cash of $241 less beginning cash of $43
Buy-
backs¹
Tuck-in
acquisi-
tions
Debt
reduction |
 8
Mutual Fund—Core
Retirement processing
Data aggregation
Marketing communications
Proxy/solicitation
Large and attractive markets –
Investor
Communications (ICS) is a $10B+ market
BBD—Emerging products
Global proxy and communications
Tax reporting and outsourcing
Security class actions
Advisor services
Bank/Broker-Dealer (BBD)—Core
Regulatory communications
(proxy, interims, etc.)
Customer communications
(transaction statements, etc.)
Total addressable market $10B+ fee revenue
Issuer
Transfer agency
Shareholder analytics
Investor communications
BBD—Natural adjacencies
Enterprise archiving
On-boarding
International tax reclaim
$1.3B
$0.9B
$2.0B
$3.0B
$1.8B
$1.7B
Mutual Fund—Natural adjacencies
Transaction reporting
Imaging and workflow, etc.
Sources: BCG, Bain, Patpatia, Broadridge estimates |
 9
Sources: Tower Group, Chartis, Aite, IM2, Broadridge internal estimates
Technology and Operations (SPS) adds
~$14B to our addressable market
Securities and investment firms’
overall technology and operations
spend is over $100 billion and growing at 5%
$1.2B
$2.8B
~$5.0B
Adjacent markets
Middle-office
Buy-side services
Derivatives processing
Fixed Income market
data and analytics
~$5.2B
North American BPO
Middle-
and back-office
Data center services
Select corporate functions
US Brokerage Processing
Core equities and fixed income
Global Processing
Core equities and fixed income
Global BPO
Reconciliations
Total addressable market ~ $14B fee revenue |
 10
Our strategy is to leverage our market role
to expand our client relationships
Reinforce role as the industry thought leader to lead e-transition
Drive growth in adjacent markets through new organic or
acquired solutions
Grow core
Bank/Broker-Dealer
Communications
Build leading data-
driven Mutual Fund
Solutions Provider
Leverage unique data hub position and leading role in the
BBD market
Grow retirement trade processing, data aggregation, marketing
communication and proxy/solicitation services
Grow Issuer
Solutions
Capitalize on position in beneficial processing to expand direct
relationship with issuers
Expand registered proxy, transfer agency, and enhanced
Issuer services
Grow Global
Technology and
Operations
Solutions
Leverage market-leading global platform to expand current
relationships and enter new adjacencies
Grow global processing and BPO businesses; selectively
pursue other adjacencies
Multiple ways to win |
  11
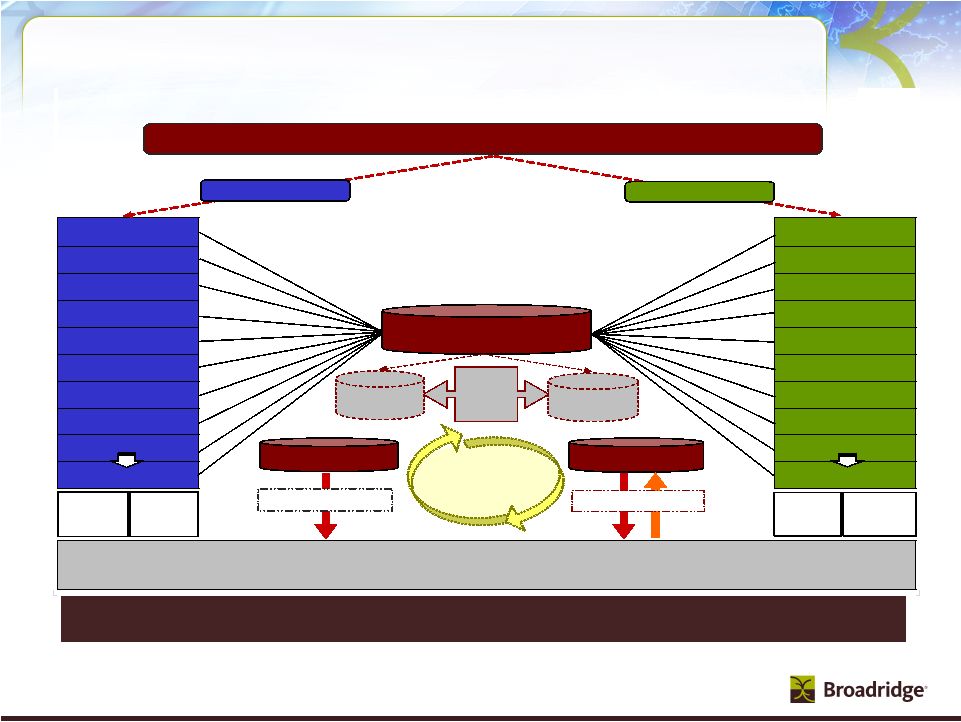
ICS Unique Business Systems Processing Model
Proxy and Interim processing system is the “plumbing”
supporting the voting process for
corporate governance
(1)
Represents Broadridge’s estimated total number of brokerage firms
and banks in the U.S. and international markets (2)
Represents Broadridge’s estimated total number of positions
managed by U.S. brokers and banks (3)
Represents Broadridge’s estimated total number of corporate
issuers in the U.S. (4)
Represents
total
number
of
Fund
Sponsors
in
the
U.S.
who
manage
over
16,000
funds
including
Mutual
Funds,
Closed-end
Funds,
ETFs
and
UITs,
according
to
the
Investment Company Institute’s 2009 Investment Company Year Book
PROXY & INTERIMS PROCESSING OVERVIEW
"THE PLUMBING"
Broker/Bank 1
Issuer 1 / Fund 1
Broker/Bank 2
Issuer 2 / Fund 2
Broker/Bank 3
Issuer 3 / Fund 3
Broker/Bank 4
Issuer 4 / Fund 4
Broker/Bank 5
Issuer 5 / Fund 5
Broker/Bank 6
Issuer 6 / Fund 6
Broker/Bank 7
Issuer 7 / Fund 7
Broker/Bank 8
Issuer 8 / Fund 8
Broker/Bank 9
Issuer 9 / Fund 9
˜ Brokers/Banks
800+
(1)
˜ Issuers 10,000+
(3)
˜ Funds 700+
(4)
ANNUAL CORPORATE ISSUER AND MUTUAL FUND EVENTS
Approximately 12,000 Events Per Year
(Annual Corporate Issuer Shareholder Meetings and Mutual Fund Proxy Meetings)
Proxy Distribution
>40% of
accounts
require
special
processing
Vote Processing
Managing
~350M
active
positions
(2)
Majority of
all shares
are held in
street-side
Shareholder
Preferences
Database
Shareholder
Consent
Database
Equity and Mutual Fund Shareholders
Broadridge
manages
>1,600
Corporate
Issuers
Broadridge
processes on
average 85%
of U.S. shares
outstanding
Electronic or
Physical Vote Return
Data Hub and Platform
Electronic or
Physical Delivery
Street-side Processing
Registered Processing
> 50% of Hard Copy
Mailings Eliminated
via E-Delivery and
Suppressions
85% of Shares Voted
Electronically
BROADRIDGE
Proxy Processing System
Over 8 million lines of code and approximately 500,000 function points
Supported by 150+ dedicated programmers |
 12
Bank/Broker
-
Dealer
(43%)
Mutual Fund
(28%)
Corporate
Issuer
(29%)
Distribution
$704M (45%)
Other
$103M (7%)
Fulfillment
$117M (8%)
Transaction
Reporting
$156M (10%)
Interims
$146M (9%)
Proxy
$334M (21%)
ICS Product and Client Revenue Overview
We have a strong and diverse product
offering…
We have a strong and diverse product
offering…
ICS is highly resilient due to our deep customer relationships with our
Bank/Broker-Dealer clients
Primarily
Postage
…and we have deep and longstanding
client relationships
…and we have deep and longstanding
client relationships
Increase in electronic
distribution reduces postage
revenue and increases profits
FY11 Product Revenues
FY11 Client Revenues
(Based on who pays BR as agent) |
 13
ICS-Bank/Broker-Dealer
What We Do:
Regulatory communications
–
Beneficial proxy and interims for equities
–
Beneficial mutual fund compliance
communications
Customer communications
–
Transaction statements, trade confirmations
and other reporting
Global and emerging products
–
Advisor services
–
Global proxy and communications
–
Tax reporting and outsourcing
–
Securities class actions
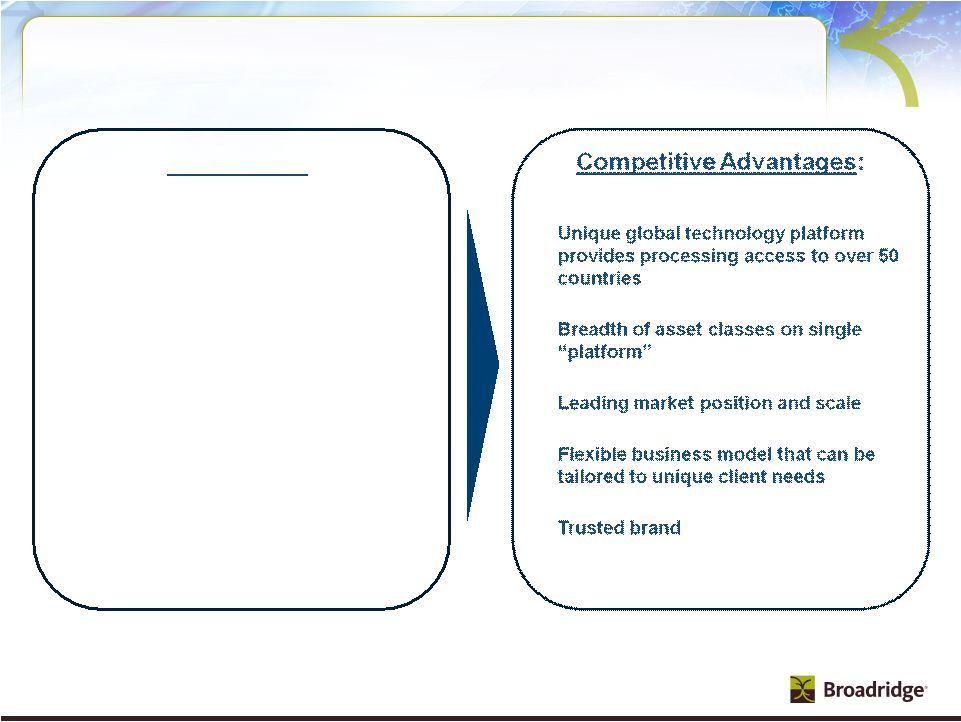
Competitive Advantages:
Indispensible data hub with established
relationships with majority of BBDs
Strong market position and innovative
leadership
–
First/only certified voting results
–
First e-delivery, phone, web and mobile
voting platform
Proprietary systems, network and
databases
–
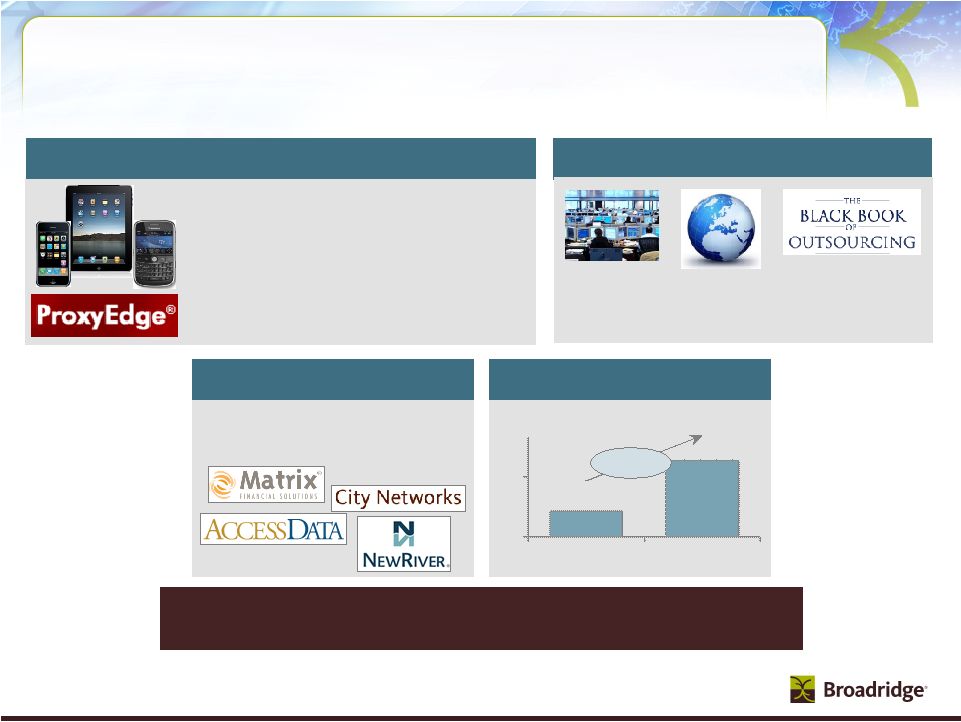
ProxyEdge®
–
institutional voting and record
keeping platform
–
Preference and consent database
Unmatched scale with highest level data
security (ISO 27001) |
 14
What We Do:
Mutual Fund trade processing in the
defined contribution/trust space
(Matrix)
Data aggregation and analytics
(Access Data)
Marketing/Regulatory
communications including content
(NewRiver)
Registered proxy and solicitation
Competitive Advantages:
Long-standing relationships across
industry
Serve every mutual fund and majority of
bank/broker-dealers
Unique data capabilities
Proprietary platform to allow mutual funds to
understand their clients
Innovative business applications that address
unique industry issues such as compliance
and distribution payments
Largest electronic repository for mutual fund
compliance data
Industry-leading ICS products with
unmatched scale
Leverage to create cost-effective products for
mutual funds
ICS-Mutual Funds |
 15
What We Do:
Beneficial proxy service
Registered shareholder communications
–
Registered proxy
–
Interim communications
Transfer agency (TA)
–
Stock share registry, ownership
transfers and dividend calculation
Enhanced issuer solutions
–
Shareholder analytics
–
Virtual shareholder meetings
–
Shareholder forums
–
Global proxy services
Competitive Advantages:
Market Position
–
only full service provider of
shareholder
communications
to
all
types
of
shareholders
Unmatched Scale
–
able to leverage one billion plus
shareholder communications annually as well as
record-keeping, corporate actions and other
shareholder account servicing
Unmatched Data
–
unique dataset of investors and
positions allows Issuers to more effectively reach
their shareholders
Thought Leadership –
unmatched expertise to
innovate the proxy process and help guide
Issuers through a complex regulatory
environment
ICS-Issuers |
 16
M
A
R
K
E
T
S
H
A
R
E
Equity
(~75%)
Transactions, $239M
Non-transactions, $211M
Fixed Income (~15%)
Transactions, $56M
Non-transactions, $30M
Outsourcing
(~10%)
$58M
FY11 Product Revenues
Securities Processing North America Market Share
Overview¹
Equity Processing Client Volume
Broadridge
~30%
Competitors
~20%
In-house
~50%
Broadridge
~6%
Untapped
Market
~94%
(>$1 Billion)
In-house
~43%
Competitors
~2%
U.S. $ Fixed Income Client Volume
Operations Outsourcing
1. All market share information is based on management’s estimates
and is part of much larger market. No attempt has been made to
size such market Broadridge
~55% |
 17
What We Do:
Best-of-breed processing solutions
–
Leading global platform
–
Broad asset class coverage
Broad suite of add-on or point solutions
–
Desk top applications used by brokers
and traders
–
Workflow and reconciliation
applications
–
Data aggregation and warehousing
tools
Industry-leading global business process
outsourcing (BPO) solutions
Technology and Operations (SPS) |
 18
Total Shareholder Return
6–9%
revenue
growth
Financial strategy
Portfolio
Operational
excellence
Drive organic growth
in current markets
Exploit adjacent
market opportunities
Leverage economies
of scale
Further optimize
infrastructure
Generate strong FCF
enabled by high ROIC
Continue returning
large share of FCF to
shareholders
Margin
expansion
from 13% to
17–19%
We plan to deliver strong Total
Shareholder Return (TSR) through FY14
35% payout
that currently
yields 2–3%,
plus buybacks |
 19
Our financial strategy is a key part of our
value creation strategy
35% dividend payout, but expect no less than 64 cents
per share
Organic growth with limited financial risk
–
Avoid significant balance sheet risk
–
Invest in projects delivering at least 20% IRR
Tuck-in acquisitions with clear growth profile and returns
–
Accretive to growth, margins, and earnings
–
>20% IRR in conservative business case
Long-term investment-grade debt rating
–
Adjusted Debt/EBITDAR ratio target is 2:1
Excess cash used opportunistically to offset dilution and
reduce share count through buybacks
1. Adjusted Debt/EBITDAR ratio calculated as (Debt + 5x Rent Expense) / (EBITDA +
Rent Expense) 1 |
 20
Broadridge's investment thesis |
 21
FY07–11, $M
Free Cash Flow from Operations (GAAP)
1,263
$
Capex
191
$
FCF (Non-GAAP)
1,072
$
Reconciliation of Non-GAAP to GAAP Measures |