Attached files
| file | filename |
|---|---|
| 8-K - FORM 8-K - Tower Group International, Ltd. | y93349e8vk.htm |
Exhibit 99.1
| 1. Third Quarter 2011Earnings Call Presentation |
| Forward-Looking Statements The Private Securities Litigation Reform Act of 1995 provides a "safe harbor" for forward-looking statements. This presentation and any other written or oral statements made by or on behalf of Tower may include forward-looking statements that reflect Tower's current views with respect to future events and financial performance. All statements other than statements of historical fact included in this presentation are forward-looking statements. Forward-looking statements can generally be identified by the use of forward-looking terminology such as "may," "will," "plan," "expect," "project," "intend," "estimate," "anticipate," "believe" and "continue" or their negative or variations or similar terminology. All forward-looking statements address matters that involve risks and uncertainties. Accordingly, there are or will be important factors that could cause the actual results of Tower to differ materially from those indicated in these statements. Please refer to Tower's filings with the SEC, including among others Tower's Annual Report on Form 10-K for the year ended December 31, 2010 and subsequent filings on Form 10-Q, for a description of the important factors that could cause the actual results of Tower to differ materially from those indicated in these statements. Forward-looking statements speak only as of the date on which they are made, and Tower undertakes no obligation to update publicly or revise any forward-looking statement, whether as a result of new information, future developments or otherwise. Notes on Non-GAAP Financial MeasuresOperating income excludes realized gains and losses, acquisition-related transaction costs and the results of the reciprocal business, net of tax. This is a common measurement for property and casualty insurance companies. We believe this presentation enhances the understanding of our results of operations by highlighting the underlying profitability of our insurance business. Additionally, these measures are a key internal management performance standard. Operating earnings per share is operating income divided by diluted weighted average shares outstanding. Operating return on equity is annualized operating income divided by average common stockholders' equity.Total premiums include gross premiums written through our insurance subsidiaries and produced as managing general agent on behalf of other insurance companies.Other NotesIn October 2010, the Financial Accounting Standards Board issued new guidance concerning the accounting for costs associated with acquiring or renewing insurance contracts. Under the new guidance, only direct incremental costs associated with successful insurance contract acquisitions or renewals are deferrable. We have adopted this guidance early, effective January 1, 2011, and have retrospectively adjusted our previously issued financial information. Adoption of this guidance reduced the carrying value of our deferred acquisition costs as of December 31, 2010, by $78.7 million and Tower Group Inc. stockholders' equity by $42.6 million. Diluted earnings per share for the third quarter 2010 were reduced by $0.12 per share as a result of this change in accounting. |
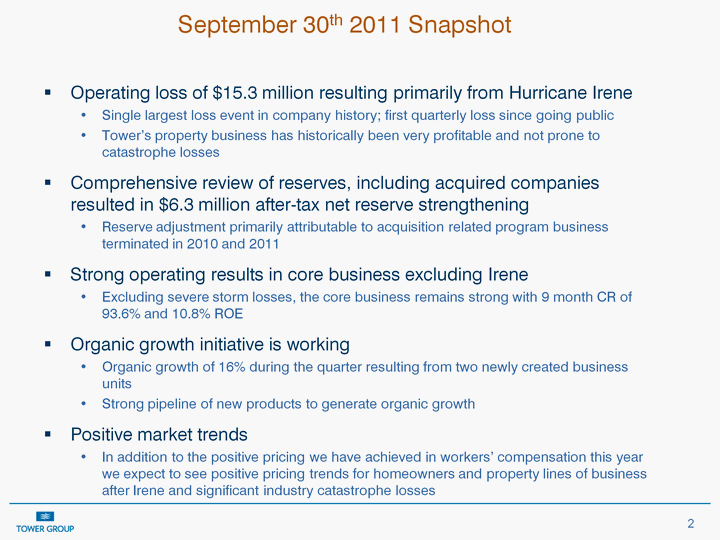
| September 30th 2011 Snapshot Operating loss of $15.3 million resulting primarily from Hurricane IreneSingle largest loss event in company history; first quarterly loss since going public Tower's property business has historically been very profitable and not prone to catastrophe lossesComprehensive review of reserves, including acquired companies resulted in $6.3 million after-tax net reserve strengtheningReserve adjustment primarily attributable to acquisition related program business terminated in 2010 and 2011 Strong operating results in core business excluding IreneExcluding severe storm losses, the core business remains strong with 9 month CR of 93.6% and 10.8% ROEOrganic growth initiative is workingOrganic growth of 16% during the quarter resulting from two newly created business unitsStrong pipeline of new products to generate organic growthPositive market trendsIn addition to the positive pricing we have achieved in workers' compensation this year we expect to see positive pricing trends for homeowners and property lines of business after Irene and significant industry catastrophe losses |

| 3Q11 Highlights * *Tower has repurchased $54.6 million of its common stock and has paid $0.625 per share in dividends since 3Q 2010 . Excluding the effect of storm losses and reserve strengthening, operating earnings would have been $30.1 million in 3Q11 compared to $27.9 million in 3Q10 Excluding the effect of storm losses and reserve strengthening, operating EPS would have been $0.73 in 3Q11 compared to $0.65 in 3Q10 * |
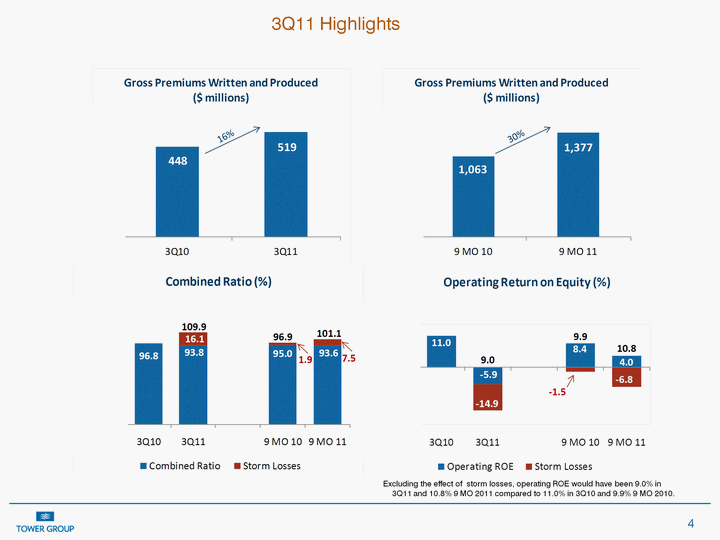
| Excluding the effect of storm losses, operating ROE would have been 9.0% in 3Q11 and 10.8% 9 MO 2011 compared to 11.0% in 3Q10 and 9.9% 9 MO 2010. 3Q11 Highlights |
| Hurricane Irene's Impact on Tower Losses from Irene represented Tower's single largest loss event in its historyHurricane Irene was the first Hurricane to make landfall in the tri-state region (NY, NJ and CT) since Gloria in 1985 and the first to make landfall in NJ since 1903$60M loss from Irene is higher than Tower's total catastrophe losses throughout its history Tower was ranked 6th with 3.9% market share for the lines of business affected by Irene in NJ, NY and CT, but its reported loss was only 1.3% of the total estimated industry loss ($4.5B) Tower's property business has been historically very profitable and not prone to catastrophe lossesTower's homeowners and commercial multiple peril ratio has averaged 50.7% since 2005, with catastrophe losses contributing only a minimal amount to this figureNormal winter storm activity has historically had a minimal impact on Tower's earningsFavorable pricing trends and market opportunityHomeowners and commercial property rates are expected to improve Anticipate meaningful growth opportunity in the 4th quarter and in 2012 |

| Organic Growth Strategy Is Working Strong organic growth in the third quarter (16%) primarily from newly created business unitsAssumed reinsurance and risk sharingEstablished assumed reinsurance and risk sharing as a separate business unitGenerated $61.1 million of new written premiums during the 3rd quarter ($73.2 million of new written premiums year to date) Supporting two Lloyd's syndicates and a select few (re)insurersCustomized solutions Developed regional programs that generated $15.3 million of new written premiums during the 3rd quarter ($66.5 million of new written premiums year to date)Favorable outlook for organic growth Product innovation initiative launched to develop new products in profitable growing marketsMade key senior level hires in the third quarter to substantially improve our business development, product development, and marketing functional areas to support organic growth initiativeDeveloping a growing pipeline of product and other growth initiatives to expand our product offering |

| Tower is Seeing Favorable Pricing Trends Third Quarter1.4% renewal rate increase for all businesses excluding program business and assumed reinsuranceMeaningful rate increases in certain areas, such as California workers' compensation and assumed reinsurance businessesFavorable OutlookContinue to drive meaningful pricing increases in the 4Q and 2012Reviewing pipeline of opportunities, especially homeowners and commercial propertyWell positioned for a market turnSignificantly diversified business platform Made significant investment in people, processes and technologyDespite significant catastrophe activity in 2011, Tower's core business remains very profitable relative to industry. Source: A.M. Best |

| Business Segment Results Commercial Commercial Commercial Personal Insurance General Specialty Services Business Units / Products Business Units / Products Small business; Middle market National Programs, E&S, Customized Solutions, Transportation and Assumed Reinsurance Homeowners and private passenger auto 3Q11 GPW ($ millions) 3Q11 GPW ($ millions) $161.0 $205.7 $152.4 $8.1* 3Q10 GPW ($ millions) 3Q10 GPW ($ millions) 167.8 111.3 168.5 9.0* 3Q11 % of total GPW 3Q11 % of total GPW 31.0% 39.6% 29.4% n/a Commercial Consolidated Commercial Consolidated Commercial Consolidated Loss Ratio 76.4% 76.4% 76.4% 71.8% n/a Expense Ratio 32.5% 32.5% 32.5% 40.6% n/a Combined Ratio 108.9% 108.9% 108.9% 112.4% n/a Retention 76.8% 76.8% 76.8% 89.8% n/a Renewal Change 1.3% 1.3% 1.3% 1.6% n/a Segment Summary * Total revenue for the segment Focus on improving profitability through automation and product enhancement Seeking growth by creating new business units and expanding into specialty classes of business Focus on reducing expenses by replacing OBPL systems Expanding licensing to expand writings in other states and thereby increasing fee income |

| Net Loss and Loss Expense Ratio, Excluding Recipocals Third quarter net adverse development of $9.7 million at Tower stock companies primarily from development on discontinued programs |

| Declining Expense Ratio Increase in premium volume is creating scale advantages for TowerAs systems initiatives relating to personal lines are completed, we expect this scale advantage to increaseYTD 2010 BB&T expenses include $4.1 million of non-recurring New York State workers' compensation surcharges. |

| Improving Investment Performance StrategyAlternative investment commitment remains modest but should provide higher yield and diversification from interest rate risk inherent in fixed-income investments, and reduce capital markets volatility Operating cash flows also invested in opportunistic repurchases of Tower common stock since March 2010Examples of Alternative InvestmentsPrivate equity type investments in small real estate projectsMinority ownership in distribution partners that have a strategic fit with Tower |

| Outlook and Guidance Outlook: Premium GrowthContinued organic growth opportunity from newly created businesses and product innovation initiativeContinued focus on expanding into higher margin specialty businessImproving pricing environment and market opportunitiesFavorable industry pricing trends and market opportunitiesLower expense ratio trends Anticipate greater efficiency realized through scale and integration of acquired companies Investment Income Expect continued growth in investment income due to alternative investments and revised asset allocation Guidance Operating earnings expected to be $1.40 to $1.50 per share for 2011. 2011 operating results include $1.30 per share of severe storm losses through 9 months 20112012: Near term 10% to 12% ROE |
