Attached files
| file | filename |
|---|---|
| 8-K - FORM 8-K - MARRIOTT VACATIONS WORLDWIDE Corp | d251889d8k.htm |
 Marriott
Vacations Worldwide Corporation
November 2011
Exhibit 99.1 |
  Forward-Looking Statements
1
This presentation contains “forward-looking statements” within the meaning of
federal securities laws, including statements about future properties and their
anticipated contributions to our operating results; the construction and sales pace
for new properties, upcoming sales of timeshare mortgage notes, and similar statements
concerning anticipated events that are not historical facts. We caution you that
these statements are not guarantees of future performance and are subject to numerous
risks and uncertainties, including volatility in the economy and the credit markets;
supply and demand changes for vacation ownership and residential products; competitive
conditions; the availability of capital to finance growth; and other matters referred
to under the heading “Risk Factors” in our most recent Registration
Statement on Form 10 filed with the U.S Securities and Exchange Commission, any of
which could cause actual results to differ materially from those expressed in or
implied in this presentation. These statements are made as of November 7, 2011
and we undertake no obligation to publicly update or revise any forward-looking
statement, whether as a result of new information, future events, or otherwise.
Throughout this presentation we report certain financial measures, each identified with the
symbol "†," that are not prescribed or authorized by United States
generally accepted accounting principles (“GAAP”). We discuss our reasons
for reporting these non-GAAP measures and reconcile each to the most directly
comparable GAAP measure at the end of these
slides. |
  Introduction
2
Stephen P. Weisz
President and
Chief Executive Officer
John E. Geller, Jr.
Executive Vice President and
Chief Financial Officer
Jeff Hansen
Vice President, Investor Relations |
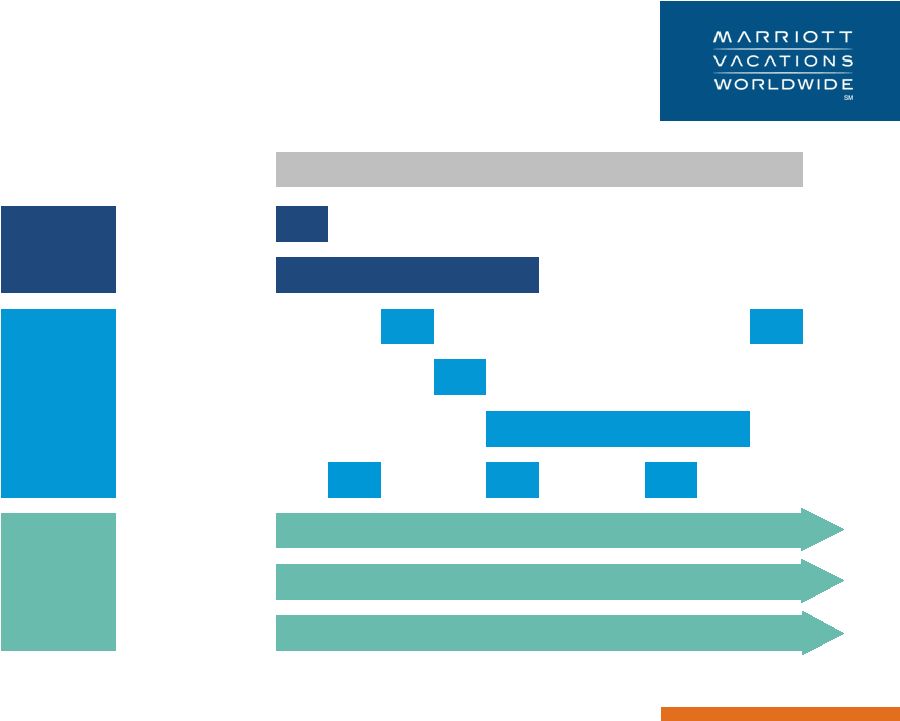
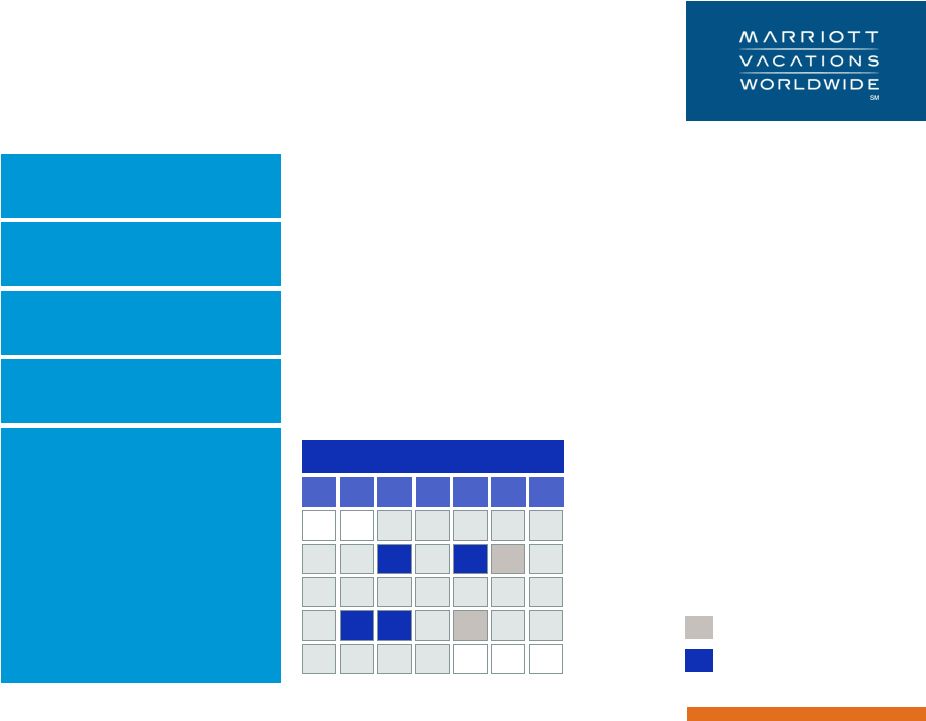  Transaction overview
3
Ticker
NYSE: VAC
Shares outstanding
36.2 million
(1)
Distribution ratio
1 VAC share per 10 MAR shares
Key dates
Issuer
Marriott Vacations Worldwide Corporation
“When-issued”
trading begins
November 8
Road show
November 7 –
17
Record date
November 10
Dividend payment date
November 21
“Regular-way”
trading begins
November 22
30
November
S
T
W
T
F
M
S
6
13
27
16
17
18
19
14
23
24
25
26
22
21
29
28
9
10
11
12
8
7
5
1
20
4
2
3
15
Public holidays
Key spin dates
(1) Reflects shares estimated to be outstanding as of the dividend payment
date. |
  Investment highlights
4
Industry leader with established brands
Experienced management team and distinguished board of directors
Strong cash flow upside from built inventory and land
Diversified revenue streams
Favorable long-term industry dynamics
Optimized capital structure with financial flexibility |
  5
Maui Ocean Club
Ka’anapali, Hawaii |
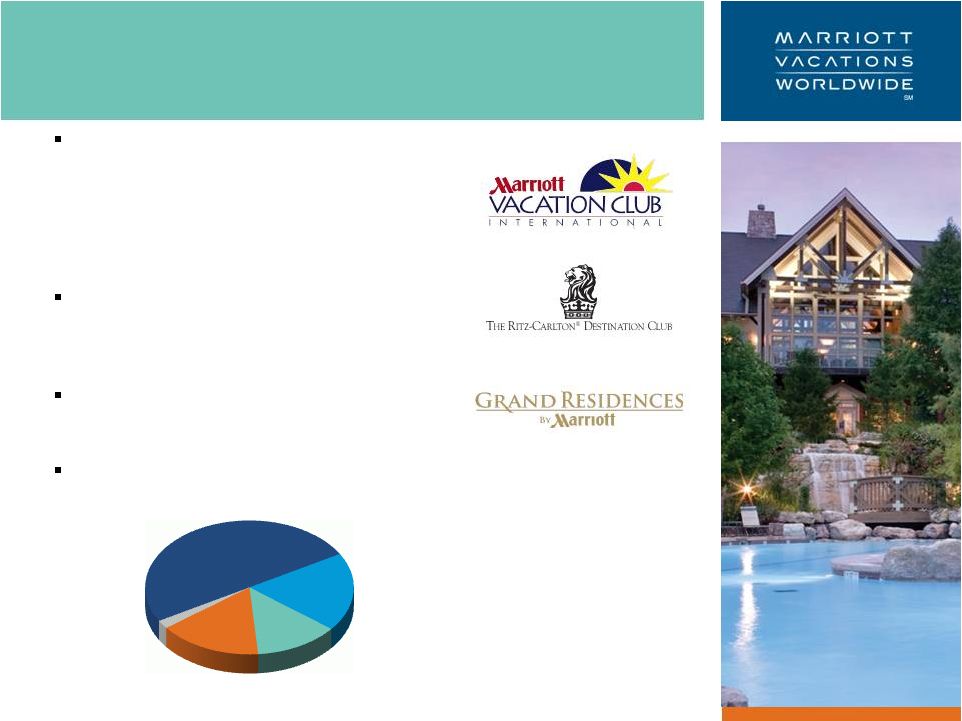  Marriott
Vacations Worldwide Corporation (“VAC”) is an industry leader in the
upscale and luxury vacation ownership segments
–
over 400,000 owners
–
64 vacation and resort destinations,
globally
With the spin-off, VAC will have exclusive
rights to the Marriott and The Ritz-Carlton
brand names as they pertain to the vacation
ownership business
For these exclusive, strategic and long-term
rights, VAC will pay Marriott International an
annual royalty fee
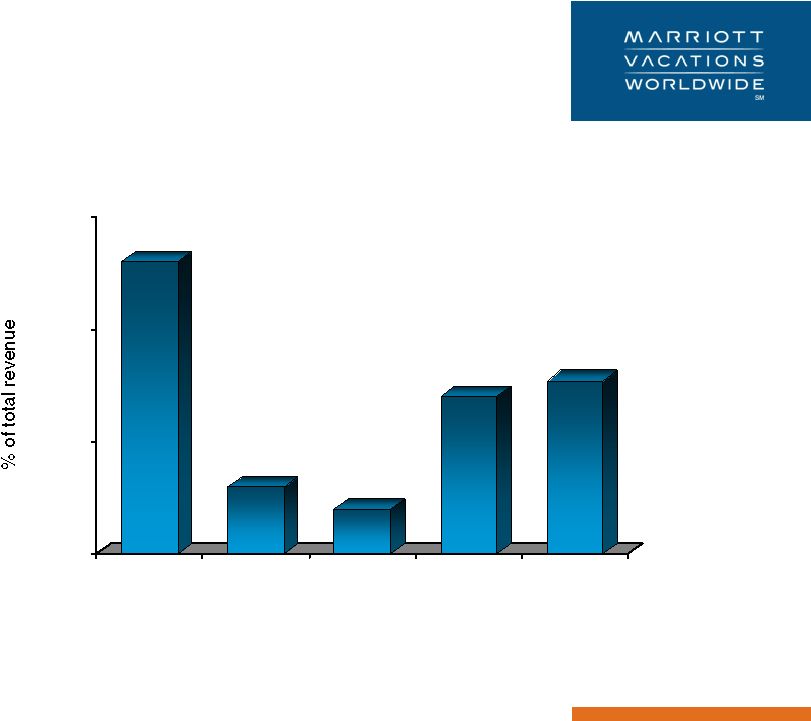
Revenue is derived from diverse sources and
nearly half is recurring and stable
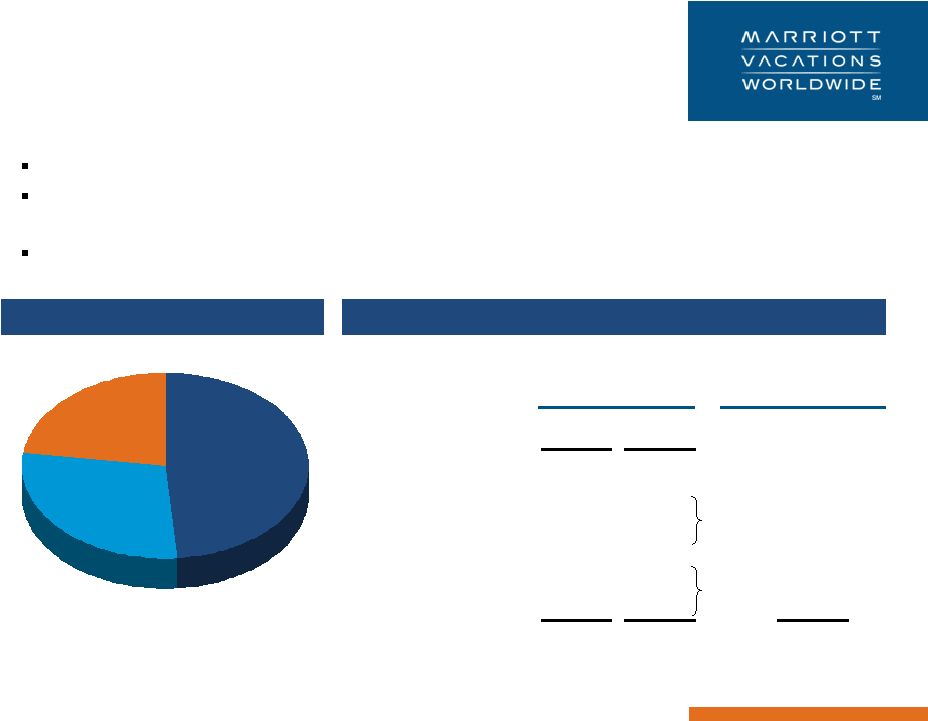
Who we are
6
Total revenue
(1)†
:
$1.3 billion
(1) 2011E revenue, excluding cost reimbursements.
Sales of
vacation
ownership
products, 50%
Resort
management
and other
services, 19%
Financing, 13%
Rental, 16%
Other, 2% |
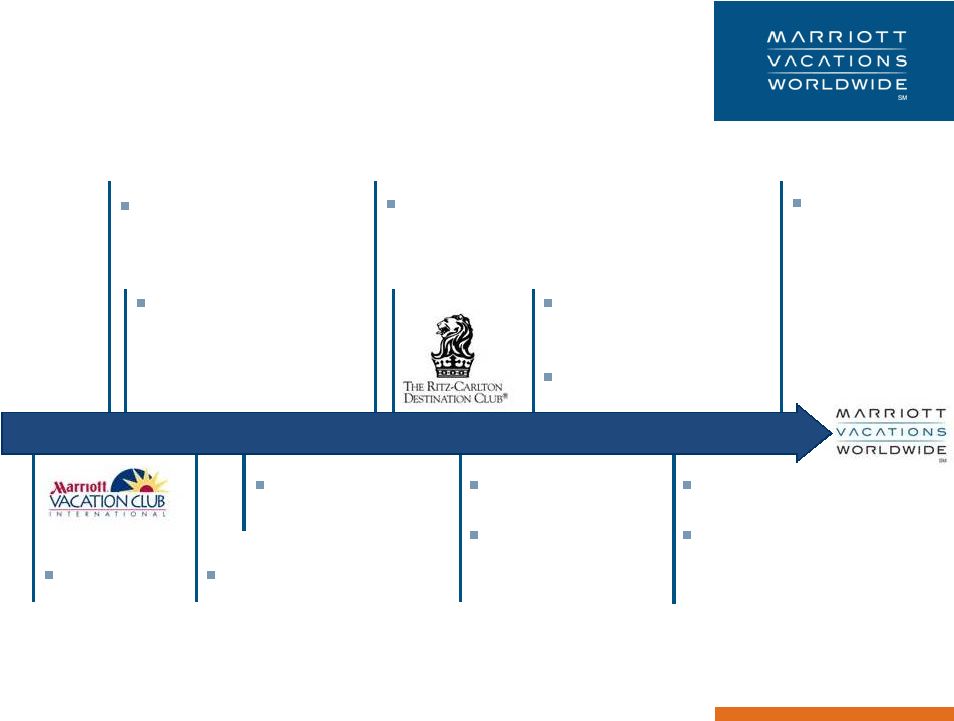  7
Long history of success
20 resorts
100,000 owners
40 resorts
200,000 owners;
Asia expansion
400,000 owners
Introduction of North
America points-based
product
Over $100 million in
annual vacation
ownership sales
Over $500 million in
annual vacation
ownership sales
Introduction of Asia
points product
60 resorts
Announced
spin-off from
Marriott
International
50,000 owners
1984
1993
1997
1999
2001
2009
2010
2011
3 resorts |
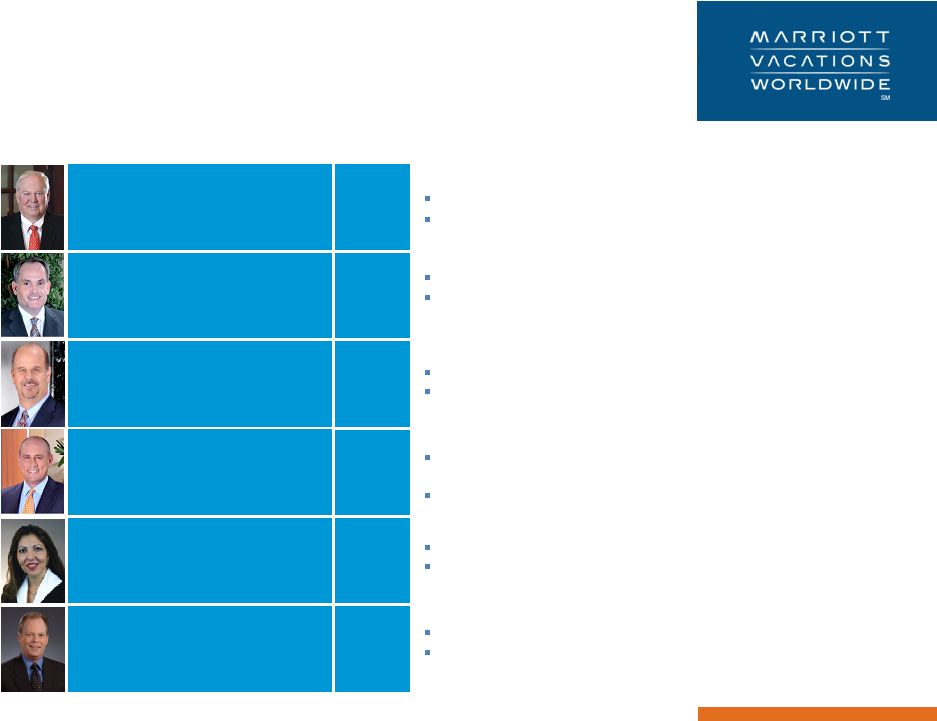  Experienced management team
8
Stephen P. Weisz,
President and CEO
President of VAC since 1996
Serves as trustee of the American Resort Development Association
John E. Geller, Jr.,
Executive Vice President
and CFO
Served in current role since 2009
Previously served as the CFO of AutoStar Realty, and partner at
Ernst & Young
R. Lee Cunningham,
Executive Vice President and COO,
North America & Caribbean
Brian E. Miller
Executive Vice President, Sales,
Marketing and Service Operations
Lani Kane-Hanan
Executive Vice President and Chief
Growth and Inventory Officer
James H. Hunter, IV
Executive Vice President and General
Counsel
Held roles at property, regional and corporate levels
Served in current role since 2007
More than 25 years of vacation ownership marketing and sales
expertise
Served in current role since 2007
Served in current role since 2009
Before joining Marriott, spent 14 years in public accounting and
advisory firms
Served in current role since 2006
Before joining Marriott, Mr. Hunter was an associate at the law firm
of Davis, Graham & Stubbs in Washington, D.C.
39 years
6 years
29 years
21 years
11 years
17 years
Marriott
tenure |
  Distinguished Board of Directors
9
Raymond L. "Rip" Gellein, Jr.
Chairman of the Board, Strategic Hotels and Resorts, Inc.; Retired President,
Global Development Group of Starwood Hotels and Resorts Worldwide;
Former Chairman and CEO, Starwood Vacation Ownership, Inc.
Deborah Marriott Harrison
Senior Vice President, Government Affairs, Marriott International, Inc.
Thomas J. Hutchinson III
Chairman, Legacy Hotel Advisors, LLC and Legacy Healthcare Properties,
LLC; Former CEO of CNL Hotels & Resorts
Melquiades R. (Mel) Martinez
Regional Chairman of JPMorgan Chase for Florida, Mexico, Central
America
and the Caribbean; Former United States Senator from Florida; Former
Secretary of HUD
William W. McCarten
Chairman, DiamondRock Hospitality Company; Former CEO of HMS Host
Corporation
Stephen P. Weisz
President and Chief Executive Officer, Marriott Vacations Worldwide
Corporation
William J. Shaw, Chairman
Retired Vice Chairman, Marriott International, Inc.; Former President and
COO, Marriott International, Inc. |
  Timber
Lodge South Lake Tahoe, California
10 |
  $1
$1
$1
$1
$1
$1
$1
$1
$1
$1
$1
$1
$1
$2
$2
$2
$2
$3
$3
$4
$4
$5
$6
$7
$8
$9
$10
$11
$10
$6
$6
$0
$0
$0
$0
$0
$0
$2
$4
$6
$8
$10
$12
$14
$16
0
1
2
3
4
5
6
7
8
Total annual sales
Cumulative intervals sold
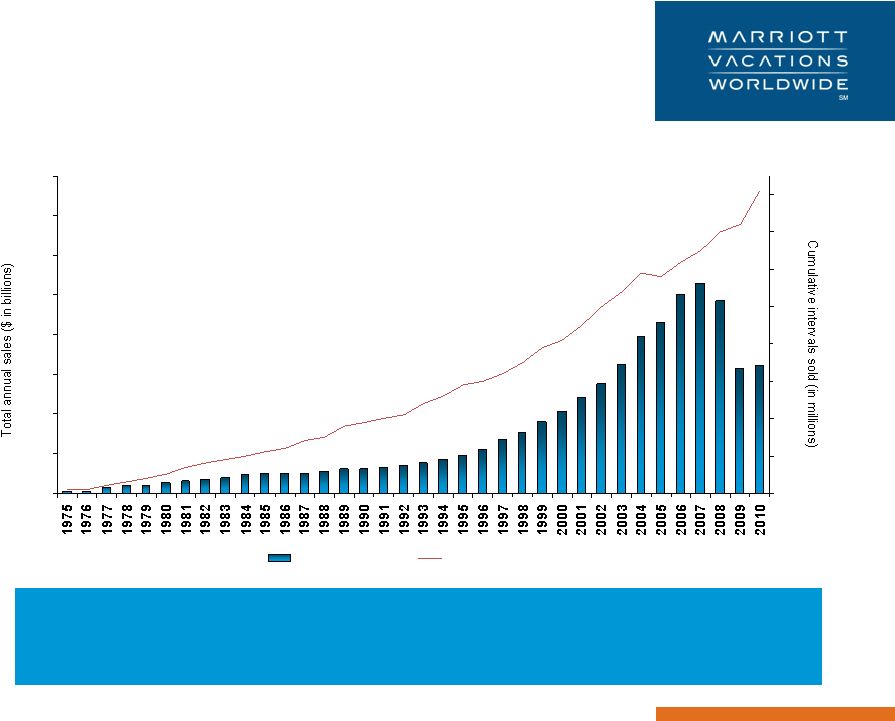
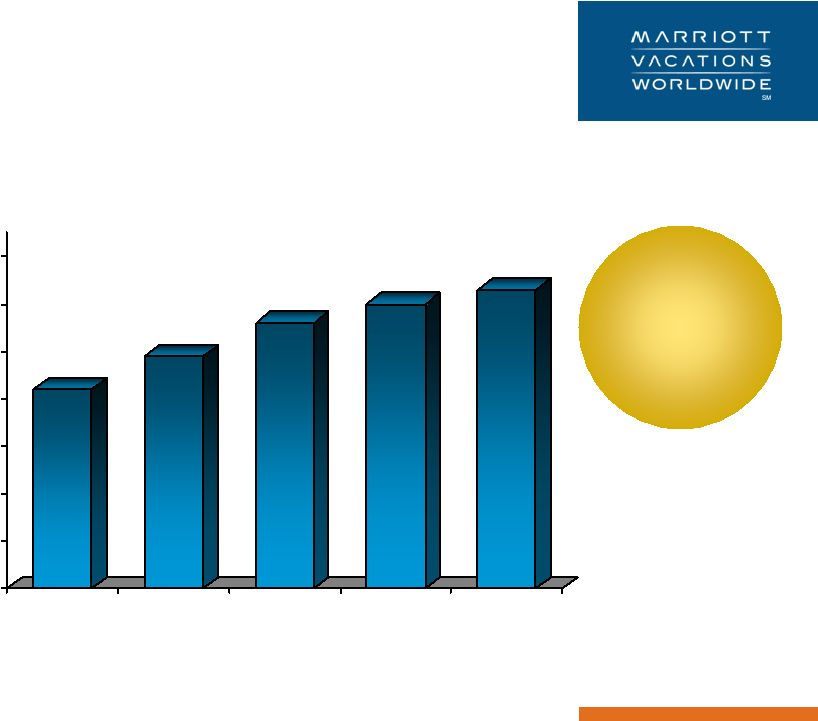
11
Favorable industry dynamics
The size of the target demographic market and current number of
vacation owners would imply an 8% penetration rate with potential
for meaningful upside
Source: ARDA |
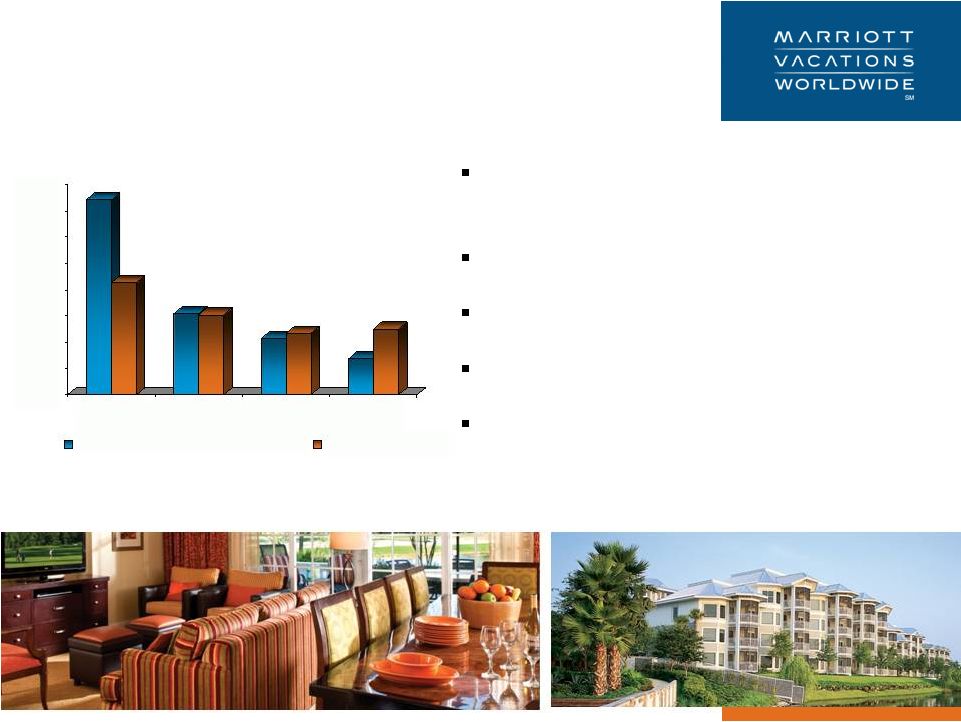
  81%
92%
80%
93%
82%
92%
80%
91%
79%
92%
91%
0%
20%
40%
60%
80%
100%
2006
2007
2008
2009
2010
2011
YTD
Industry average
VAC
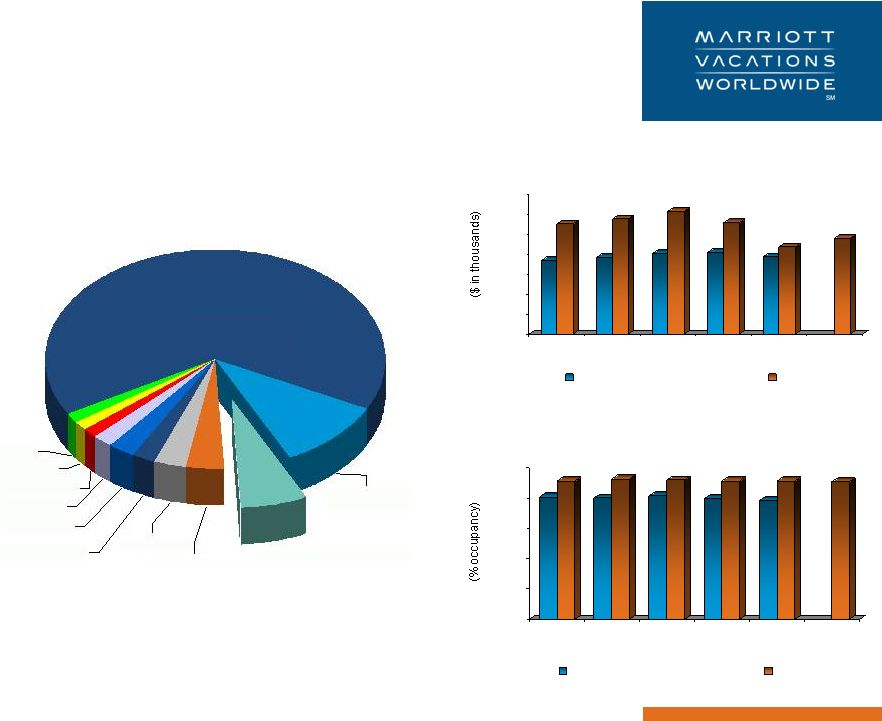
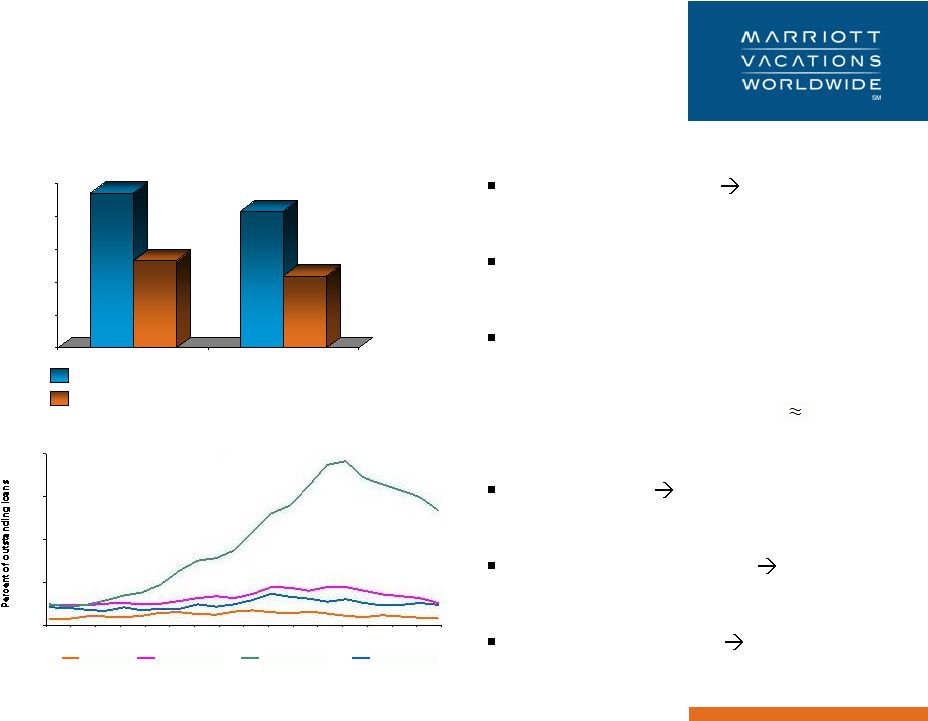
Quality leader in a fragmented
industry
12
2010 timeshare units
Sales price per contract
Occupancy
$19
$28
$19
$29
$20
$31
$20
$28
$19
$22
$24
$0
$5
$10
$15
$20
$25
$30
$35
2006
2007
2008
2009
2010
2011
YTD
Industry average
VAC
Note:
VAC reflects North America sales per contract and occupancy.
2011 YTD industry data for sales per contract and occupancy not currently available.
Disney, 1.8%
Holiday Inn, 1.5%
Silverleaf, 1.4%
Hilton, 2.4%
Hapimag, 2.9%
Starwood
, 2.4%
Wyndham, 10.4%
Marriott Vacations Worldwide,
6.5%
Bluegreen, 3.6%
Villa, 1.4%
Other, 65.7%
Source: Company filings, Vacation Ownership World Magazine – April 2011, ARDA
|
  13
Shadow Ridge
Palm Desert, California |
  Economics of a timeshare consumer
14
Year
1
Year
20
Initial
sale
Initial sale
Financing income
Incremental
business
opportunities
Rentals
Additional purchases
Financing income
Referrals
Stable
recurring
revenue base
Club dues
Management fee
On-site spending
Note: Case study of hypothetical consumer that finances their purchase through VAC.
|
  15
Existing inventory drives growth
Modest near-term inventory spending requirements will allow VAC to harvest cash
flow VAC expects its points-based programs will allow the Company to more
effectively manage
inventory
by
aligning
spending
with
sales
pace
and
future
development
needs
Potential land and bulk inventory sales could also generate meaningful cash proceeds
Future
infrastructure
29%
In-process
23%
Completed
49%
Total inventory: $1.0 billion
Year End 2011E
Estimated Future
Contract Sales
-
-
125
-
1,335
1,460
$
840
930
4,230
6,000
$
$
320
230
-
275
-
825
$
$
Incurred
Potential
Spend
Completed
Under construction
Cost to complete
Future phases
Cost to complete
Total North America
($ in Millions)
Total inventory
North America inventory
Note: As of 9/17/2011. |
  16
Capital efficient points product
Consumers buy the system rather than
location
Broader appeal
Ability to sell indefinitely at all galleries
Streamlined sales and marketing process
Over 365,000
owners with 550,000
weeks
Note:
All figures as of third quarter 2011 and include North America owners only.
($ in millions)
Optimization for sale
Note:
Real estate inventory spending does not include non-capitalizable
expenses associated with Cost of Vacation Ownership Products.
Cost of sales reflects real estate inventory costs.
†
$0
$100
$200
$300
$400
$500
$600
$700
$800
2008
2009
2010
2011E
Real estate inventory spending
Cost of sales
16 |
  Kauai
Beach Club Lihue, Kauai
17 |
  Growing margins through a balanced
approach to profitability
18
13%
3%
2%
7%
7% - 8%
0%
5%
10%
15%
2007
2008
2009
2010
2011E
Adjusted EBITDA margins
†
Note: Pro forma for Marriott royalty fees. |
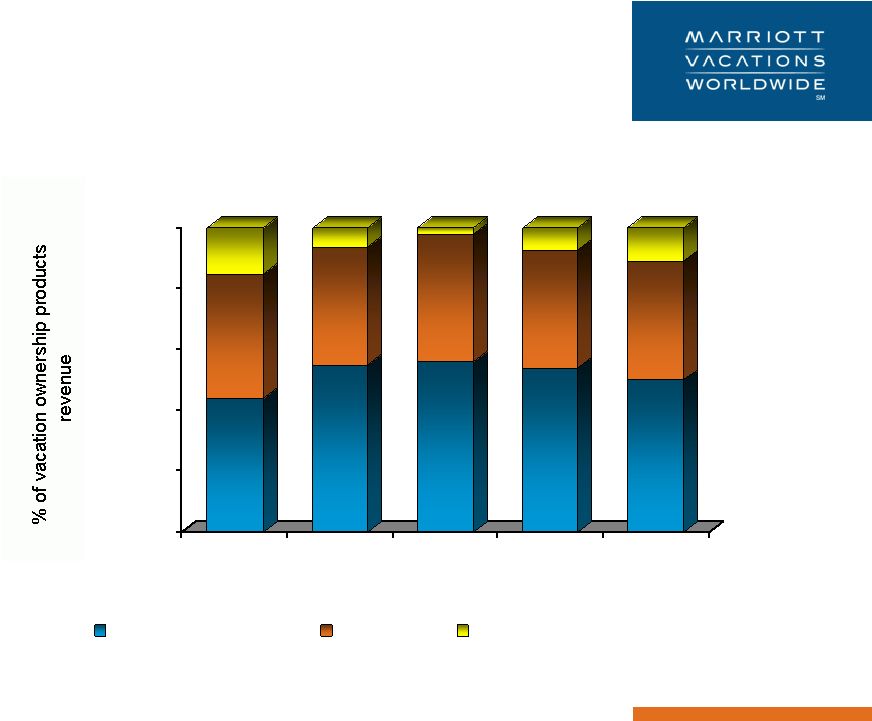  Improving product cost and
marketing and sales margins
19
44%
41%
15%
55%
39%
6%
56%
42%
2%
54%
39%
7%
49%-51%
38%-40%
9%-13%
0%
20%
40%
60%
80%
100%
2007
2008
2009
2010
2011E
Marketing & sales cost
Product cost
Development margin
Development margins
Note: Sales of vacation ownership products revenue, net of expenses is
sales of vacation ownership products revenue less cost of vacation ownership products
expense and
marketing and sales expense. |
  Recurring management fee revenue
20
$42
$49
$56
$60
$62 -
$64
$0
$10
$20
$30
$40
$50
$60
$70
2007
2008
2009
2010
2011E
14%
CAGR
from 2001
to 2011
($ in millions) |
  Profitable consumer financing
21
Financing
revenue
$0
$40
$80
$120
$160
$200
2010
2011E
$163 -
$168
$188
$106
$85 -
$90
Financing
revenue,
net
of
financing
expenses
and
consumer
financing
interest
expense
Financing activity
Note: +60 Days Delinquency experience.
Source: RBS and Moody’s
Delinquencies
Typical loan coupon
12.5% -
13.5%
No prepayment penalties
Convenient and easy
–
Low monthly payments
$315
Average
term
10
years
Minimum
downpayment
10%
Average
FICO
score
737
($ in millions)
†
0%
5%
10%
15%
20%
Mar-06
Jul-06
Nov-06
Mar-07
Jul-07
Nov-07
Mar-08
Jul-08
Nov-08
Mar-09
Jul-09
Nov-09
Mar-10
Jul-10
Nov-10
Mar-11
Auto
Credit card
Home equity
Timeshare |
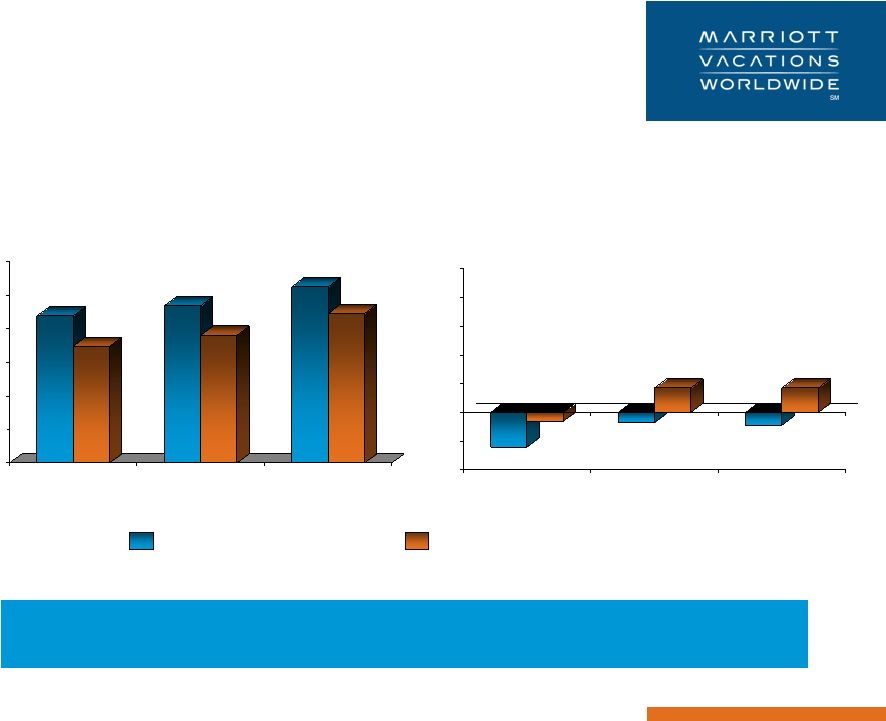  22
Improving rental results
$0
$40
$80
$120
$160
$200
$240
2009
2010
2011E
($40)
($20)
$0
$20
$40
$60
$80
$100
2009
2010
2011E
$205 -
$215
$175
$139
$187
$152
$175 -
$180
$(24)
$(6)
$(7)
$17
$15 -
$20
$(7) -
$(12)
All segments
North America segment
Rental revenue
Rental revenue, net of expenses
($ in millions)
Maintenance fees from unsold inventory totaled $68 million in 2010
and an estimated $58 million to $61 million in 2011 |
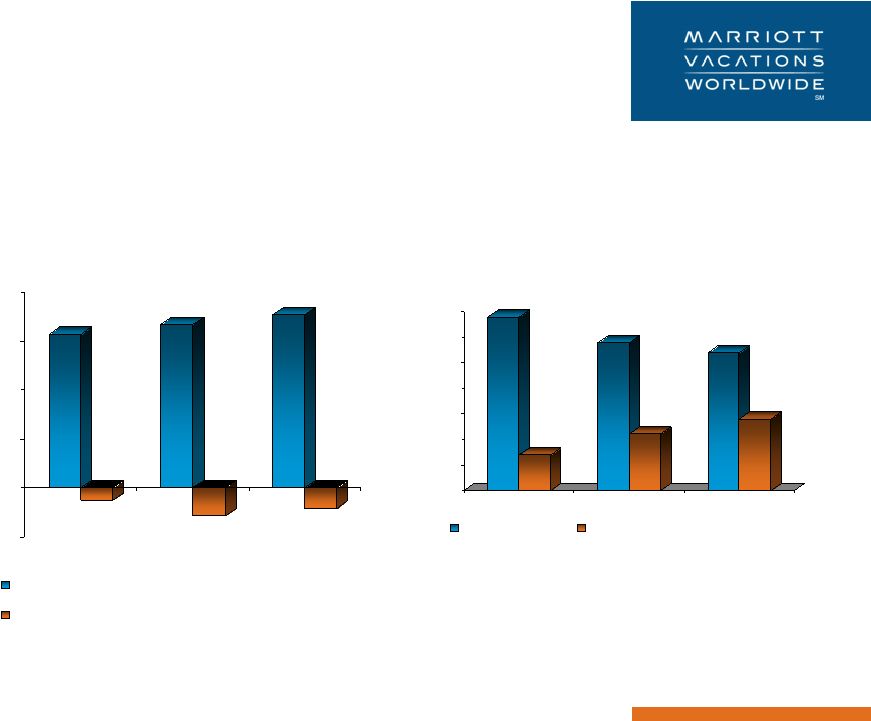  Diversified revenue streams
23
$157
$(13)
$167
$(29)
$175-$180
$(18)-$(23)
($50)
$0
$50
$100
$150
$200
2009
2010
2011E
Resort management and other services revenue
Resort management and other services revenue, net
of expenses
$34
$7
$29
$11
$25-$30
$12-$17
$0
$5
$10
$15
$20
$25
$30
$35
2009
2010
2011E
Other revenue
Other revenue, net of expenses
Resort management and other
services revenue excluding
management fees
†
Other revenue and expenses
($ in millions) |
  Pro
forma capital structure 24
Corporate debt:
Revolving credit facility
-
Availability
$200
Other
3
Total corporate debt
$3
Preferred equity
$40
Total corporate debt + preferred
$43
Total debt / 2011E EBITDA
0.4x
Total liquidity
$200
Other non-recourse debt:
Warehouse facility
$125
Securitized vacation ownership debt
830
Total non-recourse debt:
$955
Note: Pro forma for the closing of the $200 million corporate credit facility, the $300
million warehouse facility, and the preferred equity offering. 3Q 2011
($ in millions) |
  25
Pro forma adjusted EBITDA
†
$ 62 -
64
170 -
175
(134) -
(137)
$ 95 -
$105
2011E
$ 66
184
(134)
$ 116
2012 contract
sales scenarios
0%
$ 66
196
(135)
$ 127
+5%
$ 66
207
(135)
$ 138
+10%
Management fee revenue
Timeshare
General and
administrative expenses
(1)
Total pro forma adjusted
EBITDA
†
Estimated proceeds of undeveloped land and excess luxury
inventory over next 3 years
$150 million to $200 million
($ in millions)
(1) Includes royalty fee expense. |
  Investment highlights
26
Industry leader with established brands
Experienced management team and distinguished board of directors
Strong cash flow upside from built inventory and land
Diversified revenue streams
Favorable long-term industry dynamics
Optimized capital structure with financial flexibility |
  27
In our conference materials and related webcast we report certain financial measures that
are not prescribed or authorized by U. S. generally accepted accounting principles
(“GAAP”). We discuss management’s reasons for reporting these non-GAAP measures
below, and the tables on the following pages reconcile the most directly comparable GAAP
measures to the non-GAAP measures (identified by a “†” symbol on
the following pages and in the related materials) that we refer to in our conference materials and
related webcast. Although management evaluates and presents these non-GAAP
measures for the reasons described below, please be aware that these non-GAAP
measures are not alternatives to revenue, net income, or any other comparable operating
measure prescribed by GAAP. In addition, these non-GAAP financial measures may be
calculated and/or presented differently than measures with the same or similar names
that are reported by other companies, and as a result, the non-GAAP measures we report
may not be comparable to those reported by others. Earnings before interest, taxes, depreciation and amortization (EBITDA), reflects earnings
excluding the impact of interest expense, provision for income taxes, depreciation
and amortization. Our management considers EBITDA to be an indicator of operating
performance, and we use it to measure our ability to service debt, fund capital
expenditures, and expand our business. EBITDA is used by analysts, lenders, investors
and others, as well as by us, to evaluate companies because it excludes certain items that can
vary widely across different industries or among companies within the same industry. For
example, interest expense can be dependant on a company’s capital structure,
debt levels and credit ratings. Accordingly, the impact of interest expense on earnings
can vary significantly among companies. The tax positions of companies can also vary
because of their differing abilities to take advantage of tax benefits and because of
the tax policies of the jurisdictions in which they operate. As a result, effective tax rates
and provisions for income taxes can vary considerably among companies. EBITDA also
excludes depreciation and amortization because companies utilize productive assets of
different ages and use different methods of both acquiring and depreciating
productive assets. These differences can result in considerable variability in the relative
costs of productive assets and the depreciation and amortization expense among
companies.
Non-GAAP Financial Measures and
Reconciliations
Non-GAAP Financial Measures
Earnings Before Interest, Taxes, Depreciation and Amortization |
  28
Adjusted EBITDA
Management also evaluates Adjusted EBITDA as an indicator of operating performance. Our
Adjusted EBITDA includes the impact of interest expense associated with our
debt from the securitization of our notes receivable and the
utilization of our warehouse facility. We include interest expense related to debt
from securitization of our notes receivable and utilization of our warehouse facility
in determining Adjusted EBITDA as the debt is secured by notes receivable that have
been sold to bankruptcy remote special purposes entities or pledged to the warehouse, and
generally is not recourse to us or to our business. For our estimated fiscal year 2011
Adjusted EBITDA calculation, we also exclude the impact of the impairment charges we
expect to record in the 2011 third quarter. We evaluate Adjusted EBITDA, which
adjusts for these items to allow for period-over-period comparisons of our ongoing core operations
before material charges, and we use it to measure our ability to
service our non-securitized debt. Adjusted EBITA also
facilitates our comparison of results from our ongoing operations with results from other
vacation ownership companies. Total Revenues Excluding Cost Reimbursements
Cost reimbursements revenue includes direct and indirect costs that property
owners’ associations and joint ventures
we participate in reimburse to us, and relates, predominantly, to payroll costs where we are
the employer. As we record cost reimbursements based upon costs incurred with no
added markup, this revenue and related expense has no impact on net income
attributable to us because cost reimbursements revenue net of reimbursed costs expense is
zero. We consider total revenues excluding costs reimbursements to be a meaningful metric as
it represents that portion of revenue that impacts net income attributable to
us. Cost of Sales (Real Estate Inventory Costs)
Cost of sales (Real Estate Inventory Costs) reflects Costs of Vacation Ownership Products
associated with the overall project development process and excludes costs that were
not initially capitalized. Management evaluates Cost of Sales (Real Estate
Inventory Costs), as it represents the direct costs to develop and construct
projects, and it is used in our measurement of our real estate inventory capital
efficiency as we compare the cash outflow for real estate inventory spending in a
given year to the Cost of Sales (Real Estate Inventory Costs) charged to expense for that same
year related to sales of vacation ownership products.
Non-GAAP Financial Measures and
Reconciliations |
  29
Financing Revenue, Net of Financing Expenses and Consumer Financing Interest Expense
Financing revenues, net of financing expenses and consumer financing interest expense
includes interest income earned on notes receivable as well as fees earned from
servicing the existing loan portfolio, net of direct costs to
support the financing, servicing and securitization processes, as well as consumer financing
interest expense. We believe it is a meaningful measure as it highlights the
overall profitability of our financing business. Resort Management and Other Services
Revenue Excluding Management Fees Resort Management and Other Services Revenues
Excluding Management Fees include revenues we earn from providing ancillary offerings
(including food and beverage, retail, and golf and spa offerings), and for providing other
services to our guests and excludes fees we earn from managing our resorts. We
consider this to be meaningful as it highlights the variable revenue streams we
receive from our ancillary operations. General and Administrative Expenses Including
Royalty Fee Expense General and administrative expenses including royalty fee expense
includes the general and administrative costs to support MVW’s operations as
well as payment of an estimated royalty fee to Marriott International under the Marriott
and Ritz-Carlton license agreements (as if the spin-off had occurred on the first
day of 2007). We believe this combined measure is meaningful as it measures the
total overhead costs in support of the entire development,
financing, resort management and rental businesses.
Non-GAAP Financial Measures and
Reconciliations |
  30
Fiscal Year
2007
Fiscal Year
2008
Fiscal Year
2009
Fiscal Year
2010
Fiscal Year
2011E
Total revenue
2,240
$
1,916
$
1,596
$
1,584
$
1,632
$
Less: reimbursed costs
(312)
(304)
(312)
(318)
(325)
Total revenue excluding reimbursed costs
†
1,928
$
1,612
$
1,284
$
1,266
$
1,307
$
†
Denotes non-GAAP financial measures.
($ in millions)
Total Revenue Excluding Cost Reimbursements
Cost of Sales (Real Estate Inventory Costs)
Fiscal Year
2008
Fiscal Year
2009
Fiscal Year
2010
Fiscal Year
2011E
Cost of vacation ownership products
430
$
314
$
247
$
260
$
Less: non-capitalizable expenses
(2)
(9)
(13)
(10)
Cost of sales (real estate inventory costs)
†
428
$
305
$
234
$
250
$
†
Denotes non-GAAP financial measures.
Non-GAAP Financial Measures and
Reconciliations |
  31
Financing Revenue, Net of Financing Expenses
and Consumer Financing Interest Expense
Resort Management and Other Services Revenue Excluding Management Fees
($ in millions)
Fiscal Year
2010
Fiscal Year
2011E
Financing revenue
188
$
166
$
Less: financing and other expenses
(44)
(41)
Less: consumer financing interest expense
(56)
(52)
Add back: other expenses
18
14
Financing Revenue, net of financing expenses
and consumer financing interest expense
†
106
$
87
$
†
Denotes non-GAAP financial measures.
Fiscal Year
2009
Fiscal Year
2010
Fiscal Year
2011E
Resort management and other services revenue
213
$
227
$
240
$
Less: management fees
(56)
(60)
(63)
Resort management and other services revenue
excluding management fees
†
157
$
167
$
177
$
†
Denotes non-GAAP financial measures.
Non-GAAP Financial Measures and
Reconciliations |
  32
General and Administrative Expenses Including Royalty Fee Expense
($ in millions)
Non-GAAP Financial Measures and
Reconciliations
Fiscal Year
2011E
Fiscal Year
2012E
General and administrative expenses
80
$
78
$
Add: royalty fee expense
1
63
65
General and administrative expenses
including royalty fee expense
†
143
$
143
$
†
Denotes non-GAAP financial measures.
1
All years have been adjusted as if the royalty agreement had been in place for all
years. |
  33
Adjusted Pro Forma EBITDA
($ in millions)
Non-GAAP Financial Measures and
Reconciliations
Fiscal Year
2007
Fiscal Year
2008
Fiscal Year
2009
Fiscal Year
2010
Adjusted EBITDA
†
323
$
118
$
85
$
155
$
Less: Royalty fee expense
1
(77)
(75)
(65)
(64)
Adjusted Pro Forma EBITDA
†
246
$
43
$
20
$
91
$
†
Denotes non-GAAP financial measures.
1
All years have been adjusted as if the royalty agreement had been in place for all
years. |
  34
EBITDA and Adjusted EBITDA
($ in millions)
Non-GAAP Financial Measures and
Reconciliations
Fiscal Year
2011E
Fiscal Year
2012E (flat)
1
Fiscal Year
2012E (+5%)
1
Fiscal Year
2012E (+10%)
1
Net income (loss)
2
$(162) -
(169)
41
$
48
$
55
$
Interest expense
61
64
64
64
Tax provision (benefit), continuing operations
(99) -
(102)
29
33
37
Depreciation and amortization
33
31
31
31
EBITDA
†
(167) -
(177)
165
$
176
$
187
$
Impairment charge
324
-
-
-
Consumer financing interest expense
(52)
(49)
(49)
(49)
Adjusted EBITDA
†
$ 95 -
105
116
$
127
$
138
$
†
Denotes non-GAAP financial measures.
1
Refers to percentage increase in company owned contract sales from Fiscal Year
2011E. 2
2011E has been adjusted to include a $63 million royalty fee as if the royalty
agreement had been in place for the full year and includes an estimated $12
million of expenses related to being a public company. |
  35
EBITDA and Adjusted EBITDA
($ in millions)
Fiscal Year
2007
Fiscal Year
2008
Fiscal Year
2009
Fiscal Year
2010
Net income (loss)
177
$
(16)
$
(532)
$
67
$
Interest expense
-
-
-
56
Tax provision (benefit), continuing operations
107
25
(231)
45
Depreciation and amortization
39
46
43
39
EBITDA
†
323
$
55
$
(720)
$
207
$
Restructuring charges
-
19
44
-
Impairment charge
-
44
761
4
Consumer financing interest expense
-
-
-
(56)
Adjusted EBITDA
†
323
$
118
$
85
$
155
$
†
Denotes non-GAAP financial measures.
Non-GAAP Financial Measures and
Reconciliations |