Attached files
| file | filename |
|---|---|
| 8-K - 8-K - MFA FINANCIAL, INC. | a11-29307_28k.htm |
Exhibit 99.1
|
|
November 2011 |

|
|
2 When used in this presentation or other written or oral communications, statements that are not historical in nature, including those containing words such as “will,” “believe,” “expect,” “anticipate,” “estimate,” “plan,” “continue,” “intend,” “should,” “could,” “would,” “may” or similar expressions, are intended to identify “forward-looking statements” for purposes of Section 27A of the Securities Act of 1933, as amended, and Section 21E of the Securities Exchange Act of 1934, as amended, and, as such, may involve known and unknown risks, uncertainties and assumptions. These forward-looking statements include information about possible or assumed future results with respect to our business, financial condition, liquidity, results of operations, plans and objectives. Statements regarding the following subjects, among others, may be forward-looking: changes in interest rates and the market value of MFA’s MBS; changes in the prepayment rates on the mortgage loans securing MFA’s MBS; MFA’s ability to borrow to finance its assets; implementation of or changes in government regulations or programs affecting MFA’s business; MFA’s ability to maintain its qualification as a REIT for federal income tax purposes; MFA’s ability to maintain its exemption from registration under the Investment Company Act of 1940, including statements regarding the Concept Release issued by the Securities and Exchange Commission relating to interpretive issues under the 1940 Act with respect to the status under the 1940 Act of companies that are engaged in the business of acquiring mortgages and mortgage-related interests; and risks associated with investing in real estate assets, including changes in business conditions and the general economy. These and other risks, uncertainties and factors, including those described in the annual, quarterly and/or current reports that MFA files with the SEC, could cause MFA’s actual results to differ materially from those projected in any forward-looking statements that it makes. These forward-looking statements are based on beliefs, assumptions and expectations of MFA’s future performance, taking into account all information currently available. Readers are cautioned not to place undue reliance on these forward-looking statements, which speak only as of the date on which they are made. New risks and uncertainties arise over time and it is not possible to predict those events or how they may affect MFA. Except as required by law, MFA is not obligated to, and does not intend to, update or revise any forward-looking statements, whether as a result of new information, future events or otherwise. Forward Looking Statements |
|
|
3 MFA is an internally managed REIT positioned to benefit from investment in both Agency and Non-Agency Residential MBS |
|
|
4 Non-Agency MBS remain available at significant discounts to par value. Agency MBS continue to benefit from a steep yield curve. Our goal remains to generate double-digit ROEs with appropriate levels of leverage. Experienced Management Team Focused on Residential MBS Opportunities |
|
|
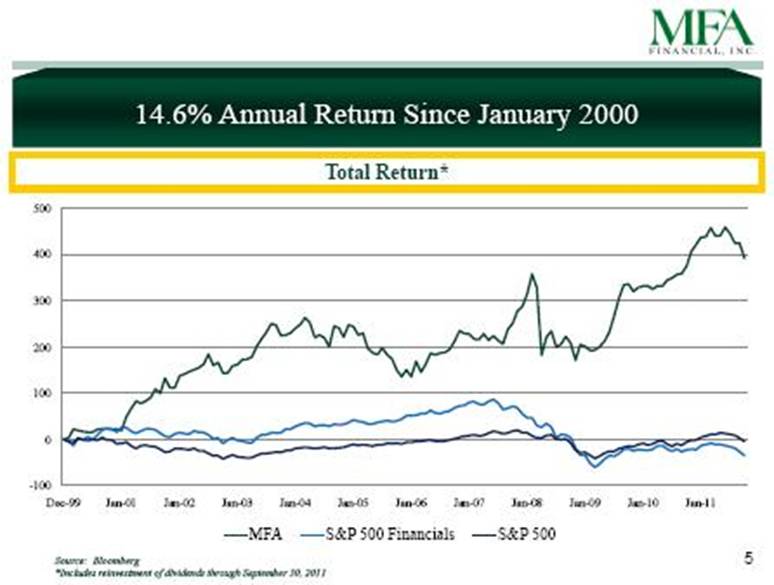
5 14.6% Annual Return Since January 2000 Source: Bloomberg *Includes reinvestment of dividends through September 30, 2011 Total Return* |
|
|
6 MFA Asset Allocation Strategy Investment in Residential MBS Including Both Agency MBS and Non-Agency MBS Information presented with respect to Non-Agency MBS, related repurchase agreement borrowings and resulting totals are presented on a Non-GAAP basis. For a GAAP reconciliation of such items, see Annex 1. Represents borrowings under repurchase agreements, securitized debt and payable for unsettled MBS purchases as a multiple of net equity allocated. Includes effect of Swaps. For additional detail regarding the above table, see the Company’s third quarter 2011 earnings release dated November 7, 2011. At September 30, 2011 Agency MBS Non-Agency MBS (1) Cash Other, net Total ($ in Millions) Amortized Cost $ 7,311 $ 4,141 $ 444 $ (29) $ 11,867 Market Value $ 7,519 $ 4,146 $ 444 $ (29 ) $ 12,080 Less Payable for Unsettled MBS Purchases (134) - (134) Less Repurchase Agreement Borrowings (6,416) (1,795) - - (8,211) Less Securitized Debt - (959) - - (959) Equity Allocated $ 969 $ 1,392 $ 444 $ (29) $ 2,776 Less Swaps at Market Value - - - (135) (135) Net Equity Allocated $ 969 $ 1,392 $ 444 $ (164) $ 2,641 Debt/Net Equity Ratio (2) 6.76 x 1.98 x - - 3.52 x For the Quarter Ended September 30, 2011 Yield on Assets 3.37 % 7.29 % 0.02 % 4.60 % Less Cost of Funds 1.74 (3) 1.61 (3) - 1.70 Spread 1.63 % 5.68 % 0.02 % 2.90 % |
|
|
7 MFA Asset Allocation Strategy Investment in Residential MBS Including Both Agency MBS and Non-Agency MBS (1) Adjusted for the impact of Linked Transactions. See Annex 1 for a reconciliation of non-GAAP financial measures. Information presented based on data available at time of loan origination. (2) MTR or Months To Reset is the number of months remaining before the coupon interest rate resets. At reset, the MBS coupon will adjust based upon the underlying mortgage benchmark interest rate index, margin and periodic or lifetime caps. The MTR does not reflect scheduled amortization or prepayments. (3) Includes floating rate MBS that may be collateralized by fixed-rate mortgages. ($ in Millions) Average Average Average Time to Reset Market Value MTR(2) Market Value MTR(2) Market Value MTR(2) < 2 years(3) 1,836 $ 8 2,122 $ 6 3,958 $ 7 2-5 years 2,982 42 547 44 3,529 42 > 5 years 957 70 354 64 1,311 69 ARM-MBS Total 5,775 $ 36 3,023 $ 19 8,798 $ 30 15-Year Fixed 1,744 $ - $ 1,744 $ 30-Year Fixed 1,116 1,116 40-Year Fixed 7 7 Fixed Rate Total 1,744 $ 1,123 $ 2,867 $ MBS Total 7,519 $ 4,146 $ 11,665 $ Agency Non-Agency (1) Total - - At September 30, 2011 |
|
|
8 MFA owns $4.1 billion market value of Non-Agency MBS with an average amortized cost of 73% of par. Recent price declines provide opportunities to acquire assets with attractive long-term cash flows. In the third quarter of 2011, these assets generated a loss adjusted yield of 7.29% on an unlevered basis. These assets are less sensitive to changes in the yield curve and interest rates. Returns on discounted Non-Agency MBS increase if prepayments increase. MFA Strategy – Non-Agency MBS Dollars in Millions MFA continues to identify Non-Agency MBS at attractive prices *Includes $256.4 million fair value of Non-Agency MBS underlying Linked Transactions at September 30, 2011. Non-Agency MBS are presented on a non-GAAP basis. For a GAAP reconciliation of such items, see Annex 1. December 2008 September 2011 $0 Increasing Non-Agency MBS Portfolio* |
|
|
9 MFA Strategy – Non-Agency MBS Deeply discounted purchase price, substantial credit reserve and 5.7% credit enhancement mitigate credit risk * Includes $256.4 million fair value of Non-Agency MBS underlying Linked Transactions. Non-Agency MBS are presented on a non-GAAP basis. For a GAAP reconciliation of such items, see Annex 1. Non-Agency Portfolio As of September 30, 2011* Dollars in Millions OTTI Current Face $5,659.3 Accretable Discount, Net $264.8 5% Credit Reserve $1,202.9 21% $50.7 1% Purchase Discount, Net $1,467.7 26% OTTI $50.7 1% Purchase Price $4,140.9 73% |
|
|
10 Projections assume defaults well in excess of currently delinquent mortgages Non-Agency MBS – 20 Largest Positions* *Data as of September 30, 2011. FICO scores as of deal origination date. % of Total Portfolio Collateral Type FICO WALA Credit Support (%) 60+ DQ Projected Defaults Projected Principal Recovery 6 Month Loss Severity 1.8% Fixed 744 53 2.0 14% 26% 85% 43% 1.8% 10/20 737 57 4.6 15% 38% 87% 44% 1.7% 7/23 726 51 1.4 29% 51% 76% 47% 1.6% 10/20 742 52 1.8 26% 39% 83% 59% 1.6% Fixed 730 51 0.0 24% 44% 71% 58% 1.5% 5/25 746 50 5.4 20% 37% 87% 32% 1.4% 5/25 731 74 12.2 23% 48% 81% 53% 1.4% 7/23 734 61 6.2 29% 48% 82% 51% 1.2% 5/25 723 50 6.7 27% 55% 75% 51% 1.2% Fixed 740 54 0.0 18% 36% 81% 74% 1.2% Fixed 730 52 7.3 23% 49% 76% 54% 1.1% 10/20 728 61 3.5 23% 55% 71% 44% 1.0% 10/20 741 55 4.7 21% 36% 85% 51% 1.0% 7/23 746 52 2.1 26% 39% 82% 50% 1.0% 5/25 737 71 6.2 12% 40% 86% 41% 1.0% 5/25 736 54 0.0 24% 53% 74% 48% 1.0% 5/25 726 82 13.5 13% 34% 95% 38% 0.9% 5/25 734 62 2.3 20% 42% 82% 51% 0.9% 10/20 722 71 1.6 18% 47% 81% 45% 0.8% 5/25 702 83 19.5 29% 51% 90% 51% 25.0% 734 59 4.7 22% 43% 81% 49% Total/weighted average: |
|
|
11 Re-securitization – part of a diversified funding strategy Non-Agency MBS MFA Resecuritizations since October 2010 October 2010 February 2011 June 2011 Name of Trust (Consolidated as VIE) DMSI Remic Trust 2010-RS2 CSMC 2011-1R CSMC 2011-7R Securitized Debt Issued $246.3 million $488.4 million $474.9 million Pass-through rate 1M LIBOR+125 bps 1M LIBOR+100 bps 1M LIBOR+125 bps Outstanding Securitized Debt at September 30, 2011 is $958.4 million |
|
|
12 Non-Agency Leverage includes Repo and Re-securitization* Non-Agency MBS Non-Agency Leverage is approximately 2x (debt to equity) This $1 billion of Securitized Debt is permanent financing Non-recourse to the general credit of MFA No mark-to-market No margin calls Un-encumbered Non-Agencies of approximately $360 mm Non-Agency repo is not new for MFA. MFA used repo financing for Non-Agencies throughout the 2007-2009 period. * All amounts presented as of September 30, 2011 Market Value of Non-Agency MBS $4.1 Billion Financing Equity $1.4 Billion Repo $1.8 Billion Securitized Debt $1.0 Billion |
|
|
13 Non-Agency Repo is DIFFERENT today than it was prior to 2009 Non-Agency MBS Overall systemic leverage is lower Haircuts are much higher Average haircut is 30% Assets are not difficult to price and price volatility is not high relative to haircuts Counterparties (lenders) are well-protected Non-Agency leverage provides a higher yield to lenders Libor + 150bps is attractive in zero interest rate environment Non-Agency Repo is transferable/fungible Ability to substitute Non-Agency bonds Ability to use Non-Agency collateral to meet margin calls |
|
|
[LOGO] |

|
|
Information pertaining to MFA’s Non-Agency MBS that are a component of Linked Transactions are reconciled below as of and for the three months ended September 30, 2011 with the most directly comparable financial measure calculated in accordance with GAAP, as follows: 15 ANNEX 1 – Reconciliations of Non-GAAP Financial Measures (Dollars in Thousands) GAAP Based Information Adjustments for the Impact of MBS Linked Transactions Non-GAAP Presentation At September 30, 2011: Repurchase Agreement Borrowings $ 8,017,663 $ 192,960 (1) $ 8,210,623 Securitized Debt 958,406 - 958,406 Payable for Unsettled MBS Purchases 134,493 - 134,493 Total Borrowings (Debt) $ 9,110,562 $ 192,960 (1) $ 9,303,522 Stockholders' Equity $ 2,641,224 $ 1,916 $ 2,643,140 Debt-to-Equity (Debt/Stockholders' Equity) 3.4 x 3.5 x For the Three Months Ended September 30, 2011: Average Interest Earning Assets $ 11,559,025 $ 265,259 (2) $ 11,824,284 Interest Income $ 130,766 $ 5,251 $ 136,017 Yield on Interest Earning Assets 4.53 % 7.92 % 4.60 % Average Total Borrowings $ 9,034,044 $ 219,270 (1) $ 9,253,314 Interest Expense $ 38,752 $ 864 $ 39,616 Cost of Funds 1.70 % 1.56 % 1.70 % Net Interest Rate Spread 2.83 % 6.36 % 2.90 % (1) Represents borrowings under repurchase agreements underlying Linked Transactions. (2) Reflects adjustments for the impact of MBS Linked Transactions. |
|
|
The table below reconciles MFA’s Non-Agency MBS and related repurchase agreement borrowings and securitized debt on a GAAP basis to reflect on a combined basis its Non-Agency MBS and related repurchase agreements underlying its Linked Transactions, which is a Non-GAAP financial measure. Based on this Non-GAAP presentation, MFA has also presented certain resulting performance measures (reflected in the table below) on a Non-GAAP basis. 16 ANNEX 1 – Reconciliations of Non-GAAP Financial Measures (cont) Adjustments for the Impact of MBS GAAP Based Linked Non - GAAP (Dollars in Thousands) Information (1) Transactions (2) Presentation At September 30, 2011: Amortized Cost of Non - Agency MBS $ 3,902,557 $ 238,320 (6) $ 4,140,877 (6) Fair Value of Non - Agency MBS $ 3,889,310 $ 256,369 $ 4,145,679 Face/Par Value of Non - Agency MBS $ 5,337,509 $ 321,778 $ 5,659,287 Purchase (Discount) Designated as Credit Reserve and OTTI $ (1,196,401) (3) $ (57,224) $ (1,253,625) (4) Purchase (Discount) Designated as Accretabl e, net (238,551) (26,234) (6) (264,785) (6) Total Purchase (Discount) of Non - Agency MBS $ (1,434,952) (3) $ (83,458) $ (1,518,410) (4) Non - Agency Repurchase Agreements and $ 2,560,557 $ 19 2 ,960 $ 2,75 3 ,517 Securitized Debt For the Three Months Ended September 30, 2011: Non - Agency MBS Average Amortized Cost $ 3,904,218 $ 2 65 ,2 59 $ 4,1 69,477 Non - Agen cy Average Total Borrowings $ 2,617,546 $ 21 9,270 $ 2,83 6 , 816 Coupon Interest on Non - Agency MBS $ 60,038 $ 4,588 $ 64,626 Effective Yield Adjustment (5) 10,746 663 11,409 Interest Income on Non - Agency MBS $ 70,784 $ 5,251 $ 76,035 Interest Expense on Non - Agency Total Borrowings $ 10,624 $ 864 $ 11,488 Net Asset Yield on Non - Agency MBS 7.25 % 7.9 2 % 7.29 % Non - Agency Cost of Funds 1.61 1.56 1.61 Non - Agency Spread 5.64 % 6.36 % 5.68 % (1) Includes Non - Agency MBS transferred to consolidated VIEs. (2) Adjustment to reflect Non - Agency MBS underlying Linked Transactions, borrowings under repurcha se agreements underlying Linked Transactions and yield adjustments for de - linked Non - Agency MBS. (3) Amounts disclosed reflect purchase discount designated as credit reserve of $1.146 billion and OTTI of $50.7 million. (4) Amounts disclosed reflect purch ase discount designated as credit reserve of $1.203 billion and OTTI of $50.7 million. (5) The effective yield adjustment on Non - Agency MBS is the difference between net income calculated using the net yield, which is based on management’s estimates of f u ture cash flows for Non - Agency MBS, and the current coupon yield. (6) Includes adjustment of $22.6 million related to yield adjustments for de - linked Non - Agency MBS. |
|
|
[LOGO] |