Attached files
| file | filename |
|---|---|
| 8-K - FORM 8-K - Xenith Bankshares, Inc. | d253946d8k.htm |
| EX-99.1 - PRESS RELEASE - Xenith Bankshares, Inc. | d253946dex991.htm |
 1
1
1
Forward Looking Statements
Certain statements included in this presentation are “forward-looking
statements.” All statements other than statements of historical facts contained in
this presentation, including statements regarding our plans, objectives and goals,
future events or results, our competitive strengths and business strategies, and the
trends in our industry are forward-looking statements. The words
“believe,” “will,” “may,” “could,”
“estimate,” “project,” “predict,” “continue,” “anticipate,” “intend,”
“should,” “plan,” “expect,” “appear,”
“future,” “likely,” “probably,” “suggest,” “goal,” “potential” and
similar expressions, as they relate to us, are intended to identify forward-looking
statements. Forward-looking statements made in this presentation reflect beliefs,
assumptions and expectations of future events or results, taking into account the
information currently available to us. These beliefs, assumptions and expectations may
change as a result of many possible events, circumstances or factors, not all of which
are currently known to us. If a change occurs, our business, financial condition,
liquidity, results of operations and prospects may vary materially from those expressed
in, or implied by, our forward-looking statements. Accordingly, you should not place
undue reliance on these forward-looking statements. Factors that may cause actual results
to differ materially from those contemplated by our forward-looking statements
include the risks outlined in Part 1, Item 1A, “Risk Factors” section of our
Annual Report on Form 10K for the year ended December 31, 2010 filed with Securities
and Exchange Commission. Except as required by applicable law or regulations, we
do not undertake, and specifically disclaim any obligation, to update or revise any
forward-looking statement. Exhibit 99.2 |
 2
Corporate Overview
•
Xenith Bankshares, Inc. is the holding company for Xenith Bank, a rapidly
growing commercial bank
•
Business Focus: Xenith targets the banking needs of middle-market and
small businesses, local real estate developers and investors, private
banking clients, and select retail banking clients
•
Market Focus: Virginia markets with the greatest economic activity and
growth, including the MSAs of Washington, D.C., Richmond and Hampton
Roads, which are part of what we refer to as the ‘Golden Crescent’
•
Experienced, highly capable team of seasoned executives and bankers
•
Skilled team of Relationship Managers (‘RM’) with successful track record
in our target markets |
 3
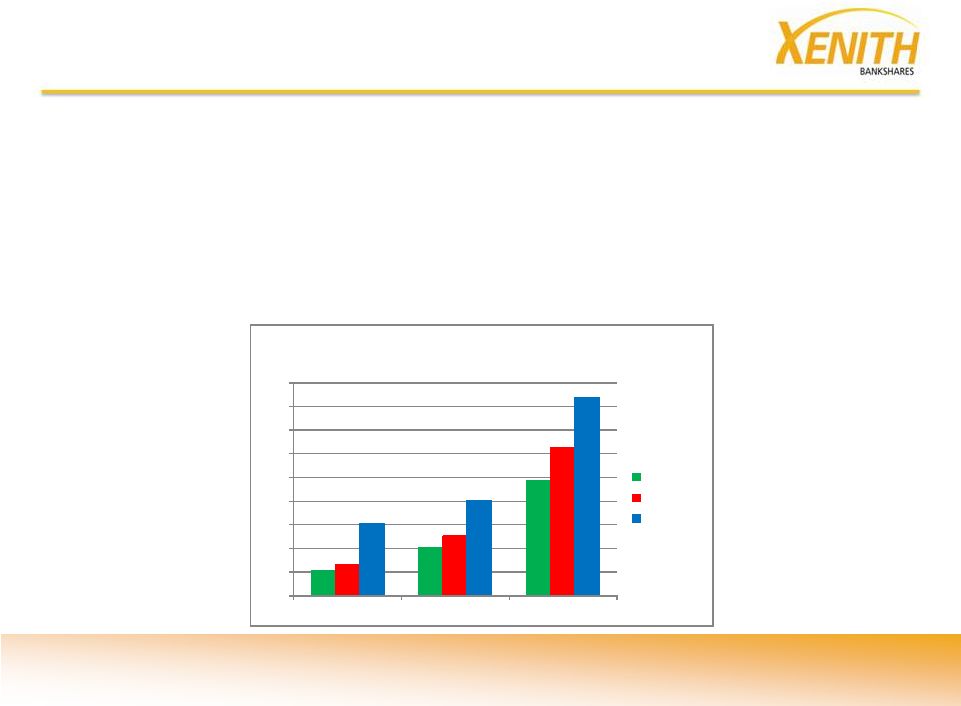
Growth Story
•
Xenith is fueled by organic growth and growth through acquisitions
•
Since 12/31/09, Xenith’s assets, loans and deposits have increased 133%, 187% and
217%, respectively
•
Loan increases have come from 42% organic growth and 58% growth through
acquisitions
•
Deposit increases have come from 55% organic growth and 45% growth through
acquisitions
$50
$100
$150
$200
$250
$300
$350
$400
$450
$500
Dec. 2009
Dec. 2010
Sept. 2011
Xenith Bankshares, Inc.
(In Millions)
Loans (net)
Deposits
Assets |
 4
History
•
March 2008 –
Signed agreement with BankCap Partners to create a de novo
Virginia bank
•
May 2009 –
Signed definitive merger agreement with First Bankshares, Inc.,
the
holding company for SuffolkFirst Bank in Suffolk, Virginia (Hampton Roads)
•
June 2009 –
Closed Reg. D common stock offering for $47.5 million
•
December 2009 –
Merger with First Bankshares, name changed to Xenith
Bankshares
•
April 2011 –
Raised $17.7 million (net) in S-1 registered common stock offering
•
July 2011 –
Acquired Richmond branch operations of Paragon Commercial
Bank, and acquired assets and deposits of Virginia Business Bank
in an FDIC
failed bank transaction
•
September 2011 –
Received $8.4 million from U.S. Treasury in SBLF preferred
stock investment |
 5
Summary Financial Data at Sept. 30, 2011
•
Total Assets
$470 million
•
Total Loans (net)
$293 million
•
Total Deposits
$362 million
•
Total Common Equity
$80 million
•
Tangible Common Equity
$64 million
•
Shares Outstanding
10.4 million
•
Market Capitalization
$35 million
•
SBLF
$8.4 million
•
Headquarters
Richmond, Virginia
•
Insider Ownership
37% (includes BankCap Partners)
•
Institutional Ownership
25% |
 Business
Model Our business model is based on four building
blocks: Seasoned
Seasoned
Team
Team
Vibrant
Vibrant
Markets
Markets
Significant
Significant
Capital
Capital
Resources
Resources
Core
Core
Customers
Customers
6
6 |
 •
Previous large regional bank
experience in the Mid-Atlantic
•
Diversified backgrounds in key
disciplines
•
Extensive credit experience
Executive Team
Professional Staff
Knowledgeable Board
7
Relationship Managers
Skilled Team
•
Seasoned bankers with extensive in-
market experience and existing
customer relationships
•
Specific experience in C&I, Small
Business, Commercial Real Estate, &
Private Banking
•
In-depth banking experience in
technology and operations
•
Rigorous analytics & information based
approach
•
Public company / SEC reporting
experience
•
Significant public company board
experience, six with previous bank
board experience
•
Board members with direct experience
overseeing key committees including
Audit, Credit, and Asset & Liability
Management
7 |
 Highly
Attractive Highly Attractive
Demographics
Demographics
8
8
Attributes of Our Target Markets
Fragmented Banking
Fragmented Banking
Landscape
Landscape
Economy Built on
Economy Built on
Diverse Industry Base
Diverse Industry Base
Vibrant Local
Vibrant Local
Economies:
Economies:
Golden Crescent makes
Golden Crescent makes
up 75%
up 75%¹
1
of Virginia’s
of Virginia’s
Economic Output
Economic Output
8
1
Source: Bureau of Economic Analysis, 2010 |
 Virginia
Demographics: Golden Crescent Highlights
Washington
& N. Va. Region
Hampton
Roads
Region
Richmond
Region
NC
TN
KY
MD
PA
OH
•
The
“Golden
Crescent”
is
made
up of the following MSAs:
-
Washington, DC-MD-VA-WV
-
Richmond-Petersburg, VA
-
Norfolk-Virginia Beach-
Newport News, VA-NC
•
~ 73%
1
of the state’s deposits are
located in Golden Crescent
•
Virginia’s median household
income, $61,347
2
, is higher than
national median household
income of $54,442
2
•
The Golden Crescent represents
an even more attractive market
with a median household income
of the $73,259
2
1
SNL Financial, June 30, 2011
2
SNL Financial, 2010
9 |
 Virginia
Demographics: Vibrant Business Environment
•
In 2010, Virginia’s GDP estimated at $424 billion
1
, ranking it 10
th
in the
nation
•
Since 2007, Virginia has ranked 1
st
or 2
nd
in CNBC’s survey of the best state
for business
•
In 2010, Virginia placed 2
nd
in study conducted by Forbes.com evaluating
top states for business
•
The Golden Crescent, represents the Virginia markets with the greatest
economic
activity
and
growth
and
some
of
the
lowest
unemployment
rates
(1.9% lower than national rate
2
)
10
1
Bureau of Economic Analysis, September 2011
2
Bureau of Labor Statistics, September 2011 |
 Virginia
Deposits Snapshot Virginia Branch Deposits Concentration
Source: SNL Data, as of 6/30/2011
•
Of 106 banks headquartered in Virginia, 88 were less than $1 billion in assets and 69 had
assets less than $500 million
•
Community
banks
are
typically
constrained
by
capital
and
limited
by
their
focus
on
real
estate lending
•
Mega-banks
are
hampered
by
their
organizational
structure
and
lack
of
consistent
focus
11
0
20
40
60
80
100
120
0
10
20
30
40
50
60
70
Deposit Totals
(Billions)
Number
of
Banks
The Virginia 'Barbell'
Number of Banks
Deposits |
 12
12
Target Customers
Stable Funding
Source
Retail
Local Relationships, Centers of
Influence, Deposit rich, low risk
lending
Local Investors &
Developers
Multiple Property Types
Real Estate
C&I, Small Business
Private Banking
Diversified
Self Funding
Profitable
Xenith generates new customers though a focused, targeted prospecting and
marketing effort combined with a risk adjusted return discipline
12 |
 Increase
Breadth of Increase Breadth of
Market Served
Market Served
13
13
Attract Talented
Attract Talented
Bankers
Bankers
Provides Regulatory
Provides Regulatory
Flexibility
Flexibility
Raise House & Legal
Raise House & Legal
Lending Limits
Lending Limits
Significant Capital Resources
13 |
 Business
Results - Organic Growth
•
In 2010, 50% organic loan growth and 53% organic deposit growth
•
Through nine months ending September 30, 2011;
-
23% organic loan growth (31% annualized)
-
43% organic deposit growth (60% annualized)
•
Organic loan growth balanced between C&I and CRE
•
Organic deposit growth has been focused on building transaction
accounts
•
While the underlying strength of the Virginia economy sustains long
term growth, most recent organic growth is the result of moving
market share from the large banks.
14
14 |
 15
Acquisitions
Xenith began by acquiring First Bankshares in Suffolk, Virginia (part of the
Hampton Roads region) through a merger
•
Acquired $110 million in loans at a $7.6 million discount
•
Loan portfolio had approximately 43% in C&I loans
•
Credit problems almost exclusively related to an out-of-market
participations portfolio; have made progress at reducing exposure
•
Acquired $114 million of deposits; balance of deposits in Suffolk market
total $135 million at the end of September 2011
15
15 |
 16
Xenith acquired the Richmond branch operations of Paragon Commercial
Bank on July 29, 2011 –
a strategic
acquisition
•
Acquired approximately $58.3 million in performing loans at a $1.8
million discount
•
Hand-picked the loans we purchased
•
Acquired $76.6 million of deposits, an excellent mix of deposits
comprised
primarily
of
transaction
accounts
at
a
deposit
premium
of
approximately $2.5 million
•
Retained the entire Paragon team and integrated them into Xenith’s
headquarters, closing the Paragon branch
16
16
Acquisitions |
 17
Acquisitions
Xenith
acquired
all
of
the
deposits
and
substantially
all
of
the
assets
of
Virginia Business Bank on July 29, 2011 in an FDIC failed bank transaction –
a financial
acquisition; the acquisition was completed without any FDIC
loss-share arrangement
•
Acquired approximately $93 million in assets at a $23.8 million
discount, approximately $71 million in loans
•
Acquired
$78
million
in
deposits
(mainly
internet
deposits)
at
a
0%
deposit premium, more than 48% have been redeemed
•
Recorded a pre-tax bargain purchase gain of $8.7 million in Q3
17
17 |
 18
•
Our loan mix reflects our business strategy
•
We are focused on lending to
middle-market and small businesses, local
real estate developers and investors
Loan Portfolio
Dec -
2009
Dec -
2010
Sept -
2011
Gross Loan Composition ($)
Consumer
RRE
CRE
C&I
$102 million
$153 million
$297 million
0%
5%
15%
20%
25%
30%
35%
40%
45%
50%
Dec -
2009
Dec -
2010
Sept -
2011
Gross Loan Composition (%)
Consumer
RRE
CRE
C&I
10% |
 19
19
Loan Portfolio
•
Over the last seven quarters, we have steadily built Loan Interest & Fee Income
•
In Q3 2011, we increased Loan Interest & Fee Income more than 80% over Q2
2011, reflecting our organic growth and two acquisitions at the end of July 2011
•
Loan Interest Income and Gross Loan Yields reflect the impact of
the accretion of
discount
5.78%
6.95%
7.44%
7.78%
6.89%
6.30%
7.88%
4%
5%
6%
7%
8%
9%
10%
Q1 2010
Q2 2010
Q3 2010
Q4 2010
Q1 2011
Q2 2011
Q3 2011
Quarterly Gross Loan Yields
$1.56
$1.99
$2.37
$2.74
$2.79
$2.83
$5.13
$0
$1
$2
$3
$4
$5
$6
Q1 2010
Q2 2010
Q3 2010
Q4 2010
Q1 2011
Q2 2011
Q3 2011
Loan Interest & Fee Income
(in Millions)
|
 20
20
Deposit Portfolio
•
From the outset, we have placed a significant emphasis on core deposits; deposit
gathering is a key factor in calculating our RM incentive pay
•
Since 12/31/2009, we have increased transaction accounts (interest & non-interest
checking and money market accounts) nearly 900% by 9/30/2011
•
Since 12/31/2009, we have reduced time deposits (core plus brokered) as a
percentage of total deposits from nearly 78% to 37% at 9/30/2011
0%
10%
20%
30%
40%
50%
60%
70%
Dec -
2009
Dec -
2010
Sept -
2011
Deposit Composition (%)
Non-Int. Checking
Interest Checking
Money Market / Savings
Brokered CDs
Core Time Deposits
$0
$50
$100
$150
$200
$250
$300
$350
$400
Dec -
2009
Dec -
2010
Sept -
2011
Deposit Composition ($)
Non-Int. Checking
Interest Checking
Money Market / Savings
Brokered CDs
Core Time Deposits
$114 million
$175 million
$362 million |
 $0.37
$0.35
$0.43
$0.41
$0.35
$0.36
$0.63
$0.0
$0.1
$0.2
$0.3
$0.4
$0.5
$0.6
$0.7
$0.8
$0.9
$1.0
Q1 2010
Q2 2010
Q3 2010
Q4 2010
Q1 2011
Q2 2011
Q3 2011
Deposit Interest Expense
(in Millions)
21
21
Deposit Portfolio
•
As we have repositioned our mix of deposits, we have also reduced our average
cost
•
Since 12/31/2009, we have reduced the quarterly average cost of deposits
from 1.38% to 0.91%, a reduction of 47 basis points
1.38%
1.20%
1.20%
0.96%
0.92%
0.80%
0.91%
0.00%
0.20%
0.40%
0.60%
0.80%
1.00%
1.20%
1.40%
1.60%
Q1 2010
Q2 2010
Q3 2010
Q4 2010
Q1 2011
Q2 2011
Q3 2011
Quarterly Average Cost of Deposits |
 Credit Risk
Management •
Purposeful establishment of credit culture
-
Starts with Board, Credit Policy Committee and Executive Management
-
Close alignment between RMs and Credit Risk Management
-
Explicit understanding of senior debt lender role
-
Risk-adjusted pricing discipline
•
Credit exposure is based on the risk rating of the credit and the type of collateral
-
The risk rating of the credit is the result of a disciplined underwriting process
-
The collateral rating related to the expected loss in the event of default
Credit process includes our Management Credit Committee, our Credit Policy
Committee and Watch List meetings
22
22 |
 Work-out
Loan Management •
There are currently no loans originated by Xenith in our work-out portfolio
•
Work-out loan portfolio is a predictable by-product of certain acquisitions
•
First Bankshares
-
Non-accrual Loans acquired in December 2009
$4.1 million
-
Balance at end of September 2011
$2.4 million
•
Virginia Business Bank
-
Non-accrual Loans acquired in July 2011
$4.7 million
-
Balance at end of September 2011
$3.2 million
•
Segregated work-out team
-
Professionally managed work-out team reporting to CEO
-
Led by a seasoned banker and staff with extensive work-out experience in the
mid-Atlantic
23
23 |
 Criticized
Loans / Non-Performing Assets 24
24
•
All of our criticized loans and non-performing
assets were acquired in the First Bankshares
and Virginia Business Bank acquisitions
•
Criticized loans and non-performing assets are
reviewed monthly
•
Xenith’s ALLL / Loan ratio is 1.15%
•
ALLL calculation does not include the loan
discounts booked to reflect our acquired loans
at fair value
•
As of 9/30/2011, ALLL totaled $3.4 million
•
In addition to the ALLL, we had $16.4 million in
remaining discount related to the acquired
portfolios as of 9/30/2011
•
Our ALLL + Discount totaled $19.8 million as of
9/30/2011
•
The ALLL + Discount / Gross Loans = $19.8
million / $313 million = 6.32%
Sept. 30, 2011
Special Mention Loans
13,565
$
Substandard
19,938
Doubtful
1,545
Total Criticized Loans
35,048
$
Nonaccrual Loans (included above)
5,596
$
Other real estate owned
1,379
Total Non-performing Assets
6,975
$
Non-performing Assets / Gross Loans
2.35%
Non-performing Assets / Total Assets
1.48%
ALLL / Gross Loans
1.15%
ALLL / Non-accrual Loans
61.14%
Net Charge-offs / Average Loans
0.64% |
 25
25
Financial Highlights -
Balance Sheet
In Thousands
21-month
Dec 2009
Dec 2010
Sept 2011
Growth
Assets
Cash & Equivalents
35,203
$
12,201
$
83,967
$
139%
Investments
36,847
58,890
60,861
65%
Loans (Net)
102,050
151,380
293,307
187%
Intangible Asset
14,229
14,109
16,445
16%
Other Assets
13,262
14,622
15,375
16%
Total Assets
201,591
$
251,201
$
469,955
$
133%
Liabilities & Equity
Non-Interest Checking
14,646
$
22,800
$
47,127
$
222%
Interest Checking
5,609
5,543
14,504
159%
Money Market & Savings
5,358
45,148
166,914
3015%
Time Deposits
88,535
101,648
133,733
51%
Total Deposits
114,148
175,139
362,278
217%
Borrowed Funds
31,260
25,001
20,000
-36%
Other Liabilities
2,111
2,273
7,270
244%
Total Liabilities
147,519
202,413
389,547
164%
Equity
54,072
48,789
80,408
49%
Total Liabilities & Equity
201,591
$
251,201
$
469,955
$
133% |
 26
26
Net Interest Margin
•
GAAP NIM reflects the purchase accounting impact of accretion
Net Interest Margin is defined as the percentage of net interest
income to average-earning assets.
Q1 2010
Q2 2010
Q3 2010
Q4 2010
Q1 2011
Q2 2011
Q3 2011
GAAP NIM
2.99%
4.51%
4.41%
5.84%
4.70%
4.35%
5.01%
2.0%
2.5%
3.0%
3.5%
4.0%
4.5%
5.0%
5.5%
6.0%
GAAP NIM |
 27
27
Financial Highlights -
Income Statement
In Thousands
2009
2010
Sept 2011
YTD
Interest Income
8,640
$
10,760
$
12,256
$
Interest Expense
4,195
2,167
1,797
Net Interest Income
4,445
8,593
10,459
Provision For Loan Losses
5,501
1,990
3,100
Net Interest Income after Provision
(1,056)
6,603
7,359
Non-Interest Income
552
483
8,775
Non-Interest Expense
6,022
13,002
11,845
Net Income Before Taxes
(6,526)
(5,916)
4,289
Income Taxes
(2,219)
-
57
Net Income
(4,307)
$
(5,916)
$
4,232
$ |
 28
28
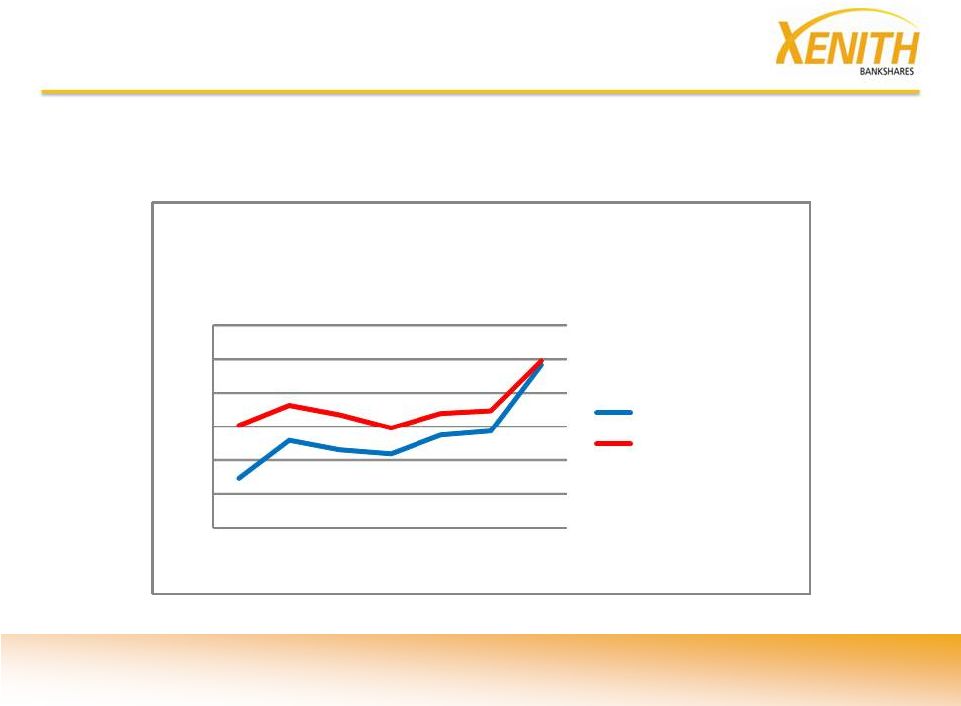
Net Interest Margin
•
Since Q1 2010, the growth in Net Interest Income is 2X the growth in Non-
Interest
Expense (328% vs. 162%).
$-
$1
$2
$3
$4
$5
$6
Q1
2010
Q2
2010
Q3
2010
Q4
2010
Q1
2011
Q2
2011
Q3
2011
Quarterly Net Interest Income &
Non
-
Interest Expense
(in Millions)
Net Interest Income
Non-Interest Expense |
 29
Xenith is well capitalized: Proceeds from our S-1 registered public offering, SBLF
preferred stock issuance and the bargain purchase gain from the Virginia Business
Bank acquisition have strengthened our capital position in 2011
29
Capital
Includes proceeds of
$47.5 million related
to initial Xenith Reg
D offering
$54.1
$48.8
$17.7
$8.4
$5.4
$80.4
$0
$10
$20
$30
$40
$50
$60
$70
$80
$90
Dec 2009
Dec 2010
Supplemental
Offering
(April 2011)
SBLF
(Sept 2011)
YTD
Comprehensive
Income
Sept 2011
Xenith Equity |
 30
30
Capital Ratios
Dec 2009
Dec 2010
Sept 2011
Leverage Ratio
26.8%
14.8%
15.4%
Tier 1 RBC Ratio
36.7%
20.3%
18.8%
Total RBC Ratio
36.7%
21.4%
19.9%
0%
5%
10%
15%
20%
25%
30%
35%
40%
Xenith Bank Capital Ratios |
 •
We are focused primarily on organic growth in our target markets
–
Disciplined marketing and sales strategies
–
Hire the best of the best bankers who can gain profitable market
share
–
Metrics, reporting and incentives to support objectives
•
We continue to evaluate the competitive landscape for opportunities
–
Virginia is a fragmented banking market
–
Our business model is unique in Virginia
•
Our infrastructure can support significant growth
–
Management team and Board capable of managing a larger institution
31
Looking Forward |
 Skilled
Management Team
and
Demonstrated
Model
Significant Capital
Selective In-Market
Consolidation
(Whole bank & select asset
opportunities)
Strong,
Strong,
Substantial &
Substantial &
Independent
Independent
Virginia Bank
Virginia Bank
Organic Growth
(Attractive demographics;
proven market competitor)
•
Focus on the Virginia markets with the greatest economic activity and growth
•
Team of experienced professionals
•
Significant capital
•
Local management and decision-making processes
32
+
+
Investment Considerations |
 Appendix
33 |
 •
Malcolm S. McDonald –
Chairman of the Board of Directors, Xenith
Bankshares; Retired CEO, Signet
Banking Corporation •
T. Gaylon Layfield, III -
CEO & President, Xenith Bankshares; formerly COO Signet Banking
Corporation
•
Larry L. Felton -
Retired COO of Angus I. Hines, Inc.
•
Palmer P. Garson -
Managing Director of Cary Street Partners, LLC
•
Patrick D. Hanley -
CEO of Gallium Technologies, LLC; former CFO, Overnight Transportation
•
Peter C. Jackson -
President of Jackson Real Estate
•
Brian D. Jones -
Principal and co-founding partner of BankCap Partners
•
Robert J. Merrick -
Retired Chief Credit Officer, Signet Banking Corporation
•
Scott A. Reed -
Principal and co-founding partner of BankCap Partners
•
Mark Sisisky -
Managing Director of Caprin Asset Management
•
James
E.
Turner
-
Retired
President
and
Chief
Operations
Officer
of
General
Dynamics
34
Board of Directors |
 •
T.
Gaylon
Layfield,
III:
President,
Chief
Executive
Officer
and
a
director
of
Xenith
Bankshares
–
Previously President and Chief Operating Officer of Signet Banking Corporation
–
Has more than 25 years experience in banking
•
Thomas
W.
Osgood:
EVP,
Chief
Financial
Officer,
Chief
Administrative
Officer
and
Treasurer
–
Held roles in commercial banking, investment banking and risk management at Signet Bank and
Wachovia Bank –
Has more than 20 years experience in banking
•
Wellington
(Chris)
W.
Cottrell,
III:
EVP
and
Chief
Credit
Officer
–
Served as Managing Director of Risk Management in the Corporate and Investment Banking Group
at SunTrust Bank –
Spent entire 30 year career in banking
•
Ronald E. Davis:
EVP and head of Operations and Technology
–
Served as President and CEO of Virginia Heartland Bank and its successor, Second Bank and
Trust –
Spent entire 35 year career in banking
•
W. Jefferson O’Flaherty:
EVP and head of Private Banking
–
Regional Managing Director of Wachovia Wealth Management
–
Spent entire 35 year career in banking in Virginia with broad responsibilities across the
‘Golden Crescent’ •
Edward
H.
Phillips,
Jr.:
EVP
and
Chief
Lending
Officer
–
Corporate Relationship Manager for BB&T in Central Virginia
–
20 years of commercial banking experience, including both relationship management and credit
roles 35
Management Bios |