Attached files
| file | filename |
|---|---|
| EX-99.1 - EX-99.1 - FURMANITE CORP | d85581exv99w1.htm |
| 8-K - FORM 8-K - FURMANITE CORP | d85581e8vk.htm |
Exhibit
99.2

| Furmanite Corporation QUARTER ENDED SEPTEMBER 30, 2011 Charles R. Cox, Chairman & CEO Joseph E. Milliron, President & COO Robert S. Muff, Principal Financial Officer |

| Certain of the Company's statements in this presentation are not purely historical, and as such are "forward-looking statements" within the meaning of the Private Securities Litigation Reform Act of 1995. These include statements regarding management's plans, beliefs, expectations, intentions or projections of the future. Forward-looking statements involve risks and uncertainties, including without limitation, the various risks inherent in the Company's business, and other risks and uncertainties detailed most recently in this presentation and the Company's Form 10-K as of December 31, 2010 filed with the Securities and Exchange Commission. One or more of these factors could affect the Company's business and financial results in future periods, and could cause actual results to differ materially from plans and projections. There can be no assurance that the forward-looking statements made in this document will prove to be accurate, and issuance of such forward-looking statements should not be regarded as a representation by the Company, or any other person, that the objectives and plans of the Company will be achieved. All forward-looking statements made in this presentation are based on information presently available to management, and the Company assumes no obligation to update any forward-looking statements. Company assumes no obligation to update any forward-looking statements. Company assumes no obligation to update any forward-looking statements. Company assumes no obligation to update any forward-looking statements. Company assumes no obligation to update any forward-looking statements. Company assumes no obligation to update any forward-looking statements. Company assumes no obligation to update any forward-looking statements. Company assumes no obligation to update any forward-looking statements. Company assumes no obligation to update any forward-looking statements. Company assumes no obligation to update any forward-looking statements. Company assumes no obligation to update any forward-looking statements. Company assumes no obligation to update any forward-looking statements. Company assumes no obligation to update any forward-looking statements. Company assumes no obligation to update any forward-looking statements. Company assumes no obligation to update any forward-looking statements. Company assumes no obligation to update any forward-looking statements. Company assumes no obligation to update any forward-looking statements. Company assumes no obligation to update any forward-looking statements. 2 |

| Furmanite Corporation QUARTER ENDED SEPTEMBER 30, 2011 Charles R. Cox, Chairman & CEO 3 |

| 4 3rd Quarter Revenues up 17% Net income flat, excluding restructuring costs Operating income up 18%, excluding restructuring costs Year-to-Date Revenues up 11% Net income up nearly 30%, excluding restructuring costs Operating income up 21%, excluding restructuring costs Financial Overview |

| 5 Positive Trends Emerging Cautious Optimism Not Counting on Better Markets Business Conditions |

| 6 2010 - Return to Profitability & Restructure 2011 - Implement New Culture & Strategies 2012 - Embed Culture, Drive Strategies & Broaden Growth Platform Organizational Re-Alignment Move Corporate HQ to Houston, Texas Strategic Update |

| To safely and ethically establish Furmanite as the World leader in all our Service Lines by 2014, through Innovation, Global Teamwork, Market Dominance, Project Excellence and Customer Service Perfection. "The World Leader in All Service Lines by 2014" 7 |

| Furmanite Corporation QUARTER ENDED SEPTEMBER 30, 2011 Financial Review Robert S. Muff, Principal Financial Officer 8 |

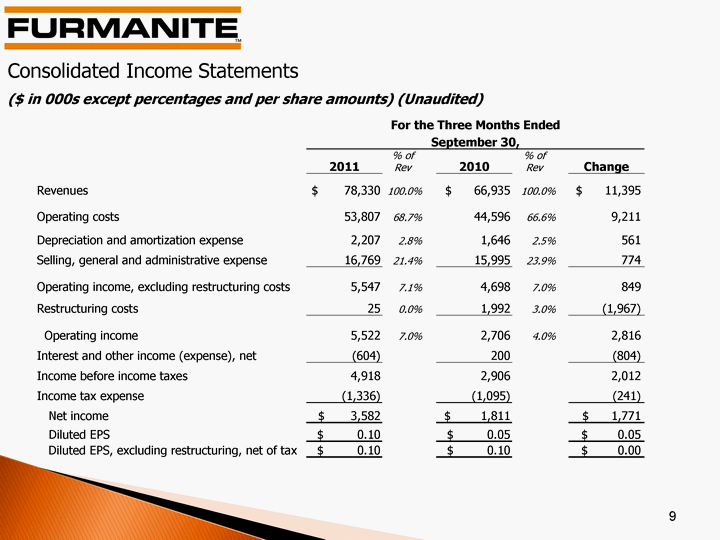
| Consolidated Income Statements ($ in 000s except percentages and per share amounts) (Unaudited) 9 For the Three Months Ended For the Three Months Ended For the Three Months Ended For the Three Months Ended For the Three Months Ended For the Three Months Ended For the Three Months Ended September 30, September 30, September 30, September 30, September 30, September 30, September 30, 2011 % of Rev 2010 % of Rev Change Revenues $ 78,330 100.0% $ 66,935 100.0% $ 11,395 Operating costs 53,807 68.7% 44,596 66.6% 9,211 Depreciation and amortization expense 2,207 2.8% 1,646 2.5% 561 Selling, general and administrative expense 16,769 21.4% 15,995 23.9% 774 Operating income, excluding restructuring costs 5,547 7.1% 4,698 7.0% 849 Restructuring costs 25 0.0% 1,992 3.0% (1,967) Operating income 5,522 7.0% 2,706 4.0% 2,816 Interest and other income (expense), net (604) 200 (804) Income before income taxes 4,918 2,906 2,012 Income tax expense (1,336) (1,095) (241) Net income $ 3,582 $ 1,811 $ 1,771 Diluted EPS $ 0.10 $ 0.05 $ 0.05 Diluted EPS, excluding restructuring, net of tax $ 0.10 $ 0.10 $ 0.00 |

| Consolidated Income Statements ($ in 000s except percentages and per share amounts) (Unaudited) 10 For the Nine Months Ended For the Nine Months Ended For the Nine Months Ended For the Nine Months Ended For the Nine Months Ended For the Nine Months Ended For the Nine Months Ended September 30, September 30, September 30, September 30, September 30, September 30, September 30, 2011 % of Rev 2010 % of Rev Change Revenues $ 234,393 100.0% $ 210,883 100.0% $ 23,510 Operating costs 160,532 68.5% 141,480 67.1% 19,052 Depreciation and amortization expense 6,280 2.7% 4,767 2.3% 1,513 Selling, general and administrative expense 51,357 21.9% 51,227 24.3% 130 Operating income, excluding restructuring costs 16,224 6.9% 13,409 6.4% 2,815 Restructuring costs 270 0.1% 4,716 2.2% (4,446) Operating income 15,954 6.8% 8,693 4.1% 7,261 Interest and other income (expense), net (857) (186) (671) Income before income taxes 15,097 8,507 6,590 Income tax expense (2,343) (2,745) 402 Net income $ 12,754 $ 5,762 $ 6,992 Diluted EPS $ 0.34 $ 0.16 $ 0.18 Diluted EPS, excluding restructuring, net of tax $ 0.35 $ 0.27 $ 0.08 |

| Revenues Adjusted for Currency Rates 2011 amounts at 2010 exchange rates ($ in 000s except percentages) (Unaudited) 11 For the Three Months Ended For the Three Months Ended For the Three Months Ended For the Three Months Ended For the Three Months Ended For the Three Months Ended For the Three Months Ended For the Nine Months Ended For the Nine Months Ended For the Nine Months Ended For the Nine Months Ended For the Nine Months Ended For the Nine Months Ended For the Nine Months Ended September 30, September 30, September 30, September 30, September 30, September 30, September 30, September 30, September 30, September 30, September 30, September 30, September 30, September 30, 2011 2010 Change Change Change 2011 2010 Change Change Change Revenues Americas $ 34,858 $ 27,408 $ 7,450 27% $ 116,028 $ 96,525 $ 19,503 20% EMEA 31,627 28,243 3,384 12% 88,566 82,350 6,216 8% Asia-Pacific 11,845 11,284 561 5% 29,799 32,008 (2,209) -7% Total revenues $ 78,330 $ 66,935 $ 11,395 17% $ 234,393 $ 210,883 $ 23,510 11% Currency adjusted revenues: Americas $ 34,828 $ 27,408 $ 7,420 27% $ 115,668 $ 96,525 $ 19,143 20% EMEA 30,007 28,243 1,764 6% 82,821 82,350 471 1% Asia-Pacific 10,512 11,284 (772) -7% 25,916 32,008 (6,092) -19% Total currency adjusted revenues $ 75,347 $ 66,935 $ 8,412 13% $ 224,405 $ 210,883 $ 13,522 6% |

| Adjustments for Currency Rates 2011 amounts at 2010 exchange rates ($ in 000s) (Unaudited) 12 For the Three Months Ended For the Three Months Ended For the Three Months Ended For the Three Months Ended For the Three Months Ended For the Nine Months Ended For the Nine Months Ended For the Nine Months Ended For the Nine Months Ended For the Nine Months Ended September 30, September 30, September 30, September 30, September 30, September 30, September 30, September 30, September 30, September 30, 2011 2010 Change 2011 2010 Change Operating income (loss)*: Americas $ 690 $ 919 $ (229) $ 9,102 $ 5,067 $ 4,035 EMEA 2,669 (401) 3,070 4,052 (2,614) 6,666 Asia-Pacific 2,163 2,188 (25) 2,800 6,240 (3,440) Total operating income* $ 5,522 $ 2,706 $ 2,816 $ 15,954 $ 8,693 $ 7,261 Currency adjusted operating income (loss)*: Americas $ 692 $ 919 $ (227) $ 9,006 $ 5,067 $ 3,939 EMEA 2,534 (401) 2,935 3,584 (2,614) 6,198 Asia-Pacific 1,855 2,188 (333) 2,240 6,240 (4,000) Total currency adjusted operating income* $ 5,081 $ 2,706 $ 2,375 $ 14,830 $ 8,693 $ 6,137 Net income $ 3,582 $ 1,811 $ 1,771 $ 12,754 $ 5,762 $ 6,992 Currency adjusted net income $ 3,383 $ 1,811 $ 1,572 $ 12,393 $ 5,762 $ 6,631 * After allocation of headquarter costs * After allocation of headquarter costs * After allocation of headquarter costs * After allocation of headquarter costs * After allocation of headquarter costs * After allocation of headquarter costs * After allocation of headquarter costs * After allocation of headquarter costs * After allocation of headquarter costs * After allocation of headquarter costs * After allocation of headquarter costs * After allocation of headquarter costs * After allocation of headquarter costs |

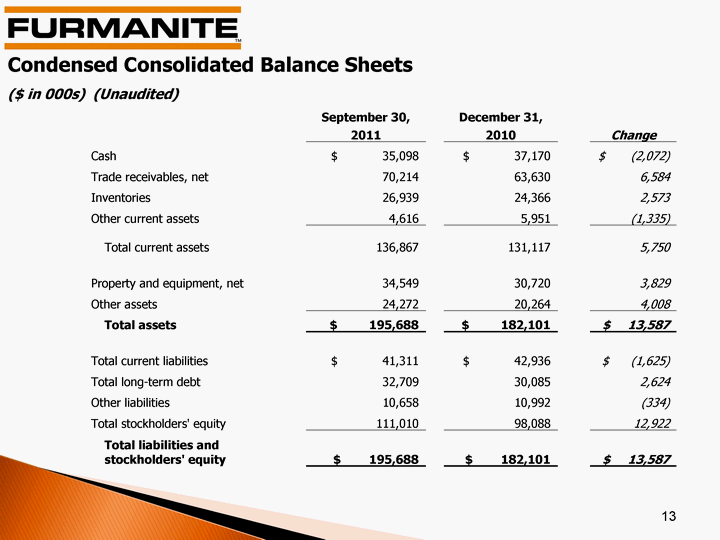
| Condensed Consolidated Balance Sheets ($ in 000s) (Unaudited) 13 September 30, December 31, 2011 2010 Change Cash $ 35,098 $ 37,170 $ (2,072) Trade receivables, net 70,214 63,630 6,584 Inventories 26,939 24,366 2,573 Other current assets 4,616 5,951 (1,335) Total current assets 136,867 131,117 5,750 Property and equipment, net 34,549 30,720 3,829 Other assets 24,272 20,264 4,008 Total assets $ 195,688 $ 182,101 $ 13,587 Total current liabilities $ 41,311 $ 42,936 $ (1,625) Total long-term debt 32,709 30,085 2,624 Other liabilities 10,658 10,992 (334) Total stockholders' equity 111,010 98,088 12,922 Total liabilities and stockholders' equity $ 195,688 $ 182,101 $ 13,587 |

| Condensed Consolidated Cash Flows ($ in 000s) (Unaudited) 14 For the Nine Months Ended For the Nine Months Ended For the Nine Months Ended For the Nine Months Ended For the Nine Months Ended September 30, September 30, September 30, September 30, September 30, 2011 2010 Change Net income $ 12,754 $ 5,762 $ 6,992 Depreciation, amortization and other non-cash items 6,238 5,683 555 Working capital changes (13,364) (3,483) (9,881) Net cash provide by operating activities 5,628 7,962 (2,334) Capital expenditures (3,915) (4,484) 569 Acquisition of assets and business (3,815) (350) (3,465) Payments on debt (85) (188) 103 Other, net 402 855 (453) Effect of exchange rate changes on cash (287) (130) (157) (Decrease) increase in cash and cash equivalents (2,072) 3,665 (5,737) Cash and cash equivalents at beginning of period 37,170 36,117 1,053 Cash and cash equivalents at end of period $ 35,098 $ 39,782 $ (4,684) |

| Furmanite Corporation QUARTER ENDED SEPTEMBER 30, 2011 Operations Review Joseph E. Milliron, President and Chief Operating Officer 15 |

| 16 at September 30, 2011 1,698 total employees 8 higher than September 30, 2010 1,251 technicians 38 higher than September 30, 2010 447 selling, general and administrative (SG&A) personnel 30 less than September 30, 2010 Costs aligned with revenues |

| As of September 30, 2011 17 |

| 18 Total Americas EMEA APAC On-line Services 3rd Qtr. 2011 $ 30,877 $ 15,678 $ 11,523 $ 3,676 On-line Services 3rd Qtr. 2010 26,020 12,099 8,990 4,931 Variance $ 4,857 $ 3,579 $ 2,533 $ (1,255) On-line Services YTD 2011 $ 90,426 $ 48,677 $ 31,689 $ 10,060 On-line Services YTD 2010 75,599 35,836 26,594 13,169 Variance $ 14,827 $ 12,841 $ 5,095 $ (3,109) Business and Geographic Data - On-line1 Services Revenues ($ in 000's) (Unaudited) 1 Formerly referred to as under-pressure services |

| Business and Geographic Data - Off-line1 Services Revenues ($ in 000's) (Unaudited) 19 1 Formerly referred to as turnaround services Total Americas EMEA APAC Off-line Services 3rd Qtr. 2011 $ 33,083 $ 12,388 $ 13,348 $ 7,347 Off-line Services 3rd Qtr 2010 30,041 11,935 13,864 4,242 Variance $ 3,042 $ 453 $ (516) $ 3,105 Off-line Services YTD 2011 $ 103,261 $ 48,153 $ 39,037 $ 16,071 Off-line Services YTD 2010 96,953 42,976 39,154 14,823 Variance $ 6,308 $ 5,177 $ (117) $ 1,248 |

| Furmanite Corporation Review of 3Q 2011 November 8, 2011 www.furmanite.com 20 |
