Attached files
| file | filename |
|---|---|
| 8-K - FORM 8-K - LCI INDUSTRIES | v239639_8k.htm |

2003 A Leading National Supplier of a Wide Variety of Components for RVs and Manufactured Homes Drew Industries Incorporated (NYSE: DW ) EXHIBIT 99.1

This presentation contains certain “forward - looking statements” within the meaning of the Private Securities Litigation Reform Act of 1995 with respect to financial condition, results of operations, business strategies, operating efficiencies or synergies, competitive position, growth opportunities for existing products, acquisitions, plans and objectives of management, markets for the Company’s Common Stock and other matters . Statements in this presentation that are not historical facts are “forward - looking statements” for the purpose of the safe harbor provided by Section 21 E of the Securities Exchange Act of 1934 and Section 27 A of the Securities Act of 1933 . Forward - looking statements, including, without limitation, those relating to our future business prospects, net sales, expenses and income (loss), cash flow, and financial condition, whenever they occur in this presentation are necessarily estimates reflecting the best judgment of our senior management at the time such statements were made, and involve a number of risks and uncertainties that could cause actual results to differ materially from those suggested by forward - looking statements . The Company does not undertake to update forward - looking statements to reflect circumstances or events that occur after the date the forward - looking statements are made . You should consider forward - looking statements, therefore, in light of various important factors, including those set forth in this presentation, and in our subsequent filings with the Securities and Exchange Commission . There are a number of factors, many of which are beyond the Company’s control, which could cause actual results and events to differ materially from those desrcibed in the forward - looking statements . These factors include, in addition to other matters desrcibed in this presentation, pricing pressures due to domestic and foreign competition, costs and availability of raw materials (particularly steel, steel - based components, and aluminum) and other components, availability of credit for financing the retail and wholesale purchase of manufactured homes and recreational vehicles (“RVs”), availability and costs of labor, inventory levels of retail dealers and manufacturers, levels of repossessed manufactured homes and RVs, changes in zoning regulations for manufactured homes, sales declines in the RV or manufactured housing industries, the financial condition of our customers, the financial condition of retail dealers of RVs and manufactured homes, retention and concentration of significant customers, the successful integration of recent acquisitions, interest rates, oil and gasoline prices, and the outcome of litigation . In addition, international, national and regional economic conditions and consumer confidence affect the retail sale of RVs and manufactured homes . Forward - Looking Statements - 1 -

SECTION I Overview - 2 -

46% 9% 18% 7% 1% 1% 5% 3% 10% Drew’s Products – Components for RVs and Manufactured Homes $628 Million of Net Sales for the12 Months Ended September 30, 2011 RV Chassis, Slide - outs and Other Chassis Parts: $290 million RV Windows and Doors: $116 million Other Products: $5 million Bath Products: $19 million Specialty Trailers: $5 million Axles and Suspension Products: $43 million MH Chassis and Chassis Parts: $33 million RV Furniture and Mattresses: $62 million - 3 - MH Windows and Doors: $55 million

Drew’s Segments – LTM 9/2011 MH = $102 million 16% RV = $526 million 84% 90% for towable RVs - 4 - Net Sales - $628 million MH = $4 million 54% RV = $3 million 46% Segment Operating Profit - $57 million RV = $50 million 84% MH = $10 million 16% MH = $10 million 18% RV = $47 million 82%

$147 $154 $134 $183 $221 $220 $177 $143 $85 $96 $102 $108 $171 $220 $348 $448 $509 $492 $368 $313 $477 $526 $255 $325 $353 $531 $511 $398 0 25 50 75 $100 0 250 500 $750 2001 2002 2003 2004 2005 2006 2007 2008 2009 2010 LTM 9/11 $ 669 $729 $669 $573 $628 (1) EBITDASO is operating profit plus depreciation, amortization, goodwill impairment and stock - based compensation (see page 39). MH Segment sales RV Segment sales EBITDASO - 5 - Financial Performance Sales and EBITDASO (1) (in millions) Sales EBITDASO

SECTION II Industries - 6 -

90% of industry 2010 unit sales 62% of 2010 wholesale dollar sales, or $4.3 billion Retail cost $4,000 to $100,000 per unit. Average about $25,000 RV Market 10% of industry 2010 unit sales 38% of 2010 wholesale dollar sales , or $2.7 billion Retail cost $41,000 to $400,000+ per unit. Average about $136,000 Travel trailer Fifth - wheel travel trailer Travel trailer with expandable ends Folding camping trailer Sport utility RV “Toy Hauler” Type C Motorhome Truck camper TOWABLE RVS (Approximately 90% of Drew’s RV Segment revenues) MOTORHOMES (3% of Drew’s RV Segment revenues) Type B Motorhome Type A Motorhome - 7 -
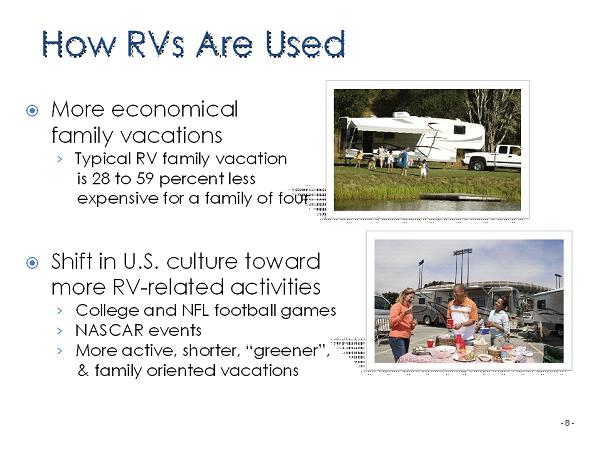
More economical family vacations › Typical RV family vacation is 28 to 59 percent less e xpensive for a family of four Shift in U.S. culture toward more RV - related activities › College and NFL football games › NASCAR events › More active, shorter, “greener”, & family oriented vacations How RVs Are Used - 8 -

90% of Drew’s RV product sales are for Travel Trailers and 5 th Wheel RVs 155 178 177 157 196 214 254 281 293 262 185 138 199 207 207 74 71 62 71 55 45 43 42 42 36 24 15 18 16 13 64 72 61 49 60 62 73 61 56 55 28 13 25 25 23 59 78 101 108 171 220 346 448 509 492 368 313 477 526 $0 $100 $200 $300 $400 $500 $600 0 100 200 300 400 500 600 Motorhomes Other Towables Travel Trailers & 5th Wheel Drew RV Segment Sales (1) Projection for 2012 is the latest published by the RVIA (August 2011). (Units in thousands, Sales in millions) - 9 - 166 257 293 321 300 311 321 370 384 391 353 237 RVs - Industry Wholesale Shipments Industry Units Drew’s Sales 243 242 RV Share 53% 55% 59% 61% 63% 67% 69% 73% 75% 74% 78% 83% 82% 83% 85% Held by TT & 5 th Wheels 248
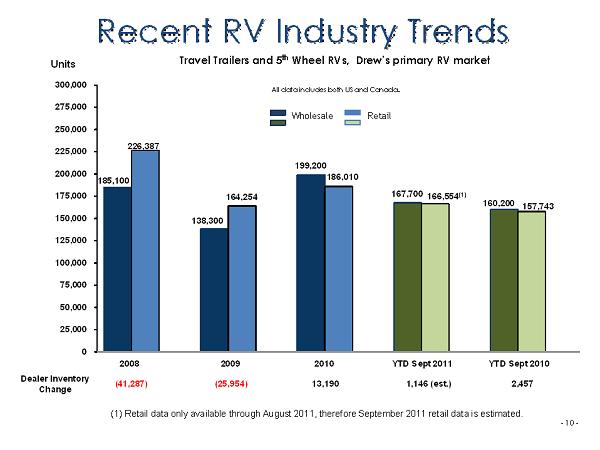
185,100 138,300 199,200 167,700 160,200 226,387 164,254 186,010 166,554 (1) 157,743 0 25,000 50,000 75,000 100,000 125,000 150,000 175,000 200,000 225,000 250,000 275,000 300,000 Units Travel Trailers and 5 th Wheel RVs, Drew’s primary RV market Wholesale Retail - 10 - Recent RV Industry Trends All data includes both US and Canada . Dealer Inventory Change 2008 2009 2010 YTD Sept 2011 YTD Sept 2010 (41,287) (25,954) 13,190 1,146 (est.) 2,457 (1) Retail data only available through August 2011, therefore September 2011 retail data is estimated.

Cost per sq. ft. is $41 for MH vs. $84 for site - built homes Average retail price of $63,100 for a 1,530 sq. ft. MH 9 million manufactured homes across the U.S. Improved quality, appearance and safety Studies have shown that MHs built since 1995 sustain no more damage in hurricanes than site - built homes Industry production was down 9% for the 12 months ended September 30, 2011 Manufactured Housing (MH) Market - 11 -
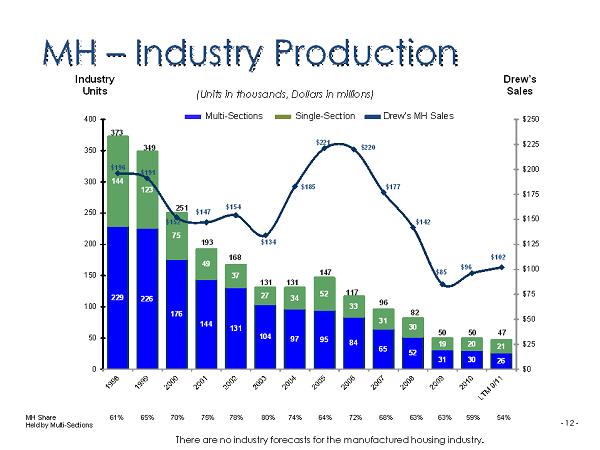
229 226 176 144 131 104 97 95 84 65 52 31 30 26 144 123 75 49 37 27 34 52 33 31 30 19 20 21 $0 $25 $50 $75 $100 $125 $150 $175 $200 $225 $250 0 50 100 150 200 250 300 350 400 - 12 - MH – Industry Production Single - Sect ion Multi - Sections Drew’s MH Sales $177 $220 $221 $ 185 $134 $154 $147 $152 $191 $196 (Units in thousands, Dollars in millions) 373 349 96 82 117 147 131 131 168 193 Industry Units Drew’s Sales $142 50 $85 251 50 $96 There are no industry forecasts for the manufactured housing industry. 47 $102 MH Share 61% 65% 70% 75% 78% 80% 74% 64% 72% 68% 63% 63% 59% 54% Held by Multi - Sections

MH: Favorable Factors - 13 - INDUSTRY: Demand ― Demand for quality, affordable housing is likely to increase ― Baby boomers retiring in increasing numbers ― Dealer and manufacturer inventory levels are reasonable Availability of financing is still an issue, as is the weak overall housing market DREW: Drew remains profitable in MH Segment: 10.1% operating profit margin for the 12 months ended September 30, 2011 Drew’s overall MH Segment sales are up 7% for the 12 months ended September 30, 2011 Drew’s content per manufactured home increased 11% to $1,527 for the twelve months ended September 30, 2011

SECTION III Strategy - 14 -

Business Strategy Maximize profitability and return on assets through ▪ Strategic acquisitions ▪ New product introductions ▪ Market share growth ▪ Operational efficiencies ▪ Diversification to related industries This strategy accomplished through ▪ Outstanding customer service ▪ Motivating management through strong profit incentives ▪ Low cost manufacturing: » Optimizing production efficiencies and implementing stringent cost controls » Facility consolidations and fixed cost reductions ▪ Working capital management ▪ R & D efforts ▪ Disciplined and patient acquisition philosophy - 15 -

Acquisition Criteria - 16 - Drew is a disciplined and patient acquirer Gain market share or add products from other suppliers through asset acquisitions Seek products or technologies that we can expand through our nationwide customer base and factory network Become an even more extensive supplier to our customers Consider acquisitions in similar markets, such as components for mid - size buses and trailers used to haul boats, horses, livestock, equipment and other cargo
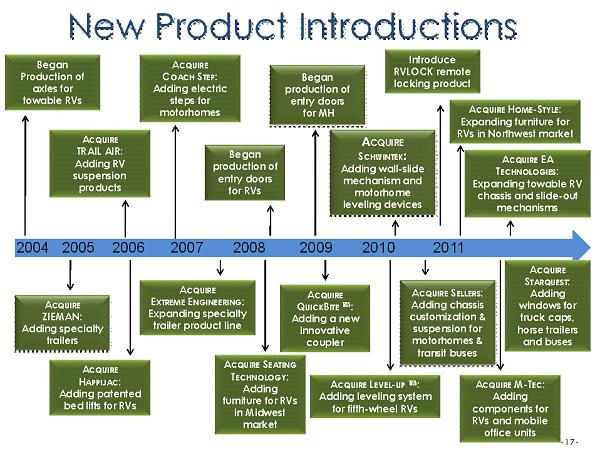
New Product Introductions - 17 - Began production of entry doors for RVs Began Production of axles for towable RVs 2004 2005 2006 2007 2008 2009 2010 2011 A CQUIRE H APPIJAC : Adding patented bed lifts for RVs A CQUIRE E XTREME E NGINEERING : Expanding specialty trailer product line A CQUIRE S EATING T ECHNOLOGY : Adding furniture for RVs in Midwest market A CQUIRE C OACH S TEP : Adding electric steps for motorhomes A CQUIRE TRAIL AIR: Adding RV suspension products A CQUIRE Q UICK B ITE TM : Adding a new innovative coupler Began production of entry doors for MH A CQUIRE ZIEMAN: Adding specialty trailers A CQUIRE L EVEL - UP TM : Adding leveling system for fifth - wheel RVs A CQUIRE S CHWINTEK : Adding wall - slide mechanism and motorhome leveling devices A CQUIRE S ELLERS : Adding chassis customization & suspension for motorhomes & transit buses Introduce RVLOCK remote locking product A CQUIRE H OME - S TYLE : Expanding furniture for RVs in Northwest market A CQUIRE M - T EC : Adding components for RVs and mobile office units A CQUIRE EA T ECHNOLOGIES : Expanding towable RV chassis and slide - out mechanisms A CQUIRE S TARQUEST : Adding windows for truck caps, horse trailers and buses
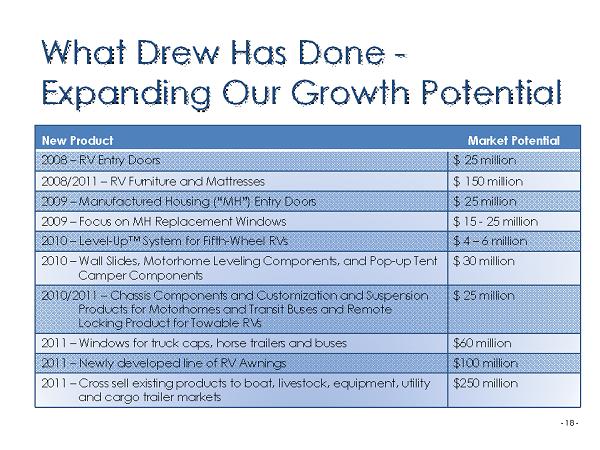
What Drew Has Done - Expanding Our Growth Potential - 18 - New Product Market Potential 2008 – RV Entry Doors $ 25 million 2008/2011 – RV Furniture and Mattresses $ 150 million 2009 – Manufactured Housing (“MH”) Entry Doors $ 25 million 2009 – Focus on MH Replacement Windows $ 15 - 25 million 2010 – Level - Up™ System for Fifth - Wheel RVs $ 4 – 6 million 2010 – Wall Slides, Motorhome Leveling Components, and Pop - up Tent Camper Components $ 30 million 2010/2011 – Chassis Components and Customization and Suspension Products for Motorhomes and Transit Buses and Remote Locking Product for Towable RVs $ 25 million 2011 – Windows for truck caps, horse trailers and buses $ 60 million 2011 – Newly developed line of RV Awnings $ 100 million 2011 – Cross sell existing products to boat, livestock, equipment, utility and cargo trailer markets $ 250 million
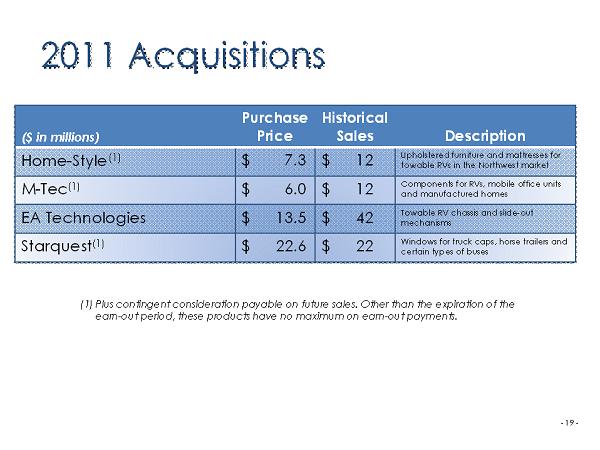
($ in millions) Purchase Price Historical Sales Desrciption Home - Style (1) $ 7.3 $ 12 Upholstered furniture and mattresses for towable RVs in the Northwest market M - Tec (1) $ 6.0 $ 12 Components for RVs, mobile office units and manufactured homes EA Technologies $ 13.5 $ 42 Towable RV chassis and slide - out mechanisms Starquest (1) $ 22.6 $ 22 Windows for truck caps, horse trailers and certain types of buses 2011 Acquisitions - 19 - (1) Plus contingent consideration payable on future sales. Other than the expiration of the earn - out period, these products have no maximum on earn - out payments.

Content Per New Towable RV $670 $862 $1,012 $1,281 $1,374 $1,542 $1,716 $1,847 $2,010 $2,168 $2,289 2001 2002 2003 2004 2005 2006 2007 2008 2009 2010 LTM 9/11 RV Segment operating profit margin 8.7 % 10.0 % 11.6 % 9.7% 9.6% 8.3% 12.2% 6.7% 5.0% 9.3% 8.9% - 20 - See Page 9 for Industry Information - 90% of RV Segment sales are for Travel Trailers and Fifth - Wheel RVs - 100% market share in existing products would yield $4,500 to $5,000 per Towable RV - Growth in RV “features” drives content increases At industry production levels for the last 12 months ended September 2011, each $100 increase in content adds approximately $21 million in sales for Drew.

$ 473 million 90% $ 17 million 3% $ 12 million 2% $24 million 5% LTM 9/11 - $526 Million Travel Trailer & Fifth-Wheel - OEM Motorhome - OEM Aftermarket Other RV Segment Net Sales by Type $431 million 91% $ 17 million 4% $ 11 million 2% $ 16 million 3% LTM 9/10 - $475 Million Travel Trailer & Fifth-Wheel - OEM Motorhome - OEM Aftermarket Other - 21 -

- 100% market share in existing products would yield $3,600 to $4,000 per home - Affordability of the homes constrains content growth Content Per New Manufactured Home MH Segment operating profit margin 10.4% 10.7% 10.5% 10.4% 10.3% 8.7% 8.1% 7.2% 3.8% 10.0% 10.1% 2001 2002 2003 2004 2005 2006 2007 2008 2009 2010 LTM 9/11 $663 $796 $871 $1,281 $1,330 $1,666 $1,450 $ 1,429 $ 1,333 $ 1,373 $1,527 See Page 12 for Industry Information - 22 - Sections per home 1.77 1.81 1.83 1.78 1.68 1.76 1.71 1.65 1.65 1.61 1.56

$72 million 71% $ 17 million 16% $ 13 million 13% LTM 9/11 - $102 Million OEM Aftermarket Other MH Segment Net Sales by Type $71 million 74% $ 16 million 17% $9 million 9% LTM 9/10 - $96 Million OEM Aftermarket Other - 23 -
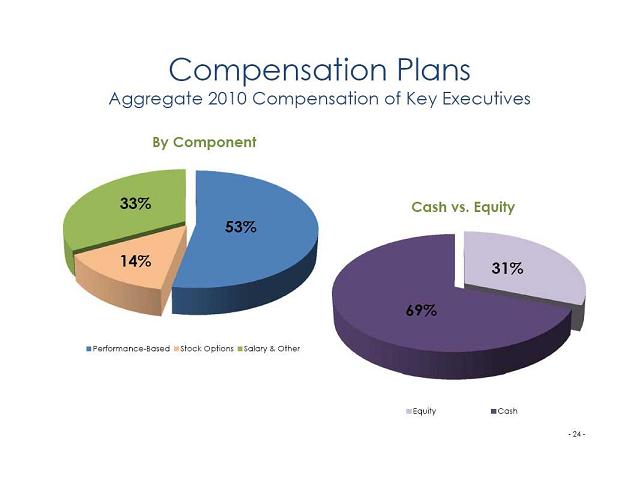
53% 14% 33% By Component Performance-Based Stock Options Salary & Other Compensation Plans Aggregate 2010 Compensation of Key Executives 31% 69% Cash vs. Equity Equity Cash - 24 -

SECTION IV Operating Results - 25 -
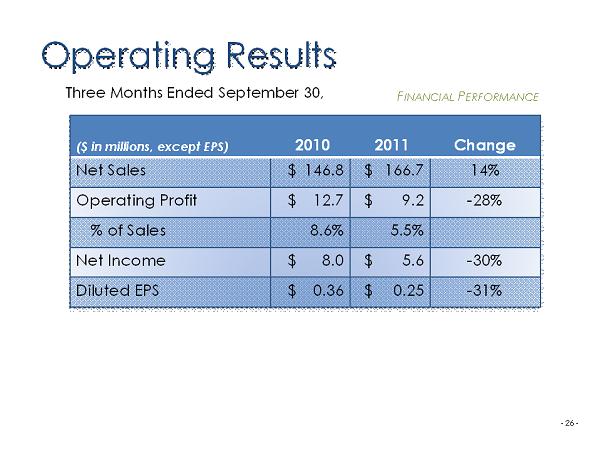
($ in millions, except EPS) 2010 2011 Change Net Sales $ 146.8 $ 166.7 14% Operating Profit $ 12.7 $ 9.2 - 28% % of Sales 8.6 % 5.5% Net Income $ 8.0 $ 5.6 - 30% Diluted EPS $ 0.36 $ 0.25 - 31% Operating Results Three Months Ended September 30, - 26 - F INANCIAL P ERFORMANCE

($ in millions, except EPS) 2010 2011 Change Net Sales $ 466.6 $ 521.6 12% Operating Profit $ 40.8 $ 42.7 4% % of Sales 8.8 % 8.2% Net Income $ 24.9 $ 26.0 4% Diluted EPS $ 1.12 $ 1.16 4% Operating Results Nine Months Ended September 30, - 27 - F INANCIAL P ERFORMANCE
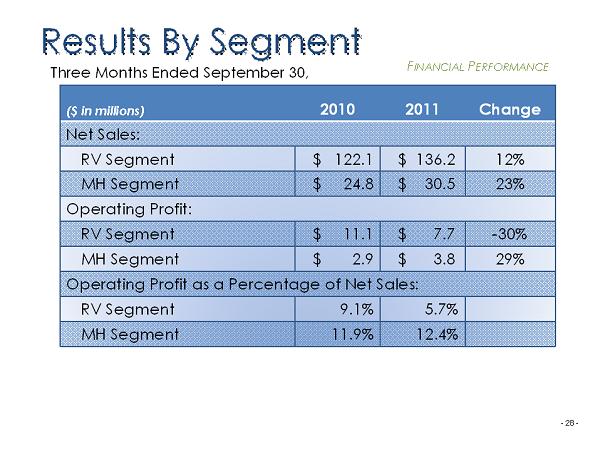
($ in millions) 2010 2011 Change Net Sales: RV Segment $ 122.1 $ 136.2 12% MH Segment $ 24.8 $ 30.5 23% Operating Profit: RV Segment $ 11.1 $ 7.7 - 30% MH Segment $ 2.9 $ 3.8 29% Operating Profit as a Percentage of Net Sales: RV Segment 9.1% 5.7% MH Segment 11.9% 12.4% Results By Segment Three Months Ended September 30, - 28 - F INANCIAL P ERFORMANCE
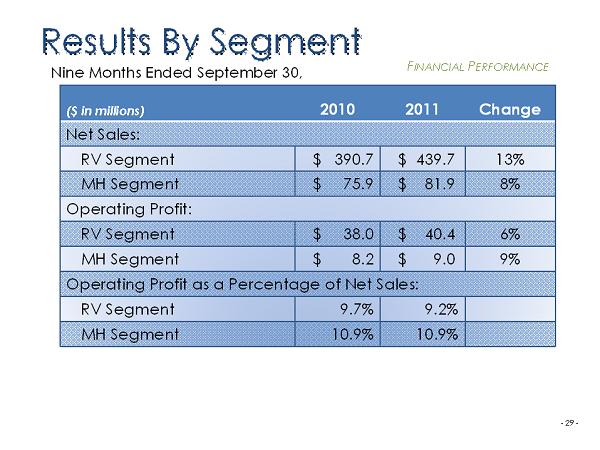
($ in millions) 2010 2011 Change Net Sales: RV Segment $ 390.7 $ 439.7 13% MH Segment $ 75.9 $ 81.9 8% Operating Profit: RV Segment $ 38.0 $ 40.4 6% MH Segment $ 8.2 $ 9.0 9% Operating Profit as a Percentage of Net Sales: RV Segment 9.7% 9.2% MH Segment 10.9% 10.9% Results By Segment Nine Months Ended September 30, - 29 - F INANCIAL P ERFORMANCE

Net Sales Compared to Pre - Recession Levels - 30 - Q3 2007 – Q3 2011 ($ in millions) Q3 2007 $ 173 . 4 Impact of industry - wide shipments: Travel Trailer and Fifth - Wheel RVs – 25% decline ( 30 . 8 ) Motorhomes – 59% decline ( 3 . 9 ) Manufactured Housing – 45% decline ( 16 . 9 ) Subtotal – Impact of Industry Declines ( 51 . 6 ) Drew’s sales growth (1) 44 . 9 Q3 2011 $ 166.7 F INANCIAL P ERFORMANCE (1) Includes market share growth, new product introductions, acquisitions, as well as increased aftermarket sales and sales price increases.
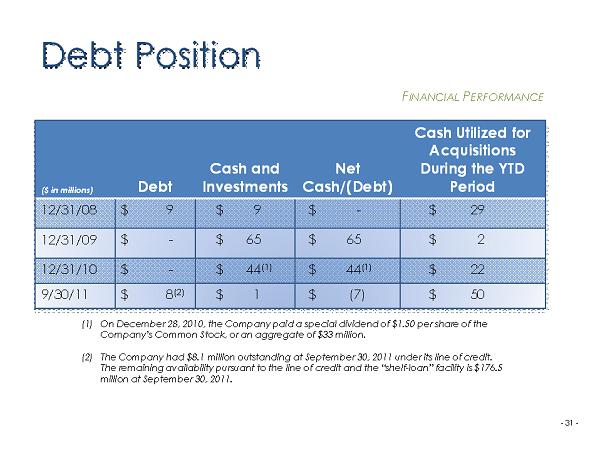
($ in millions) Debt Cash and Investments Net Cash/(Debt) Cash Utilized for Acquisitions During the YTD Period 12/31/08 $ 9 $ 9 $ - $ 29 12/31/09 $ - $ 65 $ 65 $ 2 12/31/10 $ - $ 44 (1) $ 44 (1) $ 22 9/30/11 $ 8 (2) $ 1 $ (7) $ 50 Debt Position - 31 - F INANCIAL P ERFORMANCE (1) On December 28, 2010, the Company paid a special dividend of $1.50 per share of the Company’s Common Stock, or an aggregate of $33 million. (2) The Company had $8.1 million outstanding at September 30, 2011 under its line of credit. The remaining availability pursuant to the line of credit and the “shelf - loan” facility is $176.5 million at September 30, 2011.
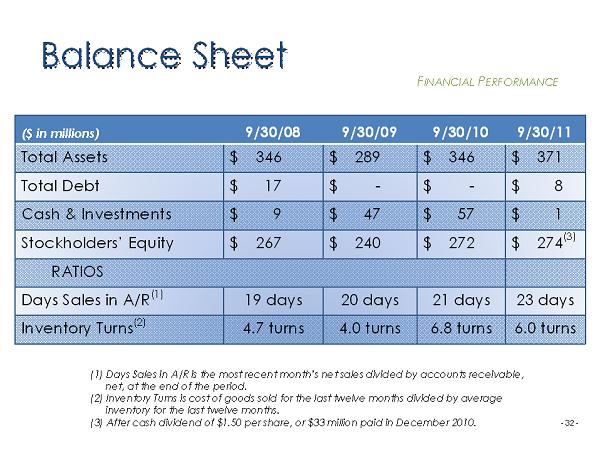
($ in millions) 9/30/08 9/30/09 9/30/10 9/30/11 Total Assets $ 346 $ 289 $ 346 $ 371 Total Debt $ 17 $ - $ - $ 8 Cash & Investments $ 9 $ 47 $ 57 $ 1 Stockholders’ Equity $ 267 $ 240 $ 272 $ 274 (3) RATIOS Days Sales in A/R (1) 19 days 20 days 21 days 23 days Inventory Turns (2) 4.7 turns 4.0 turns 6.8 turns 6.0 turns Balance Sheet - 32 - F INANCIAL P ERFORMANCE (1) Days Sales in A/R is the most recent month’s net sales divided by accounts receivable, net, at the end of the period. (2) Inventory Turns is cost of goods sold for the last twelve months divided by average inventory for the last twelve months. (3) After cash dividend of $1.50 per share, or $33 million paid in December 2010.

Cash Flow - 33 - Significant non - operating items since September 30, 2007 Acquisitions (11) $ 102 million Debt reduction $ 35 million Special dividend $ 33 million Stock repurchases $ 10 million Total $ 180 million F INANCIAL P ERFORMANCE
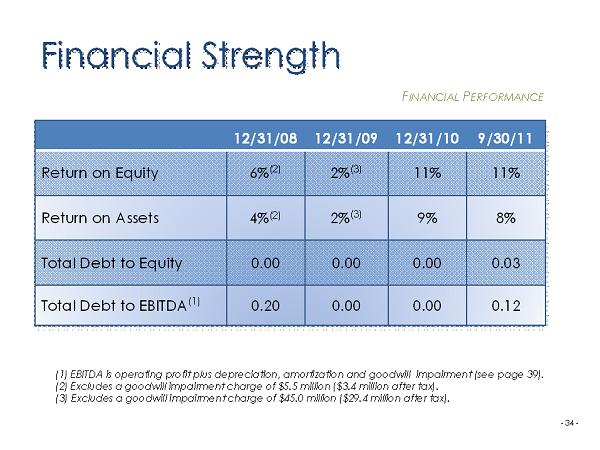
12/31/08 12/31/09 12/31/10 9/30/11 Return on Equity 6% (2) 2% (3) 11% 11% Return on Assets 4% (2) 2% (3) 9% 8% Total Debt to Equity 0.00 0.00 0.00 0.03 Total Debt to EBITDA (1) 0.20 0.00 0.00 0.12 Financial Strength (1) EBITDA is operating profit plus depreciation, amortization and goodwill impairment (see page 39). (2) Excludes a goodwill impairment charge of $5.5 million ($ 3.4 million after tax). (3) Excludes a goodwill impairment charge of $45.0 million ($29.4 million after tax ). - 34 - F INANCIAL P ERFORMANCE

Increasing RV content RV recovery from recession Demographic tailwind Exploring similar industries Affordable housing recovery The Future - 35 -
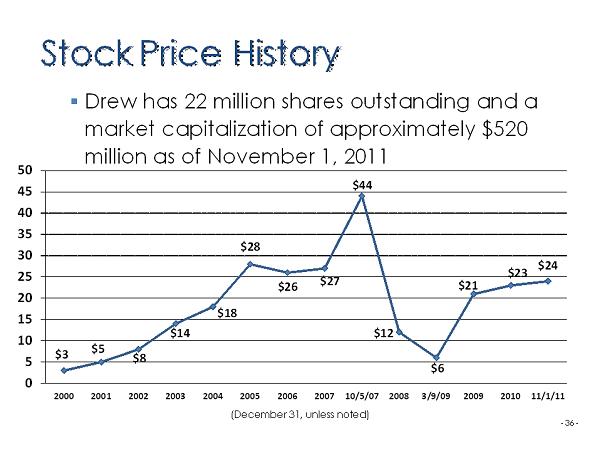
Stock Price History $3 $5 $8 $14 $18 $28 $26 $27 $44 $12 $6 $21 $23 $24 0 5 10 15 20 25 30 35 40 45 50 2000 2001 2002 2003 2004 2005 2006 2007 10/5/07 2008 3/9/09 2009 2010 11/1/11 ▪ Drew has 22 million shares outstanding and a market capitalization of approximately $520 million as of November 1, 2011 (December 31, unless noted) - 36 -
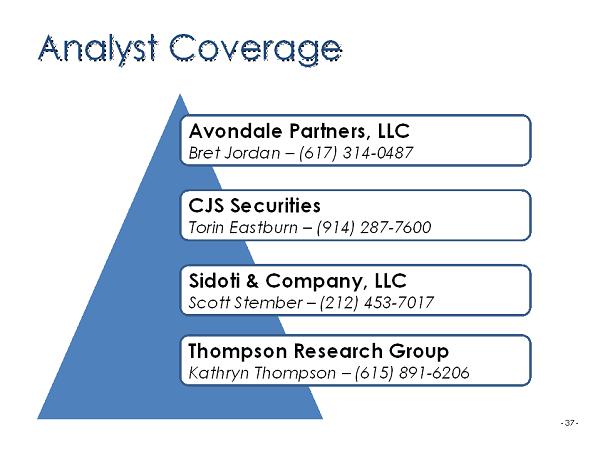
Analyst Coverage - 37 - CJS Securities Torin Eastburn – (914) 287 - 7600 Thompson Research Group Kathryn Thompson – (615) 891 - 6206 Sidoti & Company, LLC Scott Stember – (212) 453 - 7017 Avondale Partners, LLC Bret Jordan – (617) 314 - 0487

Thank you! Joseph S. Giordano III CFO & Treasurer 914 - 428 - 9098 joe@drewindustries.com OR VISIT OUR WEBSITE: www.drewindustries.com For more information contact: - 38 - Fredric M. Zinn President and CEO 914 - 428 - 9098 fred@drewindustries.com
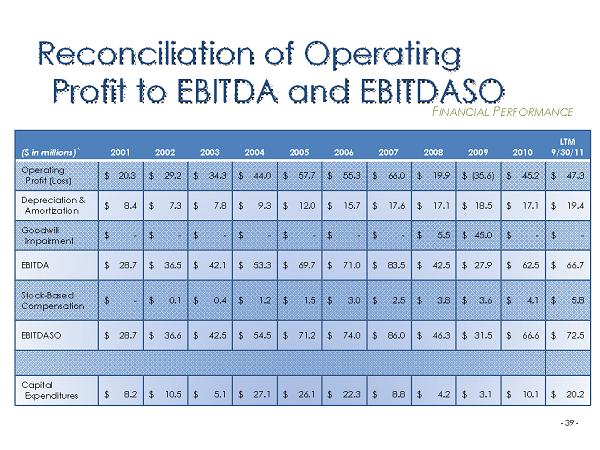
($ i n millions)` 2001 2002 2003 2004 2005 2006 2007 2008 2009 2010 LTM 9/30/11 Operating Profit (Loss) $ 20.3 $ 29.2 $ 34.3 $ 44.0 $ 57.7 $ 55.3 $ 66.0 $ 19.9 $ (35.6) $ 45.2 $ 47.3 Depreciation & Amortization $ 8.4 $ 7.3 $ 7.8 $ 9.3 $ 12.0 $ 15.7 $ 17.6 $ 17.1 $ 18.5 $ 17.1 $ 19.4 Goodwill Impairment $ - $ - $ - $ - $ - $ - $ - $ 5.5 $ 45.0 $ - $ - EBITDA $ 28.7 $ 36.5 $ 42.1 $ 53.3 $ 69.7 $ 71.0 $ 83.5 $ 42.5 $ 27.9 $ 62.5 $ 66.7 Stock - Based Compensation $ - $ 0.1 $ 0.4 $ 1.2 $ 1.5 $ 3.0 $ 2.5 $ 3.8 $ 3.6 $ 4.1 $ 5.8 EBITDASO $ 28.7 $ 36.6 $ 42.5 $ 54.5 $ 71.2 $ 74.0 $ 86.0 $ 46.3 $ 31.5 $ 66.6 $ 72.5 Capital Expenditures $ 8.2 $ 10.5 $ 5.1 $ 27.1 $ 26.1 $ 22.3 $ 8.8 $ 4.2 $ 3.1 $ 10.1 $ 20.2 Reconciliation of Operating Profit to EBITDA and EBITDASO - 39 - F INANCIAL P ERFORMANCE

($ in millions) 12 Months Ended 2007 2008 2009 2010 9/30/11 Net Sales: RV Segment MH Segment $ 491.8 176.8 $ 368.1 142.4 $ 312.5 85.3 $ 477.2 95.6 $ 526.2 101.6 Total Net Sales $ 668.6 $ 510.5 $ 397.8 $ 572.8 $ 627.8 Operating Profit: RV Segment MH Segment $ 60.1 14.2 $ 24.6 10.3 $ 15.7 3.2 $ 44.4 9.6 $ 46.8 10.3 Total Segment Operating Profit 74.3 34.9 18.9 54.0 57.1 Corporate (7.8) (7.4) (6.5) (8.0) (8.0) Goodwill Impairment - (5.5) (45.0) - - Other Non - Segment Items (0.5) (2.1) (2.9) (0.6) (1.8) Total Operating Profit $ 66.0 $ 19.9 $ (35.6) $ 45.4 $ 47.3 F INANCIAL P ERFORMANCE - 40 - Reconciliation of Segment Results to Consolidated