Attached files
| file | filename |
|---|---|
| 8-K - FORM 8-K - Bristow Group Inc | d251636d8k.htm |
 Second Quarter FY 2012
Earnings Presentation
Bristow Group Inc.
November 8, 2011
Exhibit 99.1 |
 2
Second quarter earnings call agenda
Introduction
CEO remarks and operational highlights
Current and future financial performance
-
FY12 Q2 Financial discussion
-
Update on capital return
Closing remarks
Questions and answers
Linda McNeill, Director Investor Relations
Bill Chiles, President and CEO
Jonathan Baliff, SVP and CFO
Bill Chiles, President and CEO |
 3
Forward-looking statements
This
presentation
may
contain
“forward-looking
statements”
within
the
meaning
of
the
Private
Securities
Litigation
Reform
Act
of
1995.
Forward-looking
statements
include
statements
about
our
future
business,
operations,
capital
expenditures,
fleet
composition,
capabilities
and
results;
modeling
information,
earnings
guidance,
expected
operating
margins
and
other
financial
projections;
future
dividends,
share
repurchase
and
other
uses;
plans,
strategies
and
objectives
of
our
management,
including
our
plans
and
strategies
to
grow
earnings
and
our
business,
our
general
strategy
going
forward
and
our
business
model;
expected
actions
by
us
and
by
third
parties,
including
our
customers,
competitors
and
regulators;
share
repurchase
and
other
uses
of
excess
cash;
the
valuation
of
our
company
and
its
valuation
relative
to
relevant
financial
indices;
assumptions
underlying
or
relating
to
any
of
the
foregoing,
including
assumptions
regarding
factors
impacting
our
business,
financial
results
and
industry;
and
other
matters.
Our
forward-looking
statements
reflect
our
views
and
assumptions
on
the
date
of
this
presentation
regarding
future
events
and
operating
performance.
They
involve
known
and
unknown
risks,
uncertainties
and
other
factors,
many
of
which
may
be
beyond
our
control,
that
may
cause
actual
results
to
differ
materially
from
any
future
results,
performance
or
achievements
expressed
or
implied
by
the
forward-looking
statements.
These
risks,
uncertainties
and
other
factors
include
those
discussed
under
the
captions
“Risk
Factors”
and
“Management’s
Discussion
and
Analysis
of
Financial
Condition
and
Results
of
Operations”
in
our
Annual
Report
on
Form
10-K
for
the
fiscal
year
ended
March
31,
2011
and
our
Quarterly
Report
on
Form
10-Q
for
the
quarter
ended
September
30,
2011.
We
do
not
undertake
any
obligation,
other
than
as
required
by
law,
to
update
or
revise
any
forward-
looking
statements,
whether
as
a
result
of
new
information,
future
events
or
otherwise. |
 4
Chief Executive comments
Bill
Chiles,
President
and
CEO |
 5
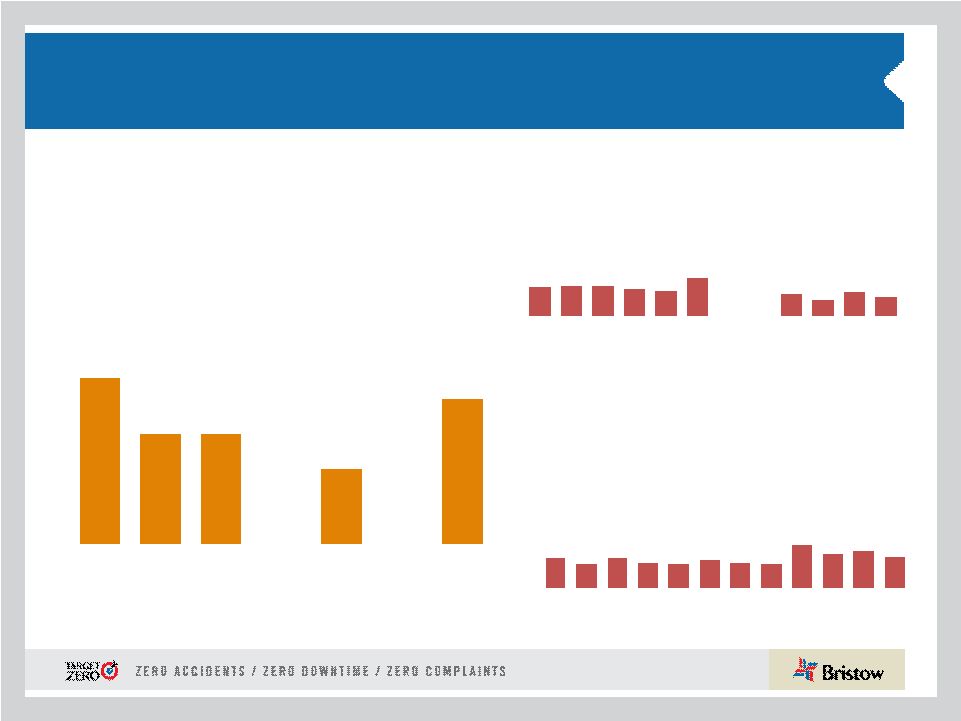
Operational safety review
0.33
0.34
0.34
0.31
0.28
0.43
0.00
0.00
0.25
0.18
0.27
0.22
0.00
0.50
1.00
O
N
D
J
F
M
A
M
J
J
A
S
1.17
0.78
0.78
0.00
0.00
1.02
0.54
0.00
1.00
2.00
2006
2007
2008
2009
2010
2011
YTD 2012
* Includes consolidated commercial operations only
0.16
0.13
0.16
0.14
0.13
0.15
0.14
0.13
0.23
0.18
0.20
0.17
0.00
0.10
0.20
0.30
0.40
0.50
O
N
D
J
F
M
A
M
J
J
A
S
Total Reportable Injury Rate per 200,000 man-
hours (cumulative)
Lost Work Case Rate per 200,000
man-hours (cumulative)
Air Accident Rate* per 100,000
Flight Hours (Fiscal Year)
FY11
FY12
FY11
FY12 |
 6
Q2 FY12 highlights
•
Quarterly performance was negatively affected by a non-cash inventory write
down, a decrease in earnings from unconsolidated affiliates, an impairment
charge resulting from a base closure, and the loss on the disposal of a fixed
wing aircraft
•
Strong cash flow generation allows us to deliver on commitment to create a
balanced return as evidenced by (up to) $100 million share buyback program
•
Bristow
revises
earnings
per
share
guidance
for
the
full
FY12
to
$3.05
-
$3.30
•
Q2 operating revenue of $297.1M (4% increase from Q2 FY11, 4% increase from Q1
FY12) •
Q2 GAAP EPS of $0.07 (93% decrease from Q2 FY11, 88% decrease from Q1 FY12)
•
Q2 adjusted EPS * of $0.63 (38% decrease from Q2 FY11, 17% increase from Q1
FY12) •
Q2 operating income of $9.6M (82% decrease from Q2 FY11, 74% decrease from Q1
FY12) •
Q2 adjusted operating income * of $38.5M (25% decrease from Q2 FY11, 10% increase
from Q1 FY12) •
Q2 adjusted EBITDA * of $62.1M (15% decrease from Q2 FY11, 7% increase from Q1
FY12) •
Q2 operating cash flow of $64.1M (51% increase from Q2 FY11, 21%
increase from Q1 FY12)
* Adjusted EPS, adjusted operating income and adjusted EBITDA amounts exclude
gains and losses on dispositions of assets and any special items
during
the
period.
See
reconciliation
of
these
items
to
GAAP
measures
in
appendix
and
our
earnings
release
for
the
quarter
ended
September 30, 2011 |
 7
•
Brent remains above $100 in the face of weak global economy. OPEC expected
to defend $90/b -
$100/b Brent
•
Momentum continues to build in the U.S. Gulf of Mexico with restart of
deepwater drilling
•
International oil service up-cycle is continuing to steadily unfold; however
costs to fulfill growth are impacting many providers this quarter
•
Strong helicopter activity returning to pre-recession levels with increasing
tender activity and tightening helicopter availability
•
Today we are bidding for contracts requiring 20-25 new large aircraft starting
in 2012 and 2013. Bidding activity over the next six months is expected to
double requiring over 40 new large aircraft
•
81% of our consolidated operating revenue and 94% of our business unit
operating income came from international markets this quarter
Current market environment
Source: Barclays Capital Research and PFC Energy October 2011
|
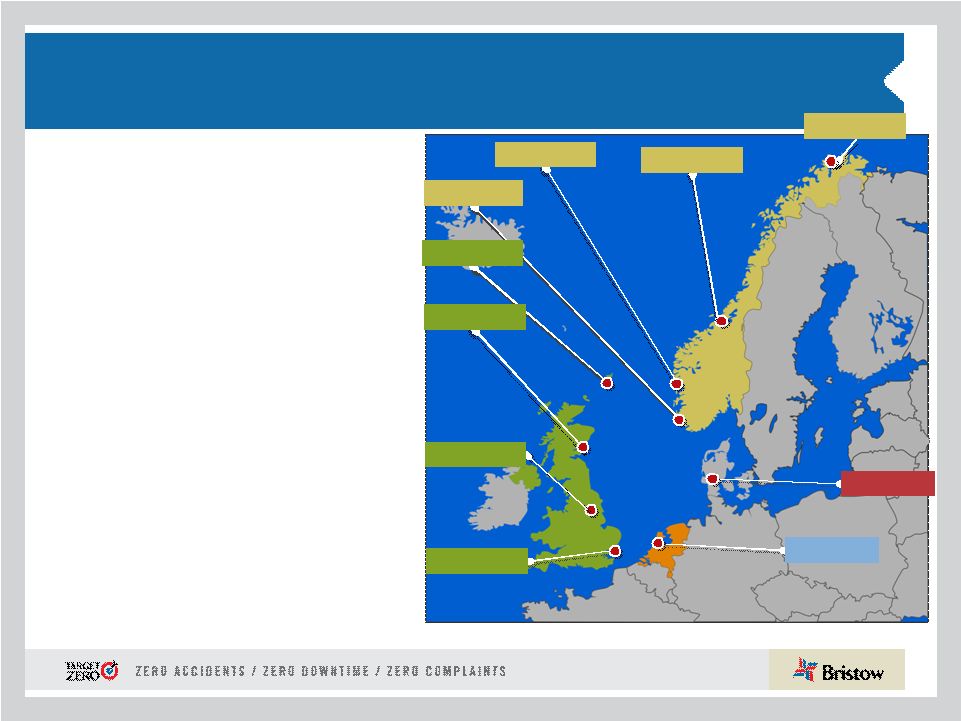        8
•
Europe represents 38% of total Bristow
operating revenue in Q2FY12 and 52% of
operating income
•
Operating margin of 20.7% vs 22.1% in prior
year quarter
•
Increased oil and gas revenue and flying
hours primarily from customers in Southern
North Sea and Aberdeen
•
Higher salary and benefit costs in Norway
and increased maintenance costs
•
Search and Rescue (SAR) UK Gap bid
submitted; Norwegian SAR pre-qualified
Outlook:
•
Continued high tender activity
•
New incremental work starting, including
two large aircraft in Norway continuing
market share gains
•
FBH was awarded Dutch Antilles SAR
contract for two large aircraft
FY12 operating margin expected to
be ~low twenties
Europe (EBU)
UK
Netherlands
Norway
Norwich
Aberdeen
Scasta
Stavanger
Den Helder
Bergen
Hammerfest
Esbjerg
Humberside
Kristiansund |
   9
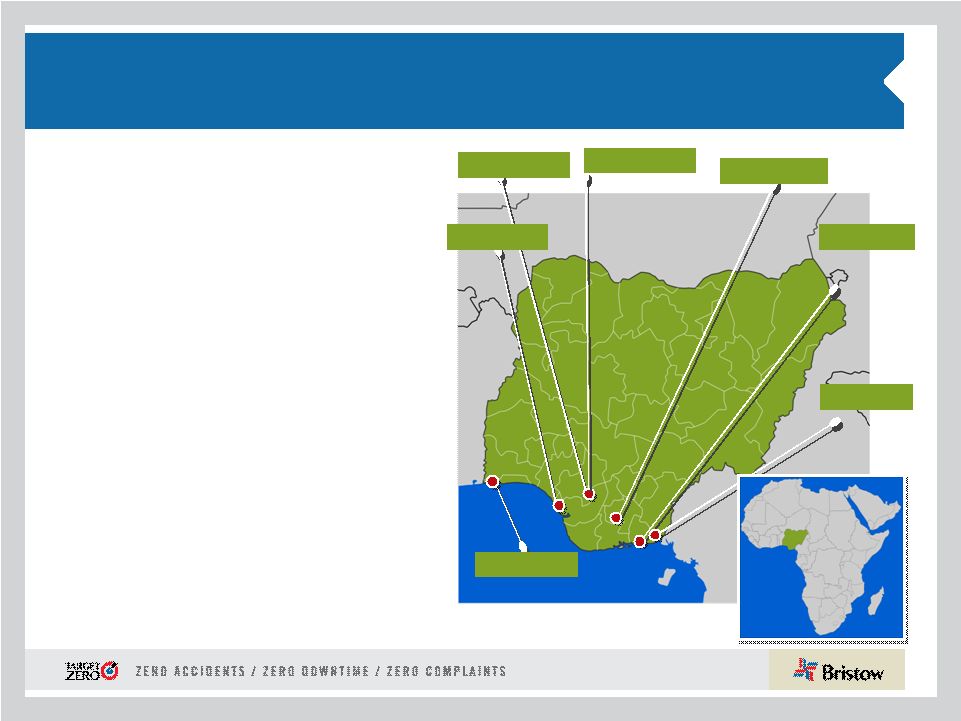
West Africa (WASBU)
Nigeria
Lagos
Escravos
Port Harcourt
Warri Osubi
Eket
Calabar
•
Nigeria represents 19% of total Bristow operating
revenue in Q2 FY12 and 36% of operating income
•
Operating revenue of $61.1M increased from
$56.2M in Q2 FY11 with operating income
decreased slightly to $16.1M from $17.2M from
prior year quarter
•
Operating margin of 26.4% vs 30.5% in prior year
quarter due to increase in maintenance,
depreciation, training and travel expense
•
$1.1M loss on fixed wing aircraft damaged in
incident
•
Record flight hours due to competitor aircraft
model type grounding; however, not expected to
continue
Outlook:
•
Incremental contracts at attractive rates
•
Focus on Client Promise and reducing working
capital
•
Organizational restructuring continues
FY12 operating margin expected to be
~ low to mid twenties
Warri Texaco |
    10
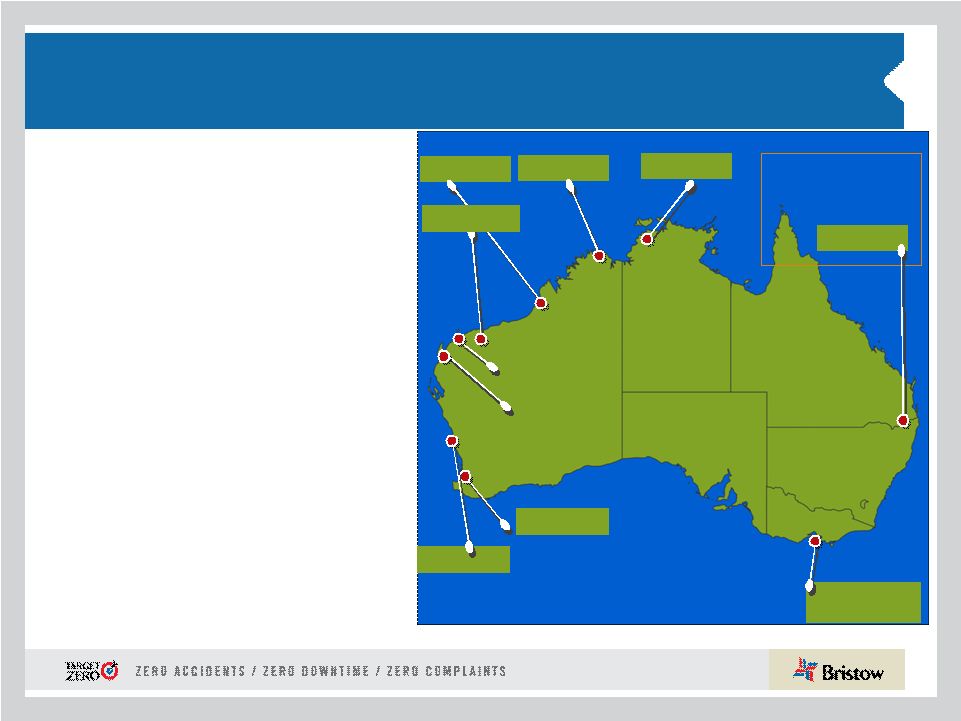
Exmouth
Varanus Is
Barrow Is
Australia (AUSBU)
Australia
Perth
Dongara
Essendon
Tooradin
Broome
Truscott
Darwin
BDI provide support
to the Republic of
Singapore Air Force
Oakey
•
Australia represented 12% of total Bristow
operating revenue in Q2 FY12 and 1% of
operating income
•
Operating revenue of $30.5M decreased from
$34.2M Q2 prior year primarily due to
continued delayed activity
•
Operating income decreased from $6.1M in
Q2 FY11 to $0.6M in Q2 FY12 due to
reduced overall volume of work combined
with relatively high overhead
•
Operating margin decreased to 1.9% vs
17.8% for the prior year quarter due to
continued labor costs associated with lost
contract
Outlook:
•
Additional new technology work confirmed in
FY12 with two key operators
•
Other first half work delayed until late FY12,
early FY13
FY12 operating margin expected
to be ~ mid teens
Karratha |
 11
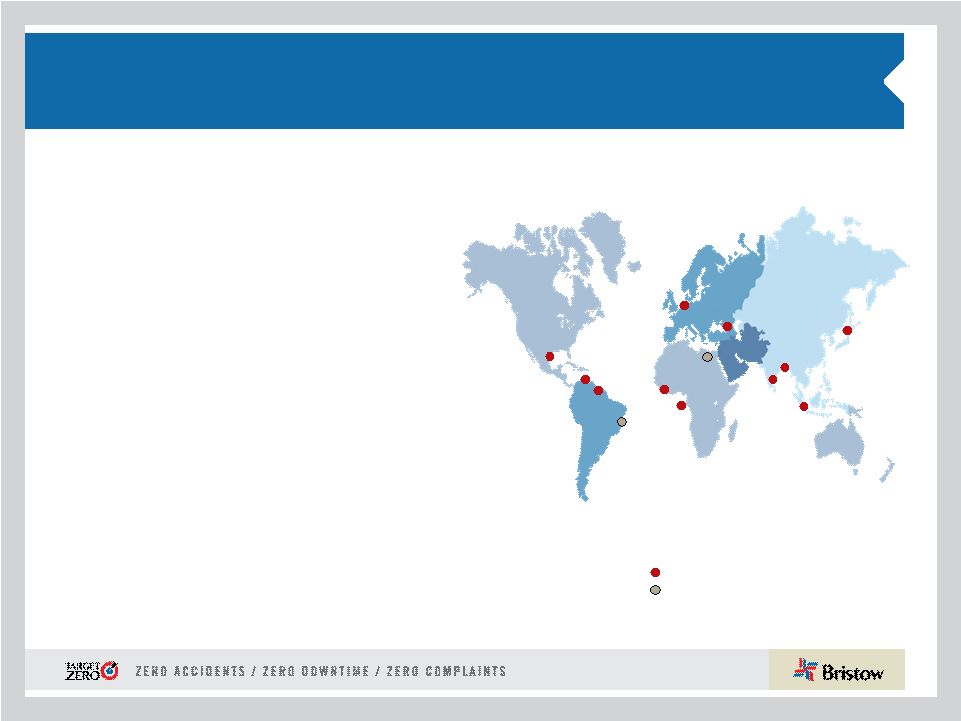
Other International (OIBU)
Consolidated in OIBU
Unconsolidated Affiliate
•
OIBU represented 12% of total Bristow operating revenue
and 5% of operating income for Q2 FY12
•
Operating revenue of $35.2M slightly lower than Q2 FY11
of $36M; Operating income, excluding Lider, is $9M same
as Q2 prior year
•
Operating margin, excluding Lider, remained relatively flat
at ~ 25% over the prior year quarter
•
Although operationally on plan, Lider equity earnings had
a negative impact of $6.6M for Q2 due to foreign
exchange impact associated with US GAAP accounting
•
No work in Libya
Outlook:
•
Incremental contracted work for nine helicopters in
Equatorial Guinea, Bangladesh, Trinidad and Brazil is not
reflected in this quarter’s numbers although some costs
have been incurred
•
Lider will have 13 additional helicopters on contract in Q3
•
Q3 will see two large aircraft move from Malaysia back to
Australia
FY12 operating margin expected to be ~ low
twenties |
 12
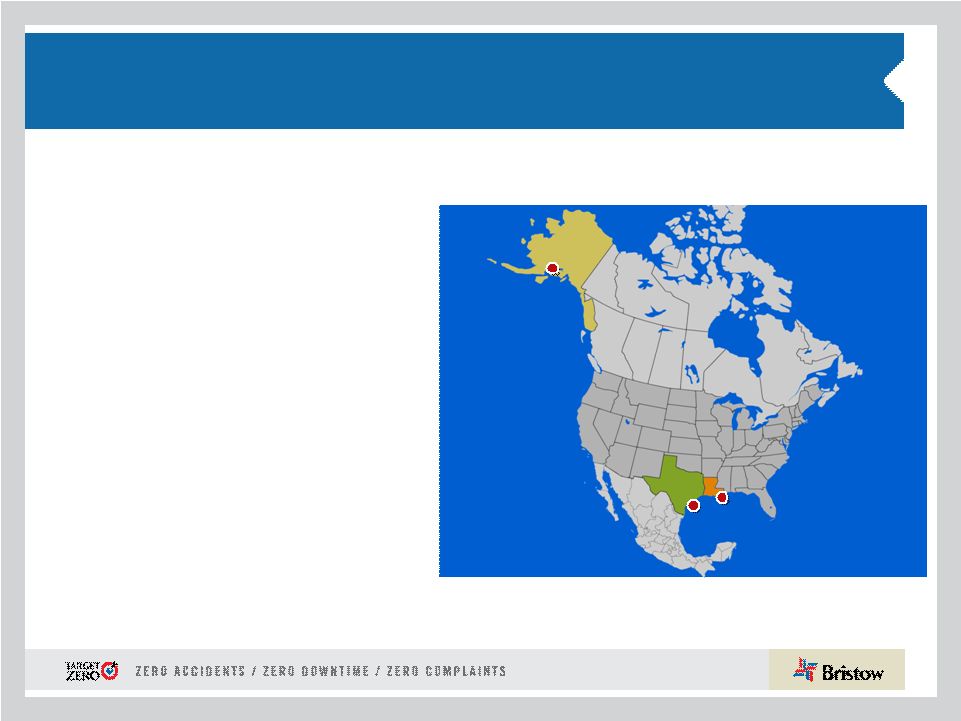
North America (NABU)
•
•
Operating revenue of $47.9M represents 16% of
total Bristow operating revenue
•
Operating income decreased to $2.6M vs.
$8.9M in the prior year quarter
•
Operating margin of 5.4% compared to 16.4%
prior year quarter, which was higher due to
increased flying associated with oil spill work
•
Adjusted operating margin, excluding special
items, of 11% compared to 3.6% prior year
quarter, due to better flight hours and focused
cost management
•
Creole base in Louisiana closed
Outlook:
•
GoM drilling permits continue to be issued but at
a slow rate
•
Two new technology large aircraft S-92s to
arrive GoM Q3 for contracted work
FY12 operating margin expected to
be ~ single digit |
 13
Financial discussion
Jonathan
Baliff,
SVP
and
CFO |
 14
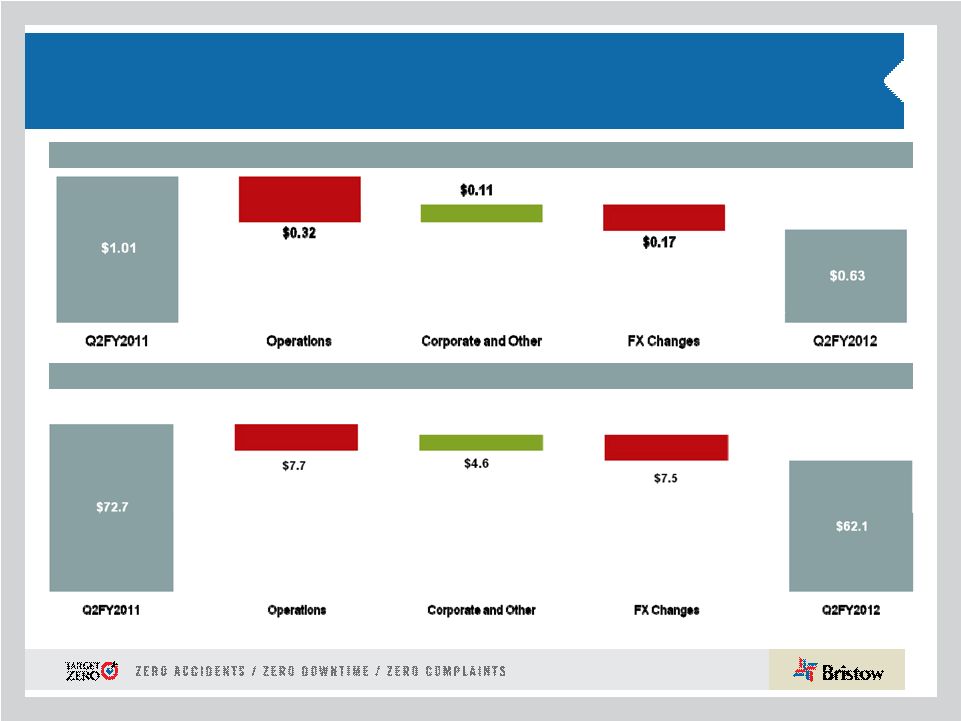
Financial highlights:
Adjusted EPS & EBITDA Summary
Q2 FY11 to Q2 FY12 adjusted EPS bridge
Q2 FY11 to Q2 FY12 adjusted EBITDA bridge (in millions)
* Adjusted EPS, adjusted operating income and adjusted EBITDA amounts exclude
gains and losses on dispositions of assets and any special items during the period. See
reconciliation of these items to GAAP in our earnings release for the quarter ended
September 30th, 2011. |
 15
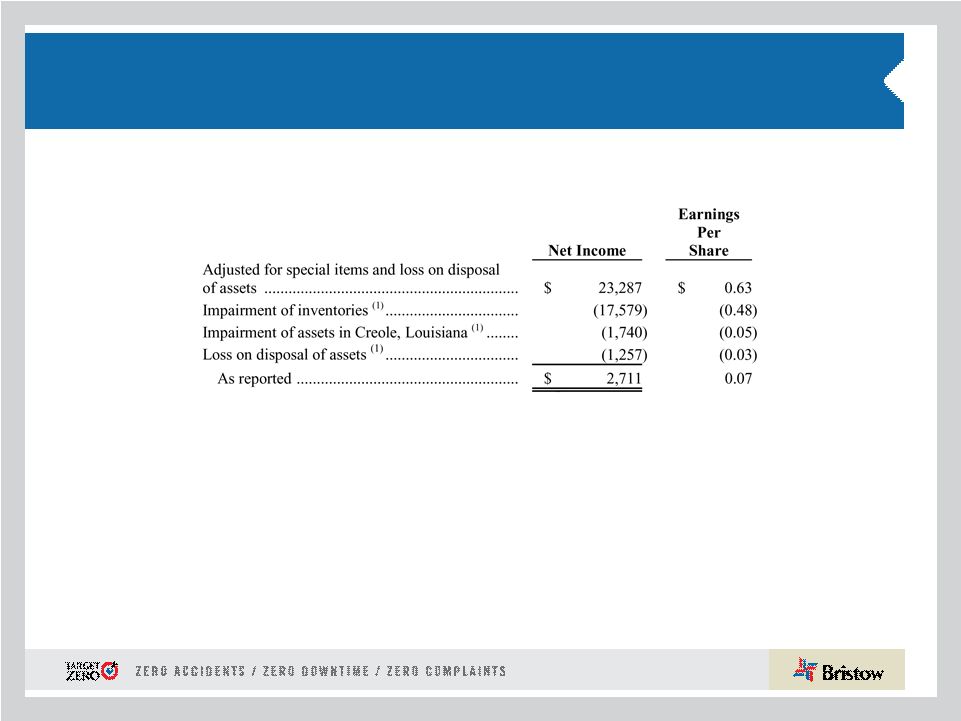
Financial highlights:
Inventory write-down and special items
•
There has been a marked acceleration in our client’s desire for newer
equipment in FY12 •
Bristow will continue to be proactive with new technology as the
premier service provider
following through on the Client Promise
•
So in 2QFY12, our fleet management led to a shortening of certain aircraft lives
and subsequent inventory write-down
•
Other operational non-cash items lead to adjusted 2Q EPS of $0.63
Reconciliation of Non-GAAP Net Income and
Earnings Per Share September 2011 Quarter
1) These amounts are presented after applying the appropriate tax effect to each
item and dividing earnings per share by the weighted average shares outstanding
during the related period. |
 16
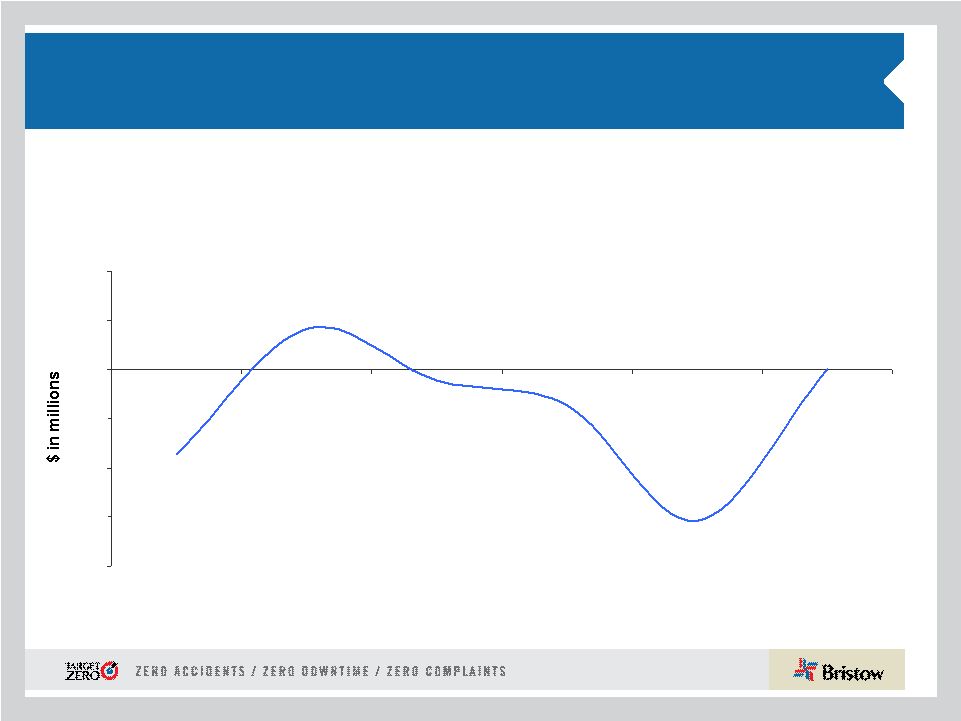
Absolute BVA –
Six Quarters
Sequential quarterly improvement needs to continue
Absolute BVA Q1FY11 - Q2FY12
-15.4
0.0
-3.6
-1.1
+4.2
-8.6
-20
-15
-10
-5
0
5
10
Q1 FY11
Q2 FY11
Q3 FY11
Q4 FY11
Q1 FY12
Q2 FY12 |
 17
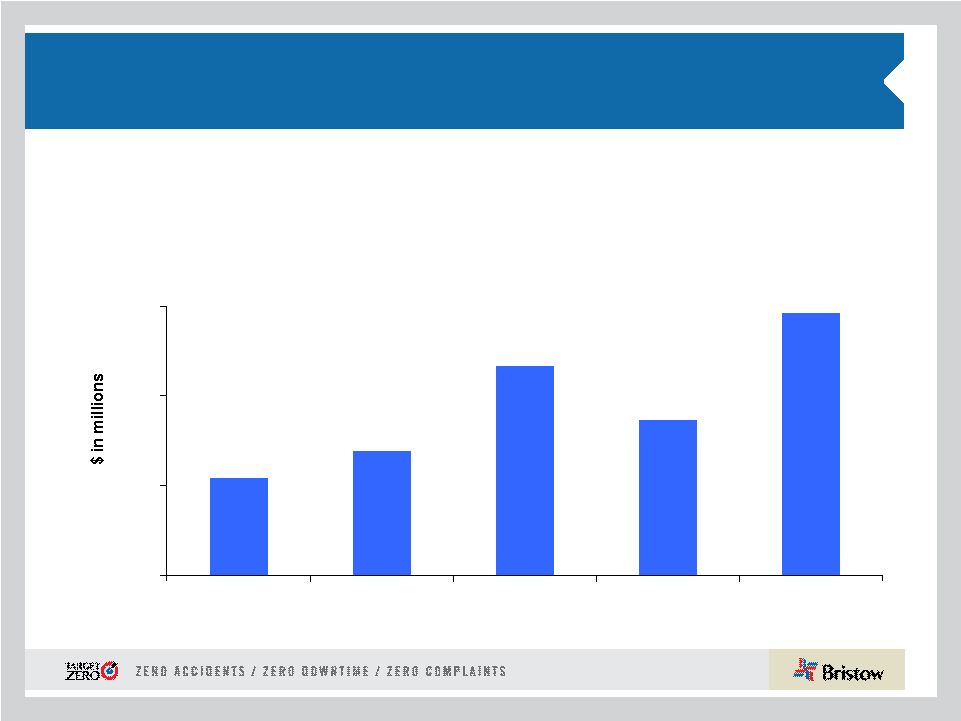
43
55
94
69
117
-
40
80
120
1HFY08
1HFY09
1HFY10
1HFY11
1HFY12
Financial highlights:
Strong operating cash flow generation
We generated 69% more operating cash flow in the first half of
FY12 compared to the same period last year |
 18
Commitment to balanced shareholder returns:
Up to $100 million share repurchase authorization
•
We are confident in the underlying ability of Bristow to generate
cash flow while growing the business across the globe and
maintaining a prudent financial profile
•
The $100 million share buyback authorization represents
approximately 5% of today’s outstanding shares based on current
stock price
•
Bristow intends to complete the share repurchase as soon as
practical, depending on conditions discussed in 10Q
•
There are a number of commonly used execution tactics and
Bristow will employ one or a combination to provide the best
value/certainty for our shareholders |
 19
Financial highlights:
Revising and narrowing of FY12 guidance
Phase I Revision
•
EPS
guidance
range
(as
of
November
8,
2011)
$3.05
-
$3.30,
excluding aircraft sales and special items
•
Depreciation
and
amortization
expense
~$87
–
$93
million
•
SG & A expense ~ $135 -
$140 million
•
Interest expense ~ $37 -
$42 million
•
Tax ~ 20% -
24% (assuming revenue earned in same regions
and same mix)
Phase II Revision
•
LACE* (Large Aircraft Equivalent) = 158
•
Revenue/LACE Rate* ~ $7.20 -
7.50 million per LACE aircraft
per year
* Excludes Bristow Academy, A/C held for sale, CIP, and reimbursable revenue.
|
 20
Conclusions
•
Client Promise is advancing and will have far reaching impacts on
growth, fleet management and our valuable service offerings
•
Operating expenses this quarter were incurred in anticipation of
future revenue growth, and resulted in disappointing 2QFY12
performance
•
We
are
revising
our
annual
FY12
EPS
guidance
to
$3.05
-
$3.30
•
Cash flow generation in FY12 is strong due to continued focus on
BVA enhancing actions
•
Bristow is determined to appropriately balance growth and cash
returns for our shareholders
Analyst Day on November 10, 2011 in New York |
 21
Appendix |
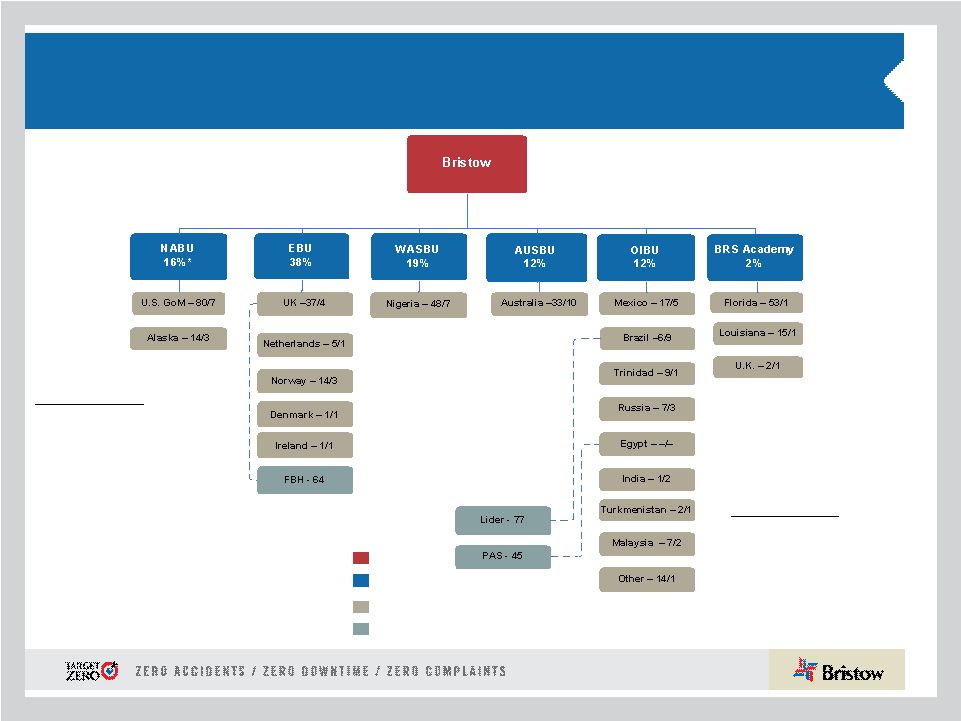 22
Organizational Chart -
as of September 30, 2011
Business
Unit
(*
%
of
Q2
FY12
Operating
Revenue)
Corporate
Region
(
#
of
Aircraft
/
#
of
Locations)
Joint
Venture
(No.
of
aircraft)
Key
Operated Aircraft
Bristow owns and/or operates 366
aircraft as of September 30, 2011
Affiliated Aircraft
Bristow affiliates and joint
ventures operate 186 aircraft
as of September 30, 2011 |
 23
Aircraft Fleet –
Medium and Large
As of September 30, 2011
Next Generation Aircraft
Medium capacity 12-16 passengers
Large capacity 18-25 passengers
Mature Aircraft Models
Aircraft
Type
No. of PAX
Engine
Consl
Unconsl
Total
Ordered
Large Helicopters
AS332L Super Puma
18
Twin Turbine
30
-
30
-
Bell 214ST
18
Twin Turbine
-
-
-
-
EC225
25
Twin Turbine
18
-
18
2
Mil MI 8
20
Twin Turbine
7
-
7
-
Sikorsky S-61
18
Twin Turbine
2
-
2
-
Sikorsky S-92
19
Twin Turbine
25
2
27
8
82
2
84
10
LACE
76
Medium Helicopters
AW139
12
Twin Turbine
7
5
12
-
Bell 212
12
Twin Turbine
3
22
25
-
Bell 412
13
Twin Turbine
36
35
71
-
EC155
13
Twin Turbine
4
-
4
-
Sikorsky S-76 A/A++
12
Twin Turbine
20
6
26
-
Sikorsky S-76 C/C++
12
Twin Turbine
54
28
82
-
124
96
220
-
LACE
57 |
 24
Training Helicopters
AS355
4
Twin Turbine
2
-
2
-
Bell 206B
6
Single Engine
8
-
8
-
Robinson R22
2
Piston
11
-
11
-
Robinson R44
2
Piston
2
-
2
-
Sikorsky 300CB/Cbi
2
Piston
46
-
46
-
AS350BB
4
Turbine
-
36
36
-
Fixed Wing
1
-
1
-
70
36
106
-
-
Fixed Wing
3
38
41
-
Total
366
186
552
10
TOTAL LACE (Large Aircraft Equivalent)*
154
10
Aircraft Fleet –
Small, Training and Fixed
As of September 30, 2011 (continued)
Next Generation Aircraft
Mature Aircraft Models
Small capacity 4-7 passengers
Training capacity 2-6 passengers
•LACE does not include held for sale, training and fixed wing
helicopters Aircraft
Type
No. of PAX
Engine
Consl
Unconsl
Total
Ordered
Small Helicopters
Bell 206B
4
Turbine
2
2
4
-
Bell 206 L-3
6
Turbine
4
6
10
-
Bell 206 L-4
6
Turbine
30
1
31
-
Bell 407
6
Turbine
41
-
41
-
BK 117
7
Twin Turbine
2
-
2
-
BO-105
4
Twin Turbine
2
-
2
-
EC135
7
Twin Turbine
6
3
9
-
Agusta 109
8
Twin Turbine
-
2
2
-
87
14
101
-
LACE
21 |
 25
Consolidated Fleet Changes and Aircraft Sales for
Q2 FY12
Q 1 FY12
Q 2 FY12
YTD
Fleet Count Beginning Period
373
372
373
Delivered
EC225
2
2
4
S-92
1
1
Total Delivered
2
3
5
Removed
Sales
(3)
(5)
(8)
Other*
(4)
(4)
Total Removed
(3)
(9)
(12)
372
366
366
* Includes net lease returns and commencements
# of A/C
Sold
Cash
Received*
Gain/ Loss*
Q1 FY 12
3
2,478
1,525
Q2 FY 12
5
13,152
3,004
Totals
8
15,630
4,529
* Amounts stated in thousands
Aircraft held for sale by BU
EBU
WASBU
AUSBU
OIBU
NABU
Total
Large
3
-
3
-
-
6
Medium
2
1
4
2
2
11
Small
-
2
-
-
-
2
Total
5
3
7
2
2
19
|
 26
#
Helicopter
Class
Delivery Date
Location
Contracted
#
Helicopter
Class
Delivery Date
Location
2
Large
December 2011
NABU
2 of 2
2
Medium
December 2012
EBU
1
Large
December 2011
EBU
1 of 1
3
Large
December 2012
EBU
1
Large
March 2012
EBU
1 of 1
2
Medium
June 2013
EBU
2
Large
June 2012
EBU
2 of 2
1
Large
September 2013
AUSBU
4
Large
September 2012
EBU
1
Medium
December 2013
OIBU
6 of 10
4
Large
December 2013
EBU
1
Large
December 2013
OIBU
1
Medium
March 2014
OIBU
1
Large
March 2014
OIBU
2
Medium
June 2014
OIBU
1
Large
June 2014
EBU
1
Medium
September 2014
OIBU
1
Medium
September 2014
AUSBU
1
Large
September 2014
AUSBU
2
Medium
December 2014
AUSBU
1
Large
December 2014
AUSBU
1
Large
March 2015
AUSBU
1
Large
June 2015
AUSBU
1
Large
September 2015
EBU
1
Large
December 2015
EBU
1
Large
March 2016
OIBU
1
Large
June 2016
EBU
1
Large
September 2016
OIBU
1
Large
December 2016
EBU
1
Large
March 2017
OIBU
1
Large
June 2017
EBU
1
Large
September 2017
OIBU
1
Large
December 2017
OIBU
37
ORDER BOOK
OPTIONS BOOK
Order and options book as of September 30, 2011
Our order and options book reflects
future contracted and line-of-sight
work for the next five years with 10
large aircraft ordered and 25 large
and 12 medium aircraft on option.
* Subsequent to September 30, 2011, we entered into agreements to purchase or lease
8 new technology large aircraft for approximately $144 million that are not
reflected in the table above. Fair market value of our fleet is ~$1.9
billion as of September 30, 2011. |
 27
Operating margin trend
2008
2009
As Reported
Full Year
Full Year
Q1
Q2
Q3
Q4
FY
Q1
Q2
Q3
Q4
FY
Q1
Q2
EBU
23.6%
19.3%
17.2%
16.7%
16.1%
18.1%
17.0%
18.0%
18.4%
19.6%
18.8%
18.8%
17.3%
16.8%
WASBU
17.9%
21.5%
24.9%
29.3%
25.4%
34.7%
28.5%
26.5%
29.5%
29.8%
24.0%
27.4%
20.6%
25.2%
NABU
14.5%
12.1%
8.9%
9.7%
3.3%
2.2%
6.1%
10.1%
16.1%
4.2%
-4.0%
7.5%
3.6%
5.3%
AUSBU
17.2%
5.9%
20.1%
23.1%
24.5%
24.5%
23.2%
22.5%
16.3%
17.2%
17.4%
18.2%
10.0%
1.7%
OIBU
17.3%
27.0%
21.8%
35.1%
15.5%
1.8%
19.2%
6.9%
30.6%
27.7%
45.8%
28.4%
33.6%
5.8%
Consolidated
16.0%
17.8%
15.4%
18.4%
13.1%
15.2%
15.5%
13.6%
17.1%
14.7%
16.1%
15.4%
11.3%
2.9%
New methodology (operating income/operating revenue)
2008
2009
Revised *
Full Year
Full Year
Q1
Q2
Q3
Q4
FY
Q1
Q2
Q3
Q4
FY
Q1
Q2
EBU
29.2%
24.3%
20.9%
20.5%
19.8%
22.4%
20.8%
21.4%
22.1%
25.4%
23.6%
23.6%
21.5%
20.7%
WASBU
19.4%
22.8%
26.8%
30.0%
27.3%
35.7%
29.9%
27.1%
30.5%
30.4%
26.1%
28.6%
21.5%
26.4%
NABU
14.5%
12.2%
8.9%
9.7%
3.3%
2.2%
6.2%
10.2%
16.4%
4.2%
-4.0%
7.6%
3.6%
11.0%
AUSBU
17.9%
6.3%
21.0%
24.5%
25.5%
25.6%
24.3%
23.6%
17.8%
18.8%
19.1%
19.8%
11.1%
1.9%
OIBU
17.4%
27.3%
21.9%
35.9%
15.3%
1.9%
19.4%
6.9%
30.9%
28.2%
47.1%
28.8%
34.5%
5.9%
Consolidated **
16.4%
14.7%
15.9%
17.4%
14.2%
13.9%
15.3%
14.0%
18.0%
15.3%
18.3%
16.4%
12.2%
13.0%
* - All amounts revised to exclude reimbursable revenue from denominator.
** - Revised to exclude aircraft sales from numerator.
2012
2010
2011
2012
2010
2011 |
 28
EBIDTAR reconciliation
($ in millions)
2000
2001
2002
2003
2004
Income from continuing operations
$8.8
$27.9
$42.5
$40.3
$49.6
Income tax expense
3.8
13.3
19.1
17.5
18.5
Interest expense
18.5
18.4
15.8
14.9
16.8
Depreciation and amortization
32.0
33.1
33.9
37.5
39.4
EBITDA Subtotal
63.1
92.7
111.4
110.2
124.3
Aircraft rental expense
–
–
–
–
–
EBITDAR
$63.1
$92.7
$111.4
$110.2
$124.3
($ in millions)
2005
2006
2007
2008
2009
Income from continuing operations
$49.2
$54.5
$72.5
$107.7
$125.5
Income tax expense
$20.4
$14.7
$38.8
$44.5
$50.5
Interest expense
$15.7
$14.7
$10.9
$23.8
$35.1
Gain on disposal of assets
($0.1)
($10.6)
($9.4)
($9.1)
Depreciation and amortization
40.5
42.1
42.5
54.1
65.5
EBITDA Subtotal
125.8
125.8
154.1
220.7
267.6
Aircraft rental expense
–
2.1
6.3
6.3
8.2
EBITDAR
$125.8
$127.9
$160.4
$227.0
$275.8
March 31,
March 31, |
 29
EBIDTAR reconciliation (continued)
($ in millions)
2010
2011
Income from continuing operations
$113.5
$133.3
Income tax expense
$29.0
$7.1
Interest expense
$42.4
$46.2
Gain on disposal of assets
(18.7)
(10.2)
Depreciation and amortization
74.7
90.9
EBITDA Subtotal
240.9
267.3
Aircraft rental expense
9.1
5.9
EBITDAR
$250.1
$273.2
($ in millions)
YTD FY11
YTD FY12
TTM as of
9/30/2010
9/30/2011
9/30/2011
Income from continuing operations
$59.8
$24.2
$97.7
Income tax expense
11.9
4.7
(0.1)
Interest expense
22.5
18.4
42.1
Gain on disposal of assets
(3.6)
0.2
(6.4)
Depreciation and amortization
40.3
48.1
98.7
EBITDA Subtotal
130.8
95.6
232.1
Aircraft rental expense
3.0
2.8
5.8
EBITDAR
$133.7
$98.4
$237.9
March 31, |
 30
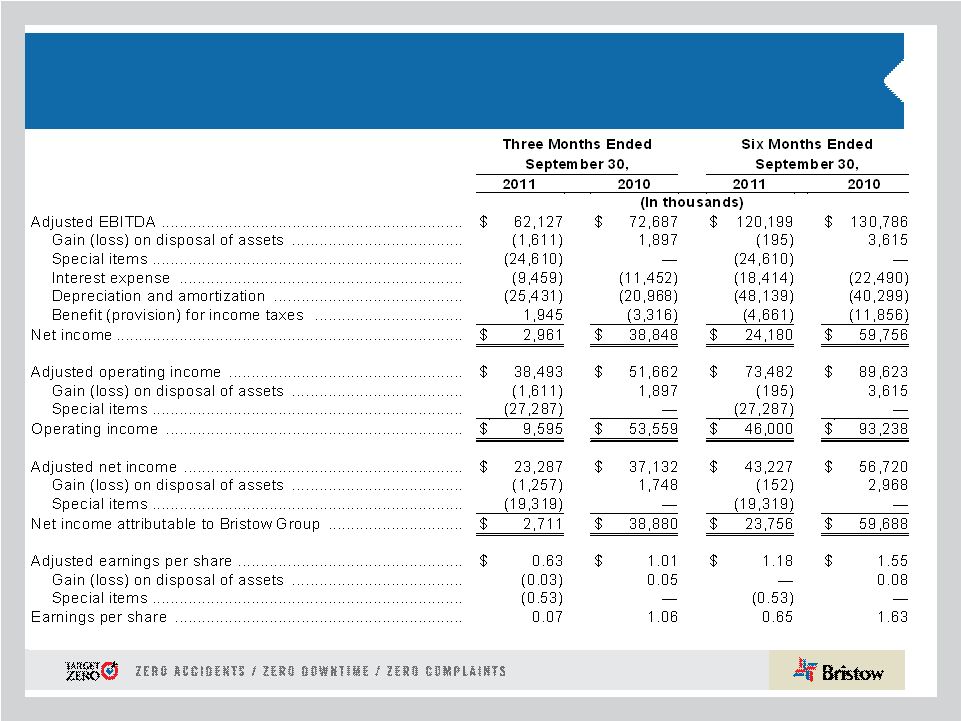
GAAP reconciliation |
 31
Bristow Group Inc. (NYSE: BRS)
2000 West Sam Houston Parkway South
Suite 1700, Houston, Texas 77042
t
713.267.7600
f
713.267.7620
bristowgroup.com
Contact Us |