Attached files
| file | filename |
|---|---|
| 8-K - AMERICAN PUBLIC EDUCATION, INC. 8-K - AMERICAN PUBLIC EDUCATION INC | a50059214.htm |
| EX-99.1 - EXHIBIT 99.1 - AMERICAN PUBLIC EDUCATION INC | a50059214ex99-1.htm |
Exhibit 99.2
Third Quarter 2011 Conference Call November 7, 2011 Leading the Way

Statements made in this presentation regarding American Public Education, Inc. or its subsidiaries, that are not historical facts are forward-looking statements based on current expectations, assumptions, estimates and projections about American Public Education and the industry. These forward-looking statements are subject to risks and uncertainties that could cause actual future events or results to differ materially from such statements. Forward-looking statements are some times identified by words such as “anticipate”, “believe”, “could", “estimate”, “expect”, “intend”, “may”, “should“, “will” and “would”. These forward-looking statements include, without limitation, statements on slide “Third Quarter 2011 Outlook”, as well as statements regarding expected growth. Actual results could differ materially from those expressed or implied by these forward-looking statements as a result of various factors, including the various risks described in the “Risk Factors” section and elsewhere in the Company’s Annual Report on Form 10-K for the year ended December 31, 2010 and the Company’s Quarterly Report on Form 10-Q for the quarter June 30, 2011 as filed with the SEC, and in the Company’s other filings with the SEC. The Company undertakes no obligation to update publicly any forward-looking statements for any reason, even if new information becomes available or other events occur in the future.
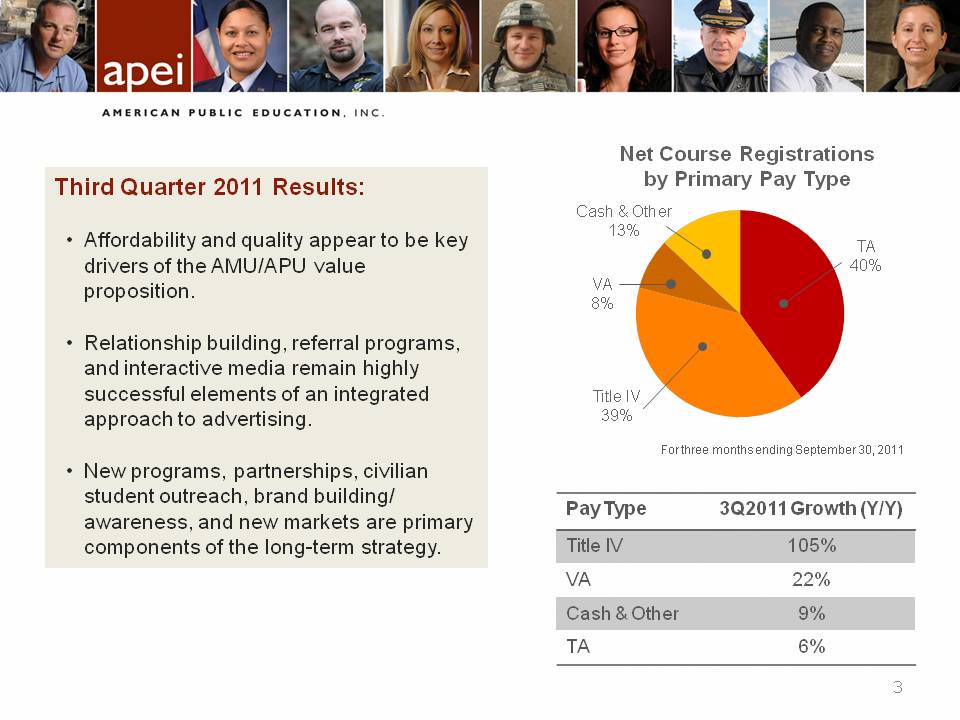
For three months ending September 30, 2011 Net Course Registrations by Primary Pay Type Cash & Other 13% TA 40% Title IV 39% VA 8% Third Quarter 2011 Results:Affordability and quality appear to be key drivers of the AMU/APU value proposition. Relationship building, referral programs, and interactive media remain highly successful elements of an integrated approach to advertising. New programs, partnerships, civilian student outreach, brand building/ awareness, and new markets are primary components of the long-term strategy.

Academic and Operational Highlights Academic Research – Dr. Phil Ice delivered keynote address on the Future of Learning Analytics at the National Association of Distance Education Organizations of South Africa (NADEOSA) annual conference.Notable New Hire – Dr. Ron Kovach, Vice President of Student Services at APUSFormerly the Assistant Vice Chancellor for Academic Affairs at Purdue University CalumetAll Courses Now Available in Sakai New APU Branding Campaign - http://www.youtube.com/watch?v=h92_pzPibdQAPEI #2 on Forbes Best Small Public Companies in America
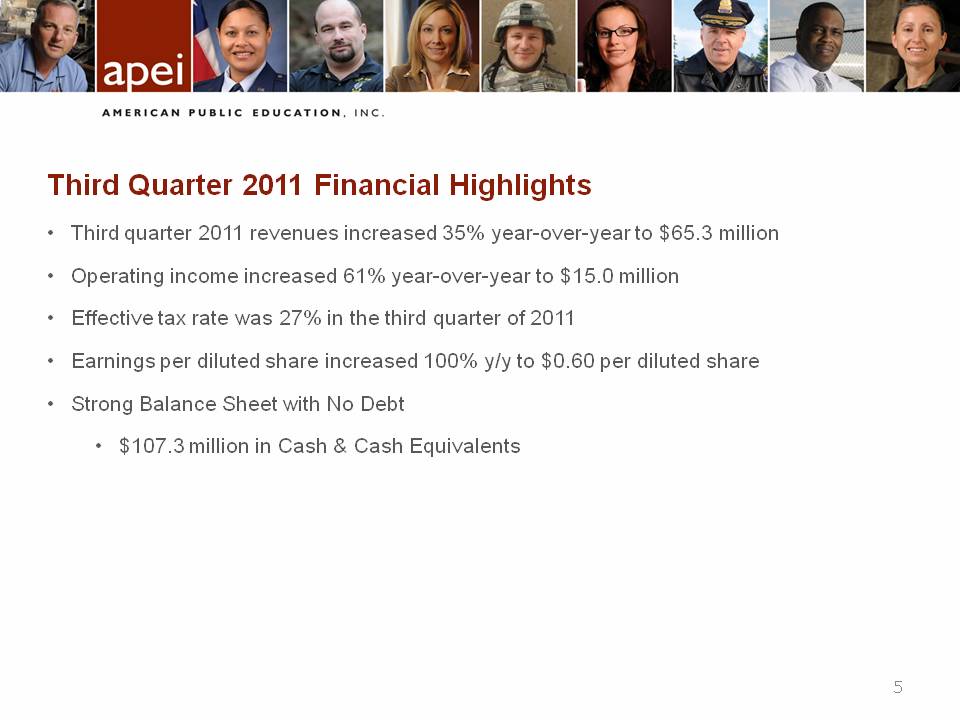
Third quarter 2011 revenues increased 35% year-over-year to $65.3 million Operating income increased 61% year-over-year to $15.0 million Effective tax rate was 27% in the third quarter of 2011Earnings per diluted share increased 100% y/y to $0.60 per diluted share Strong Balance Sheet with No Debt $107.3 million in Cash & Cash Equivalents Third Quarter 2011 Financial Highlights
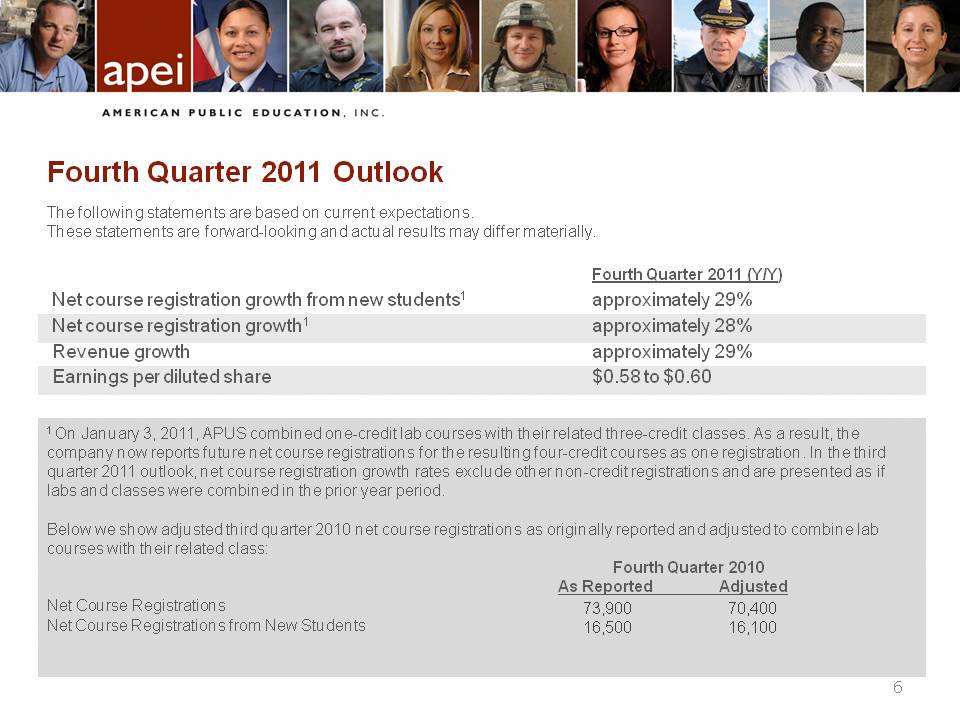
The following statements are based on current expectations. These statements are forward-looking and actual results may differ materially. 1 On January 3, 2011, APUS combined one-credit lab courses with their related three-credit classes. As a result, the company now reports future net course registrations for the resulting four-credit courses as one registration. In the third quarter 2011 outlook, net course registration growth rates exclude other non-credit registrations and are presented as if labs and classes were combined in the prior year period.Below we show adjusted third quarter 2010 net course registrations as originally reported and adjusted to combine lab courses with their related class: Fourth Quarter 2010 As Reported Adjusted Net Course Registrations Net Course Registrations from New Students 73,90016,500 70,40016,100 Fourth Quarter 2011 Outlook Fourth Quarter 2011 (Y/Y)Net course registration growth from new students 1 approximately 29% Net course registration growth 1 approximately 28% Revenue growth approximately 29% Earnings per diluted share $0.58 to $0.60

Third Quarter 2011 Conference Call November 7, 2011 Leading the Way