Attached files
| file | filename |
|---|---|
| 8-K - FORM 8-K - Bridge Capital Holdings | v239142_8k.htm |
Investor Update – Third Quarter 2011 November 3, 2011 Thomas A. Sa Executive Vice President Chief Financial Officer Chief Strategy Officer Daniel P. Myers President Chief Executive Officer Director
2 2 Forward Looking Statements Certain matters discussed herein constitute forward - looking statements within the meaning of the Private Securities Litigation Reform Act of 1995, and are subject to the safe harbors created by that Act. Forward - looking statements describe future plans, strategies, and expectations, and are based on currently available information, expectations, assumptions, projections, and management's judgment about the Bank, the banking industry and general economic conditions. These forward looking statements are subject to certain risks and uncertainties that could cause the actual results, performance or achievements to differ materially from those expressed, suggested or implied by the forward looking statements. These risks and uncertainties include, but are not limited to: (1) competitive pressures in the banking industry; (2) changes in interest rate environment; (3) general economic conditions, nationally, regionally, and in operating markets; (4) changes in the regulatory environment; (5) changes in business conditions and inflation; (6) changes in securities markets; (7) future credit loss experience; (8) the ability to satisfy requirements related to the Sarbanes - Oxley Act and other regulation on internal control; (9) civil disturbances or terrorist threats or acts, or apprehension about the possible future occurrences of acts of this type; and (10) the involvement of the United States in war or other hostilities. The reader should refer to the more complete discussion of such risks in Bridge Capital Holdings reports on Forms 10 - K and 10 - Q on file with the SEC.
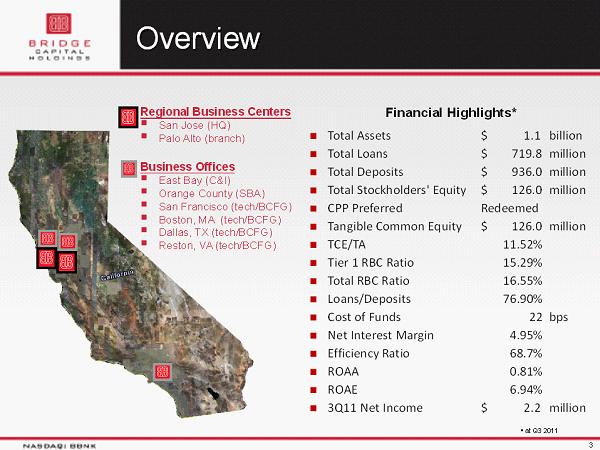
3 Overview Regional Business Centers ▪ San Jose (HQ) ▪ Palo Alto (branch) Business Offices ▪ East Bay (C&I) ▪ Orange County (SBA) ▪ San Francisco (tech/BCFG) ▪ Boston, MA (tech/BCFG) ▪ Dallas , TX (tech/BCFG) ▪ Reston, VA (tech/BCFG) Financial Highlights* 3 ■ Total Assets $ 1.1 billion ■ Total Loans $ 719.8 million ■ Total Deposits $ 936.0 million ■ Total Stockholders' Equity $ 126.0 million ■ CPP Preferred Redeemed ■ Tangible Common Equity $ 126.0 million ■ TCE/TA 11.52% ■ Tier 1 RBC Ratio 15.29% ■ Total RBC Ratio 16.55% ■ Loans/Deposits 76.90% ■ Cost of Funds 22 bps ■ Net Interest Margin 4.95% ■ Efficiency Ratio 68.7% ■ ROAA 0.81% ■ ROAE 6.94% ■ 3 Q11 Net Income $ 2.2 million • at Q3 2011
Our Strategic Vision A business banking franchise that is the Professional Business Bank of Choice for small and middle market companies, and emerging and technology businesses, in the markets we serve 4
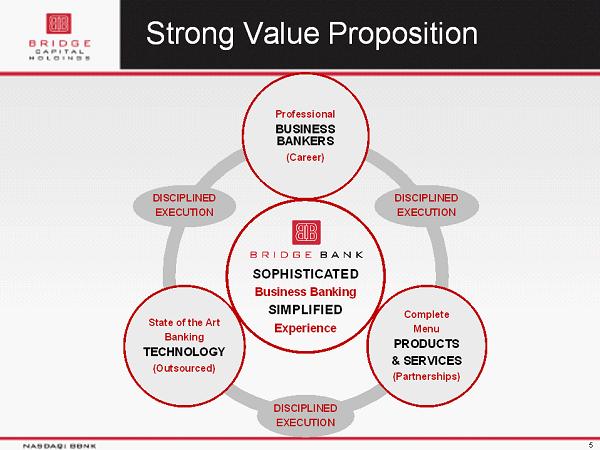
5 5 5 SOPHISTICATED Business Banking SIMPLIFIED Experience Professional BUSINESS BANKERS (Career) DISCIPLINED EXECUTION Complete Menu PRODUCTS & SERVICES (Partnerships) DISCIPLINED EXECUTION State of the Art Banking TECHNOLOGY (Outsourced) DISCIPLINED EXECUTION Strong Value Proposition
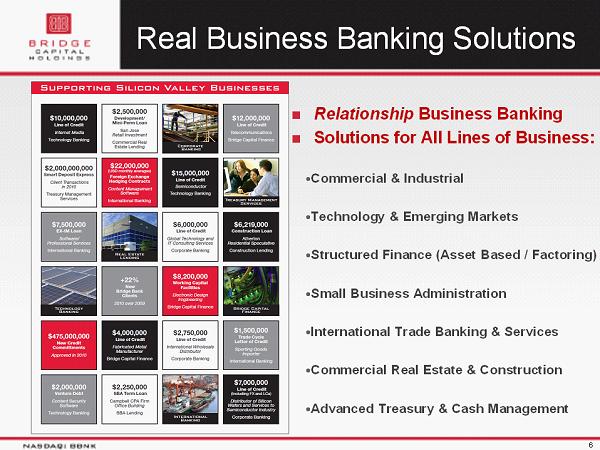
Relationship Business Banking Solutions for All Lines of Business : Commercial & Industrial Technology & Emerging Markets Structured Finance (Asset Based / Factoring) Small Business Administration I nternational Trade Banking & Services Commercial Real Estate & Construction Advanced Treasury & Cash Management Real Business Banking Solutions 6
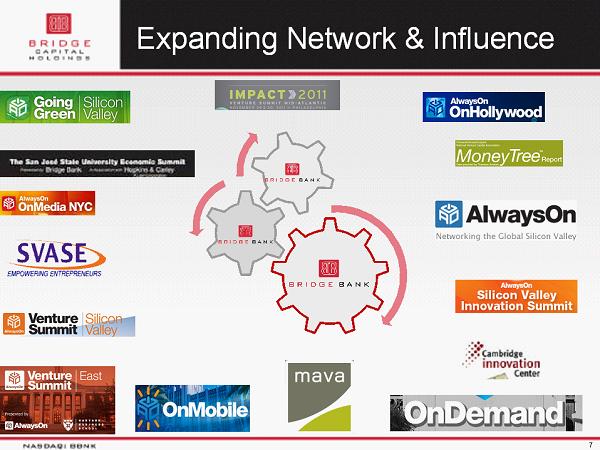
7 c c C Expanding Network & Influence
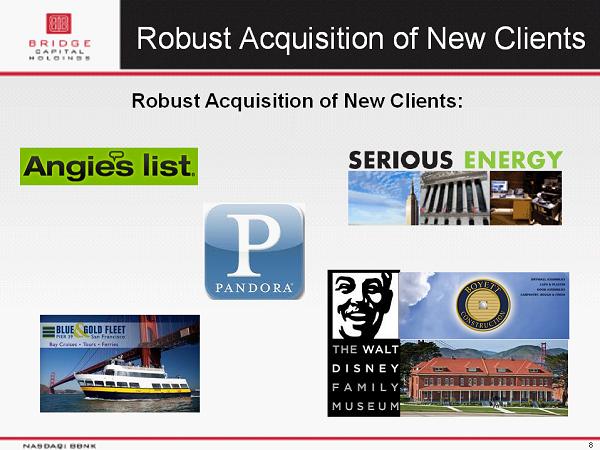
8 Robust Acquisition of New Clients: Robust Acquisition of New Clients
9 9 9 9 Bridge Bank Franchise Disciplined execution of our business plan Limited exposure to real estate Continued core growth through crisis Operating in attractive Silicon Valley and tech centric markets 2 regional business centers + 6 business offices Full range of corporate banking products delivered through experienced advisors Unique & effective application of banking technology Core funding - driven approach to building the business Surpassed $1 billion in assets at end of 2010 Experienced board and management
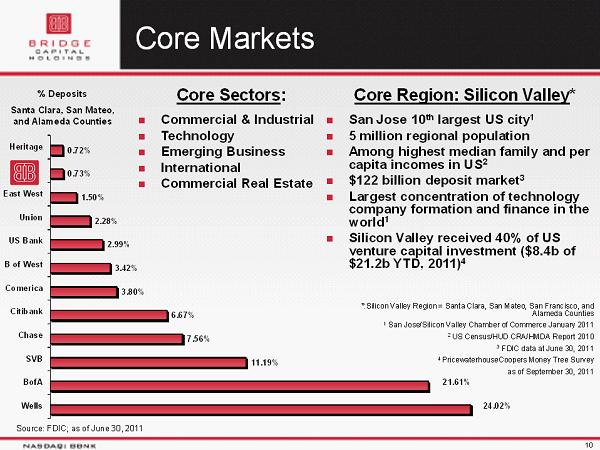
*:Silicon Valley Region = Santa Clara, San Mateo, San Francisco, and Alameda Counties 1 San Jose/Silicon Valley Chamber of Commerce January 2011 2 US Census/HUD CRA/HMDA Report 2010 3 FDIC data at June 30, 2011 4 PricewaterhouseCoopers Money Tree Survey as of September 30, 2011 10 10 10 24.02% 21.61% 11.19% 7.56% 6.67% 3.80% 3.42% 2.99% 2.28% 1.50% 0.73% 0.72% Wells BofA SVB Chase Citibank Comerica B of West US Bank Union East West Heritage % Deposits Santa Clara , San Mateo , and Alameda Counties Core Markets 10 Source: FDIC; as of June 30, 2011 Core Region: Silicon Valley * San Jose 10 th largest US city 1 5 million regional population Among highest median family and per capita incomes in US 2 $ 122 billion deposit market 3 Largest concentration of technology company formation and finance in the world 1 Silicon Valley received 40% of US venture capital investment ($8.4b of $21.2b YTD, 2011) 4 Core Sectors : Commercial & Industrial Technology Emerging Business International Commercial Real Estate
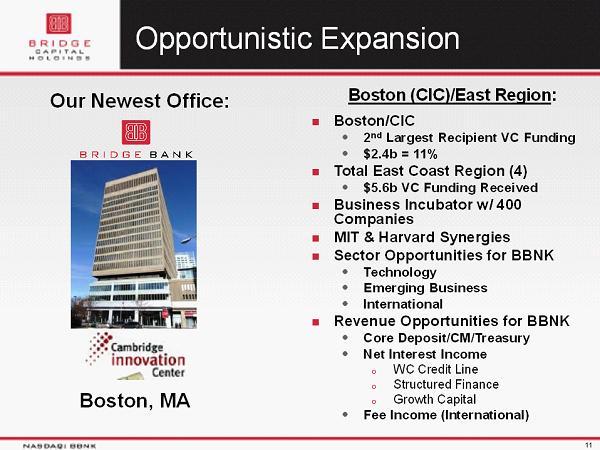
11 11 11 Our Newest Office: Boston, MA Opportunistic Expansion Boston (CIC)/East Region : Boston/CIC 2 nd Largest Recipient VC Funding $2.4b = 11% Total East Coast Region (4) $5.6b VC Funding Received Business Incubator w/ 400 Companies MIT & Harvard Synergies Sector Opportunities for BBNK Technology Emerging Business International Revenue Opportunities for BBNK Core Deposit/CM/Treasury Net Interest Income o WC Credit Line o Structured Finance o Growth Capital Fee Income (International)
12 12 12 12 BBNK Q3 YTD 2011 Summary Operating profit of $5.5 million +127% over prior year Balanced execution +18% deposit growth (YoY, EOP) +19% loan growth (YoY, EOP) Consistent high quality deposit growth 96% core 59% DDA 11bps Cost of Deposits Continued credit quality improvement YTD net recoveries support ALLLR Exceptionally well capitalized TCE of 11.52% Completed exit from TARP in Q2 2011 Continued robust new client acquisition
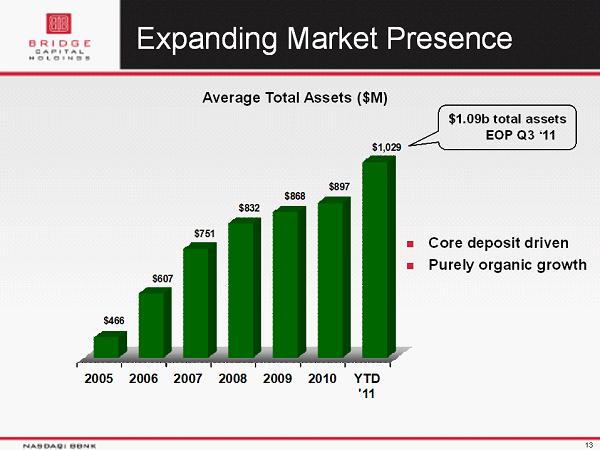
13 2005 2006 2007 2008 2009 2010 YTD '11 $466 $607 $751 $832 $868 $897 $1,029 13 13 Average Total Assets ($M) Expanding Market Presence Core deposit driven Purely organic growth $1.09b total assets EOP Q3 ‘11
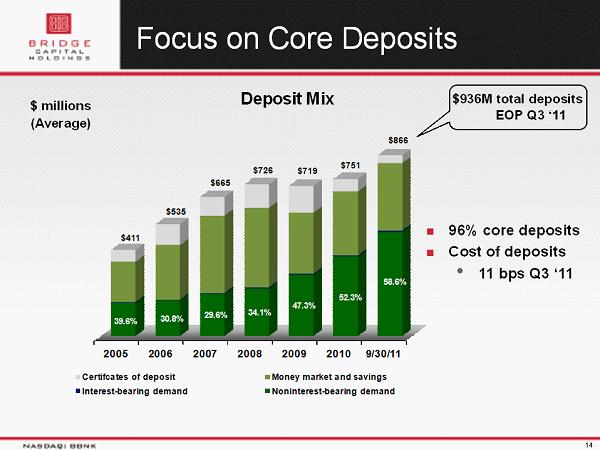
14 14 14 Focus on Core Deposits 2005 2006 2007 2008 2009 2010 9/30/11 39.6% 30.8% 29.6% 34.1% 47.3% 52.3% 58.6% $411 $535 $665 $726 $719 $751 $866 Certifcates of deposit Money market and savings Interest - bearing demand Noninterest - bearing demand 14 $ millions (Average) Deposit Mix 96% core deposits Cost of deposits • 11 bps Q3 ‘11 $936M total deposits EOP Q3 ‘11
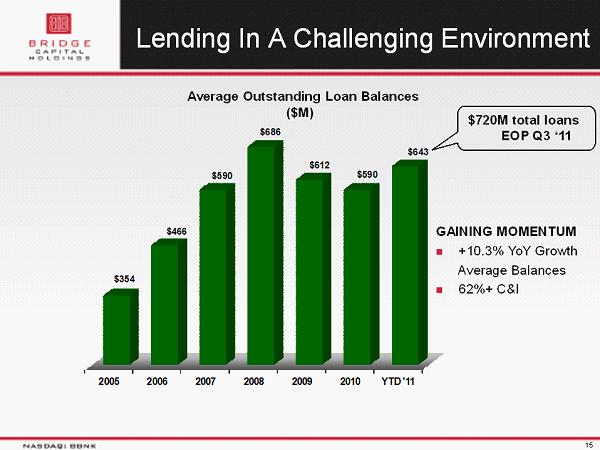
15 Lending In A Challenging Environment 2005 2006 2007 2008 2009 2010 YTD '11 $354 $466 $590 $686 $612 $590 $643 Average Outstanding Loan Balances ($M) GAINING MOMENTUM +10.3% YoY Growth Average Balances 62%+ C&I $720M total loans EOP Q3 ‘11
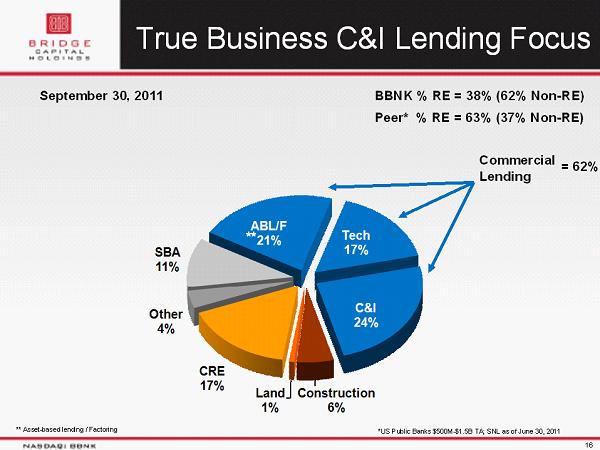
16 Construction 6% Land 1% CRE 17% Other 4% SBA 11% ABL/F 21% Tech 17% C&I 24% 16 BBNK % RE = 38% ( 62% Non - RE) Peer* % RE = 63% ( 37% Non - RE) *US Public Banks $500M - $1.5B TA; SNL as of June 30, 2011 September 30, 2011 Commercial Lending ** ** Asset - based lending / Factoring = 62% True Business C&I Lending Focus
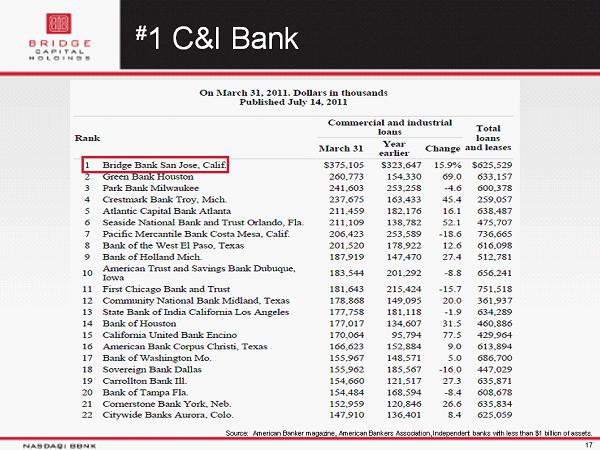
17 17 17 # 1 C&I Bank Source: American Banker magazine, American Bankers Association, Independent banks with less than $1 billion of assets.
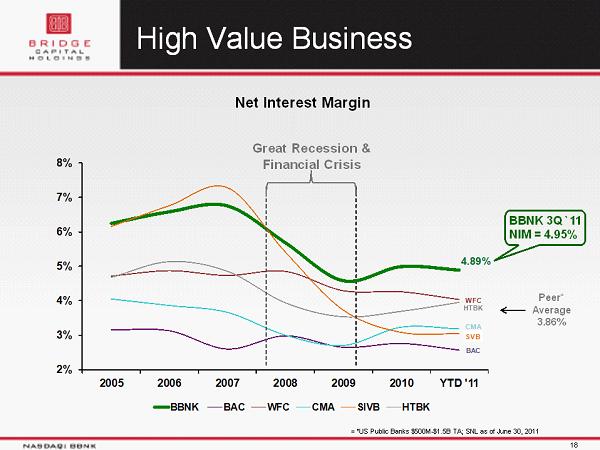
18 18 18 4.89% BAC WFC CMA SVB HTBK 2% 3% 4% 5% 6% 7% 8% 2005 2006 2007 2008 2009 2010 YTD '11 BBNK BAC WFC CMA SIVB HTBK High Value Business Peer* Average 3.86% = *US Public Banks $500M - $1.5B TA; SNL as of June 30, 2011 Net Interest Margin Great Recession & Financial Crisis BBNK 3Q `11 NIM = 4.95%
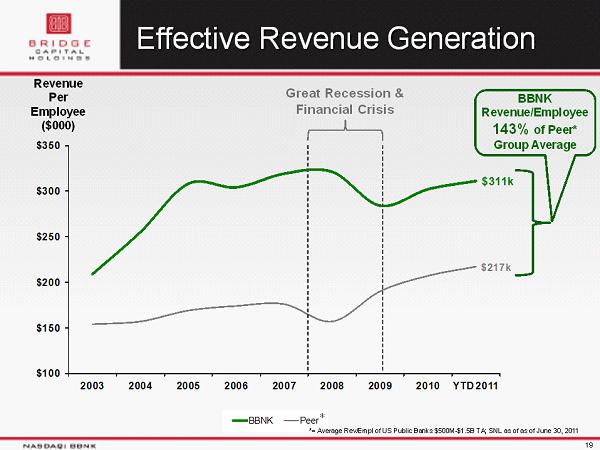
19 $311k $217k $100 $150 $200 $250 $300 $350 2003 2004 2005 2006 2007 2008 2009 2010 YTD 2011 BBNK Peer Effective Revenue Generation Revenue Per Employee ($000) *= Average Rev/Empl of US Public Banks $500M - $1.5B TA; SNL as of as of June 30, 2011 BBNK Revenue/Employee 143% of Peer * Group Average * Great Recession & Financial Crisis
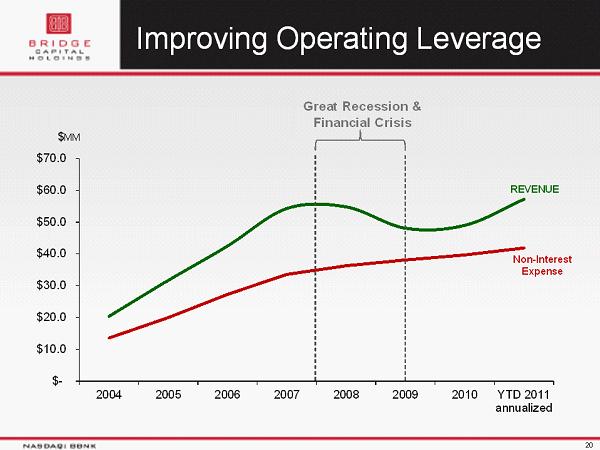
20 20 Improving Operating Leverage $- $10.0 $20.0 $30.0 $40.0 $50.0 $60.0 $70.0 2004 2005 2006 2007 2008 2009 2010 YTD 2011 annualized $ MM Great Recession & Financial Crisis REVENUE Non - Interest Expense
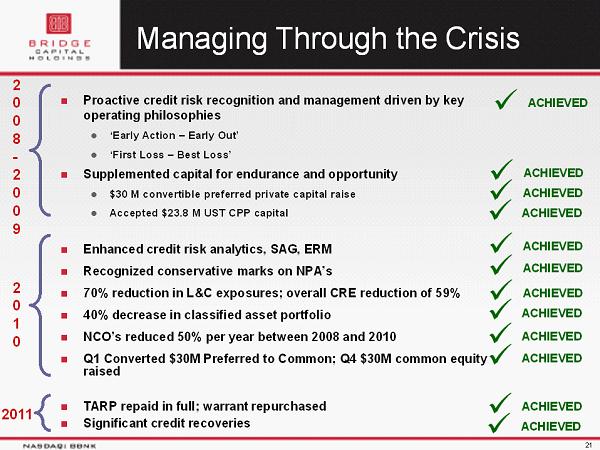
21 21 Proactive credit risk recognition and management driven by key operating philosophies ‘Early Action – Early Out’ ‘First Loss – Best Loss’ Supplemented capital for endurance and opportunity $30 M convertible preferred private capital raise Accepted $23.8 M UST CPP capital Enhanced credit risk analytics, SAG, ERM Recognized conservative marks on NPA’s 70% reduction in L&C exposures; overall CRE reduction of 59% 40% decrease in classified asset portfolio NCO’s reduced 50% per year between 2008 and 2010 Q1 Converted $30M Preferred to Common; Q4 $30M common equity raised TARP repaid in full; warrant repurchased Significant credit recoveries Managing Through the Crisis 2 0 0 8 - 2 0 0 9 2 0 1 0 2011 x ACHIEVED x ACHIEVED x ACHIEVED x ACHIEVED x ACHIEVED x ACHIEVED x ACHIEVED x ACHIEVED x ACHIEVED x ACHIEVED x ACHIEVED x ACHIEVED
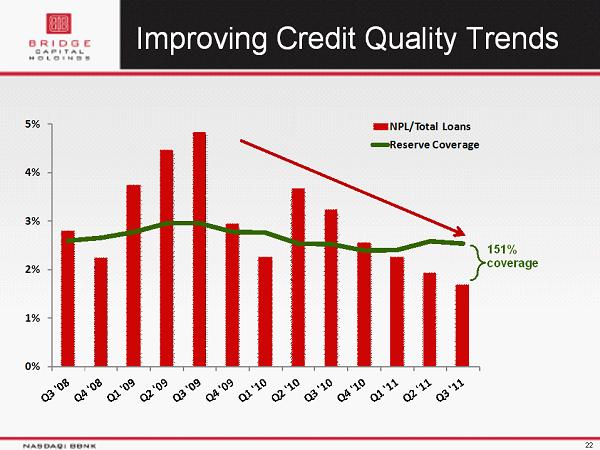
22 Improving Credit Quality Trends 0% 1% 2% 3% 4% 5% NPL/Total Loans Reserve Coverage 22 151% coverage
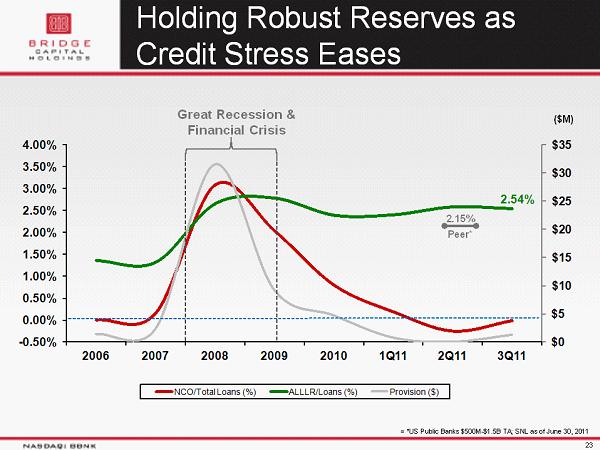
2.54% $0 $5 $10 $15 $20 $25 $30 $35 - 0.50% 0.00% 0.50% 1.00% 1.50% 2.00% 2.50% 3.00% 3.50% 4.00% 2006 2007 2008 2009 2010 1Q11 2Q11 3Q11 NCO/Total Loans (%) ALLLR/Loans (%) Provision ($) 23 Holding Robust Reserves as Credit Stress Eases Great Recession & Financial Crisis = *US Public Banks $500M - $1.5B TA; SNL as of June 30, 2011 Peer* 2.15% ($M)
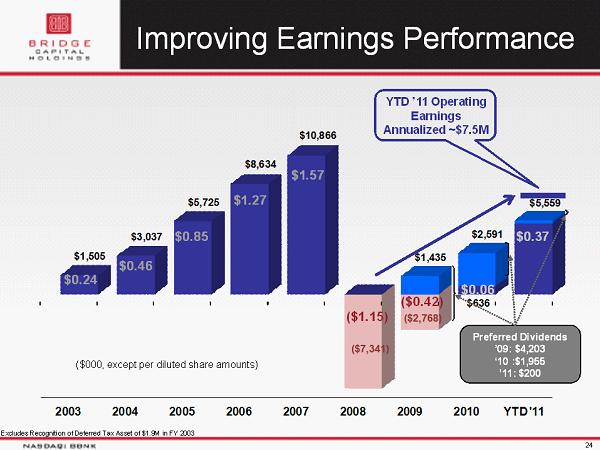
24 24 24 2003 2004 2005 2006 2007 2008 2009 2010 YTD '11 ($2,768) $636 $1,505 $3,037 $5,725 $8,634 $10,866 ($7,341) $1,435 $2,591 $5,559 Improving Earnings Performance $1.27 $1.57 ($000, except per diluted share amounts) $0.85 $0.46 $0.24 Excludes Recognition of Deferred Tax Asset of $1.9M in FY 2003 ($1.15) ($0.42) $0.06 Preferred Dividends ’09: $4,203 ‘10 :$ 1,955 ’11: $200 $ 0.37 YTD ’11 Operating Earnings Annualized ~$7.5M
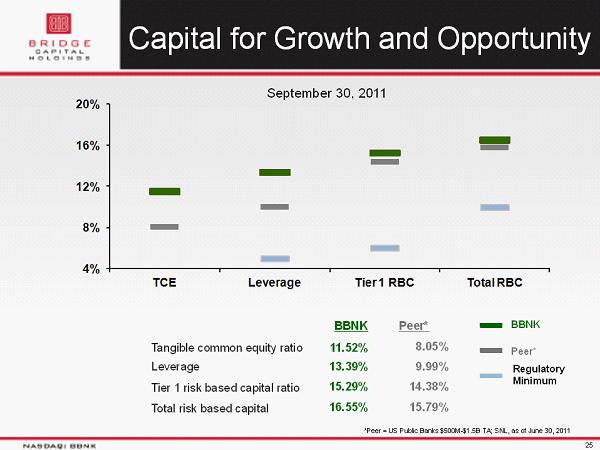
4% 8% 12% 16% 20% TCE Leverage Tier 1 RBC Total RBC 25 25 25 Capital for Growth and Opportunity September 30, 2011 *Peer = US Public Banks $500M - $1.5B TA; SNL, as of June 30, 2011 BBNK Peer* Tangible common equity ratio 11.52% 8.05% Leverage 13.39% 9.99% Tier 1 risk based capital ratio 15.29% 14.38% Total risk based capital 16.55% 15.79% Regulatory Minimum BBNK Peer*
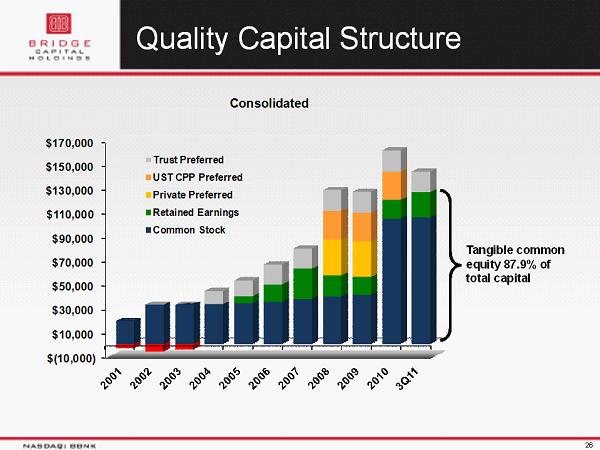
26 $(10,000) $10,000 $30,000 $50,000 $70,000 $90,000 $110,000 $130,000 $150,000 $170,000 Trust Preferred UST CPP Preferred Private Preferred Retained Earnings Common Stock Consolidated Quality Capital Structure 26 26 Tangible common equity 87.9% of total capital
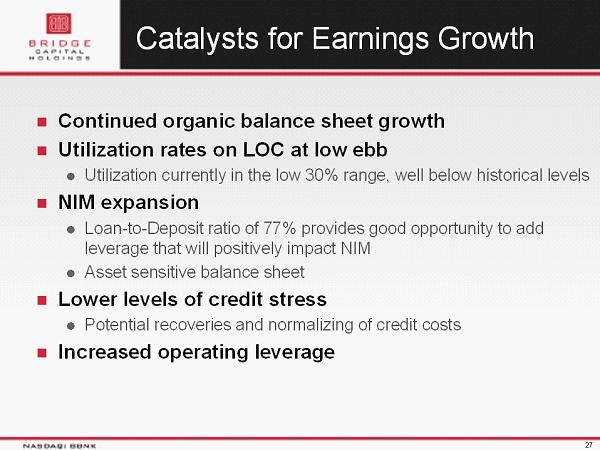
27 Catalysts for Earnings Growth Continued organic balance sheet growth Utilization rates on LOC at low ebb Utilization currently in the low 30% range, well below historical levels NIM expansion Loan - to - Deposit ratio of 77% provides good opportunity to add leverage that will positively impact NIM Asset sensitive balance sheet Lower levels of credit stress Potential recoveries and normalizing of credit costs Increased operating leverage 27
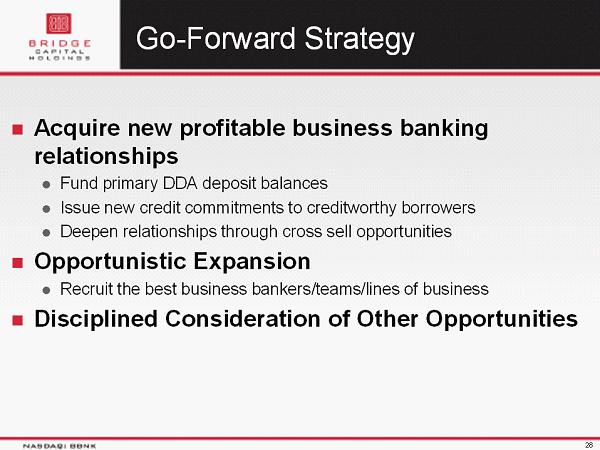
28 Go - Forward Strategy Acquire new profitable business banking relationships Fund primary DDA deposit balances Issue new credit commitments to creditworthy borrowers Deepen relationships through cross sell opportunities Opportunistic Expansion Recruit the best business bankers/teams/lines of business Disciplined Consideration of Other Opportunities 28

29
30
31 31 Thank You / Q & A