Attached files
| file | filename |
|---|---|
| EXCEL - IDEA: XBRL DOCUMENT - TREDEGAR CORP | Financial_Report.xls |
| EX-31.2 - SECTION 302 CFO CERTIFICATION - TREDEGAR CORP | d250965dex312.htm |
| EX-32.2 - SECTION 906 CFO CERTIFICATION - TREDEGAR CORP | d250965dex322.htm |
| EX-32.1 - SECTION 906 CEO CERTIFICATION - TREDEGAR CORP | d250965dex321.htm |
| EX-31.1 - SECTION 302 CEO CERTIFICATION - TREDEGAR CORP | d250965dex311.htm |
UNITED STATES
SECURITIES AND EXCHANGE COMMISSION
Washington, D.C. 20549
FORM 10-Q
(Mark One)
| x | QUARTERLY REPORT PURSUANT TO SECTION 13 OR 15(d) OF THE SECURITIES EXCHANGE ACT OF 1934 |
For the quarterly period ended September 30, 2011
OR
| ¨ | TRANSITION REPORT PURSUANT TO SECTION 13 OR 15(d) OF THE SECURITIES EXCHANGE ACT OF 1934 |
For the transition period from to
Commission file number 1-10258
Tredegar Corporation
(Exact Name of Registrant as Specified in Its Charter)
| Virginia | 54-1497771 | |
| (State or Other Jurisdiction of Incorporation or Organization) |
(I.R.S. Employer Identification No.) | |
| 1100 Boulders Parkway Richmond, Virginia |
23225 | |
| (Address of Principal Executive Offices) | (Zip Code) | |
Registrant’s Telephone Number, Including Area Code: (804) 330-1000
Indicate by check mark whether the registrant (1) has filed all reports required to be filed by Section 13 or 15(d) of the Securities Exchange Act of 1934 during the preceding 12 months (or for such shorter period that the registrant was required to file such reports), and (2) has been subject to such filing requirements for the past 90 days. Yes x No ¨
Indicate by check mark whether the registrant has submitted electronically and posted on its corporate Web site, if any, every Interactive Data File required to be submitted and posted pursuant to Rule 405 of Regulation S-T (232.405 of this chapter) during the preceding 12 months (or for such shorter period that the registrant was required to submit and post such files). Yes x No ¨
Indicate by check mark whether the registrant is a large accelerated filer, an accelerated filer, a non-accelerated filer, or a smaller reporting company. See the definitions of “large accelerated filer,” “accelerated filer” and “smaller reporting company” in Rule 12b-2 of the Exchange Act.
| Large accelerated filer | ¨ | Accelerated filer | x | |||
| Non-accelerated filer | ¨ (Do not check if a smaller reporting company) | Smaller reporting company | ¨ | |||
Indicate by check mark whether the registrant is a shell company (as defined in Rule 12b-2 of the Exchange Act). Yes ¨ No x
The number of shares of Common Stock, no par value, outstanding as of October 31, 2011: 32,018,725.
PART I - FINANCIAL INFORMATION
Item 1. Financial Statements.
Tredegar Corporation
Consolidated Balance Sheets
(In Thousands, Except Share Data)
(Unaudited)
| September 30, 2011 |
December 31, 2010 |
|||||||
| Assets |
||||||||
| Current assets: |
||||||||
| Cash and cash equivalents |
$ | 109,403 | $ | 73,191 | ||||
| Accounts and other receivables, net of allowance for doubtful accounts and sales returns of $3,060 in 2011 and $5,286 in 2010 |
100,058 | 84,076 | ||||||
| Income taxes recoverable |
9,898 | 6,643 | ||||||
| Inventories |
34,662 | 43,058 | ||||||
| Deferred income taxes |
5,992 | 6,924 | ||||||
| Prepaid expenses and other |
4,373 | 5,369 | ||||||
|
|
|
|
|
|||||
| Total current assets |
264,386 | 219,261 | ||||||
|
|
|
|
|
|||||
| Property, plant and equipment, at cost |
669,654 | 669,290 | ||||||
| Less accumulated depreciation |
485,383 | 462,453 | ||||||
|
|
|
|
|
|||||
| Net property, plant and equipment |
184,271 | 206,837 | ||||||
|
|
|
|
|
|||||
| Other assets and deferred charges |
48,030 | 48,127 | ||||||
| Goodwill and other intangibles, net |
106,242 | 106,117 | ||||||
|
|
|
|
|
|||||
| Total assets |
$ | 602,929 | $ | 580,342 | ||||
|
|
|
|
|
|||||
| Liabilities and Shareholders’ Equity |
||||||||
| Current liabilities: |
||||||||
| Accounts payable |
$ | 63,649 | $ | 58,209 | ||||
| Accrued expenses |
26,924 | 33,229 | ||||||
| Current portion of long-term debt |
— | 222 | ||||||
|
|
|
|
|
|||||
| Total current liabilities |
90,573 | 91,660 | ||||||
|
|
|
|
|
|||||
| Long-term debt |
— | 228 | ||||||
| Deferred income taxes |
51,757 | 51,879 | ||||||
| Other noncurrent liabilities |
19,256 | 19,029 | ||||||
|
|
|
|
|
|||||
| Total liabilities |
161,586 | 162,796 | ||||||
|
|
|
|
|
|||||
| Commitments and contingencies (Notes 1 and 3) |
||||||||
| Shareholders’ equity: |
||||||||
| Common stock, no par value (issued and outstanding - 32,018,725 at September 30, 2011 and 31,883,173 at December 31, 2010) |
13,134 | 10,724 | ||||||
| Common stock held in trust for savings restoration plan |
(1,340 | ) | (1,332 | ) | ||||
| Foreign currency translation adjustment |
21,792 | 23,572 | ||||||
| Gain (loss) on derivative financial instruments |
(266 | ) | 280 | |||||
| Pension and other postretirement benefit adjustments |
(56,946 | ) | (59,871 | ) | ||||
| Retained earnings |
464,969 | 444,173 | ||||||
|
|
|
|
|
|||||
| Total shareholders’ equity |
441,343 | 417,546 | ||||||
|
|
|
|
|
|||||
| Total liabilities and shareholders’ equity |
$ | 602,929 | $ | 580,342 | ||||
|
|
|
|
|
|||||
See accompanying notes to financial statements.
2
Tredegar Corporation
Consolidated Statements of Income
(In Thousands, Except Per Share Data)
(Unaudited)
| Three Months Ended September 30 |
Nine Months Ended September 30 |
|||||||||||||||
| 2011 | 2010 | 2011 | 2010 | |||||||||||||
| Revenues and other items: |
||||||||||||||||
| Sales |
$ | 202,590 | $ | 197,518 | $ | 595,080 | $ | 557,530 | ||||||||
| Other income (expense), net |
1,334 | 814 | 1,957 | 1,036 | ||||||||||||
|
|
|
|
|
|
|
|
|
|||||||||
| 203,924 | 198,332 | 597,037 | 558,566 | |||||||||||||
|
|
|
|
|
|
|
|
|
|||||||||
| Costs and expenses: |
||||||||||||||||
| Cost of goods sold |
164,771 | 158,648 | 489,754 | 450,346 | ||||||||||||
| Freight |
4,636 | 5,068 | 13,377 | 13,760 | ||||||||||||
| Selling, general and administrative |
17,926 | 16,758 | 49,335 | 50,508 | ||||||||||||
| Research and development |
3,298 | 5,102 | 10,042 | 12,003 | ||||||||||||
| Amortization of intangibles |
130 | 125 | 388 | 342 | ||||||||||||
| Interest expense |
367 | 358 | 1,083 | 775 | ||||||||||||
| Asset impairments and costs associated with exit and disposal activities |
193 | 109 | 1,277 | 520 | ||||||||||||
|
|
|
|
|
|
|
|
|
|||||||||
| Total |
191,321 | 186,168 | 565,256 | 528,254 | ||||||||||||
|
|
|
|
|
|
|
|
|
|||||||||
| Income from continuing operations before income taxes |
12,603 | 12,164 | 31,781 | 30,312 | ||||||||||||
| Income taxes |
(133 | ) | 3,196 | 6,329 | 10,602 | |||||||||||
|
|
|
|
|
|
|
|
|
|||||||||
| Income from continuing operations |
12,736 | 8,968 | 25,452 | 19,710 | ||||||||||||
| Loss from discontinued operations |
— | — | (345 | ) | — | |||||||||||
|
|
|
|
|
|
|
|
|
|||||||||
| Net income |
$ | 12,736 | $ | 8,968 | $ | 25,107 | $ | 19,710 | ||||||||
|
|
|
|
|
|
|
|
|
|||||||||
| Earnings per share: |
||||||||||||||||
| Basic |
||||||||||||||||
| Continuing operations |
$ | .40 | $ | .28 | $ | .80 | $ | .61 | ||||||||
| Discontinued operations |
— | — | (.01 | ) | — | |||||||||||
|
|
|
|
|
|
|
|
|
|||||||||
| Net income |
$ | .40 | $ | .28 | $ | .79 | $ | .61 | ||||||||
|
|
|
|
|
|
|
|
|
|||||||||
| Diluted |
||||||||||||||||
| Continuing operations |
$ | .40 | $ | .28 | $ | .79 | $ | .60 | ||||||||
| Discontinued operations |
— | — | (.01 | ) | — | |||||||||||
|
|
|
|
|
|
|
|
|
|||||||||
| Net income |
$ | .40 | $ | .28 | $ | .78 | $ | .60 | ||||||||
|
|
|
|
|
|
|
|
|
|||||||||
| Shares used to compute earnings per share: |
||||||||||||||||
| Basic |
31,952 | 31,779 | 31,918 | 32,455 | ||||||||||||
| Diluted |
32,060 | 31,995 | 32,175 | 32,648 | ||||||||||||
| Dividends per share |
$ | .045 | $ | .040 | $ | .135 | $ | .120 | ||||||||
See accompanying notes to financial statements.
3
Tredegar Corporation
Consolidated Statements of Cash Flows
(In Thousands)
(Unaudited)
| Nine Months Ended September 30 |
||||||||
| 2011 | 2010 | |||||||
| Cash flows from operating activities: |
||||||||
| Net income |
$ | 25,107 | $ | 19,710 | ||||
| Adjustments for noncash items: |
||||||||
| Depreciation |
32,139 | 32,316 | ||||||
| Amortization of intangibles |
388 | 342 | ||||||
| Deferred income taxes |
448 | (6,067 | ) | |||||
| Accrued pension and postretirement benefits |
1,861 | 844 | ||||||
| Loss on asset impairments and divestitures |
798 | 355 | ||||||
| Gain on disposal of assets |
(1,205 | ) | (15 | ) | ||||
| Changes in assets and liabilities, net of effects of acquisitions and divestitures: |
||||||||
| Accounts and other receivables |
(14,186 | ) | (24,697 | ) | ||||
| Inventories |
7,419 | (3,722 | ) | |||||
| Income taxes recoverable |
(3,255 | ) | 563 | |||||
| Prepaid expenses and other |
715 | 172 | ||||||
| Accounts payable and accrued expenses |
675 | 10,340 | ||||||
| Other, net |
(2,170 | ) | (523 | ) | ||||
|
|
|
|
|
|||||
| Net cash provided by operating activities |
48,734 | 29,618 | ||||||
|
|
|
|
|
|||||
| Cash flows from investing activities: |
||||||||
| Capital expenditures |
(11,235 | ) | (13,847 | ) | ||||
| Acquisition |
— | (5,500 | ) | |||||
| Net proceeds from the sale of assets and property disposals |
1,622 | 1,724 | ||||||
|
|
|
|
|
|||||
| Net cash used in investing activities |
(9,613 | ) | (17,623 | ) | ||||
|
|
|
|
|
|||||
| Cash flows from financing activities: |
||||||||
| Dividends paid |
(4,319 | ) | (3,865 | ) | ||||
| Debt principal payments and financing costs |
(89 | ) | (2,467 | ) | ||||
| Proceeds from exercise of stock options |
709 | 463 | ||||||
| Repurchases of Tredegar common stock |
— | (35,141 | ) | |||||
|
|
|
|
|
|||||
| Net cash used in financing activities |
(3,699 | ) | (41,010 | ) | ||||
|
|
|
|
|
|||||
| Effect of exchange rate changes on cash |
790 | (18 | ) | |||||
|
|
|
|
|
|||||
| Increase (decrease) in cash and cash equivalents |
36,212 | (29,033 | ) | |||||
| Cash and cash equivalents at beginning of period |
73,191 | 90,663 | ||||||
|
|
|
|
|
|||||
| Cash and cash equivalents at end of period |
$ | 109,403 | $ | 61,630 | ||||
|
|
|
|
|
|||||
See accompanying notes to financial statements.
4
Tredegar Corporation
Consolidated Statement of Shareholders’ Equity
(In Thousands, Except Share and Per Share Data)
(Unaudited)
| Accumulated Other Comprehensive Income (Loss) |
||||||||||||||||||||||||||||
| Common Stock |
Retained Earnings |
Trust for Savings Restoration Plan |
Foreign Currency Translation |
Gain (Loss) on Derivative Financial Instruments |
Pension & Other Post- retirement Benefit Adjust. |
Total Shareholders’ Equity |
||||||||||||||||||||||
| Balance December 31, 2010 |
$ | 10,724 | $ | 444,173 | $ | (1,332) | $ | 23,572 | $ | 280 | $ | (59,871) | $ | 417,546 | ||||||||||||||
|
|
|
|
|
|
|
|
|
|
|
|
|
|
|
|||||||||||||||
| Comprehensive income (loss): |
||||||||||||||||||||||||||||
| Net income |
— | 25,107 | — | — | — | — | 25,107 | |||||||||||||||||||||
| Other comprehensive income (loss): |
||||||||||||||||||||||||||||
| Foreign currency translation adjustment (net of tax benefit of $940) |
— | — | — | (1,780) | — | — | (1,780) | |||||||||||||||||||||
| Derivative financial instruments adjustment (net of tax benefit of $336) |
— | — | — | — | (546) | — | (546) | |||||||||||||||||||||
| Amortization of prior service costs and net gains or losses (net of tax of $1,646) |
— | — | — | — | — | 2,925 | 2,925 | |||||||||||||||||||||
|
|
|
|||||||||||||||||||||||||||
| Comprehensive income |
25,706 | |||||||||||||||||||||||||||
| Cash dividends declared ($.135 per share) |
— | (4,319) | — | — | — | — | (4,319) | |||||||||||||||||||||
| Stock-based compensation expense |
2,176 | — | — | — | — | — | 2,176 | |||||||||||||||||||||
| Issued upon exercise of stock options (including related income tax benefits of $110) & other |
234 | — | — | — | — | — | 234 | |||||||||||||||||||||
| Tredegar common stock purchased by trust for savings restoration plan |
— | 8 | (8) | — | — | — | — | |||||||||||||||||||||
|
|
|
|
|
|
|
|
|
|
|
|
|
|
|
|||||||||||||||
| Balance September 30, 2011 |
$ | 13,134 | $ | 464,969 | $ | (1,340) | $ | 21,792 | $ | (266) | $ | (56,946) | $ | 441,343 | ||||||||||||||
|
|
|
|
|
|
|
|
|
|
|
|
|
|
|
|||||||||||||||
See accompanying notes to financial statements.
5
TREDEGAR CORPORATION
NOTES TO THE CONSOLIDATED INTERIM FINANCIAL STATEMENTS
(Unaudited)
| 1. | In the opinion of management, the accompanying consolidated interim financial statements of Tredegar Corporation and Subsidiaries (“Tredegar,” “we,” “us” or “our”) contain all adjustments necessary to state fairly, in all material respects, Tredegar’s consolidated financial position as of September 30, 2011, the consolidated results of operations for the three and nine months ended September 30, 2011 and 2010, the consolidated cash flows for the nine months ended September 30, 2011 and 2010, and the consolidated changes in shareholders’ equity for the nine months ended September 30, 2011. All such adjustments, unless otherwise detailed in the notes to the consolidated interim financial statements, are deemed to be of a normal, recurring nature. These financial statements should be read in conjunction with the consolidated financial statements and related notes included in Tredegar’s Annual Report on Form 10-K for the year ended December 31, 2010. The results of operations for the three and nine months ended September 30, 2011, are not necessarily indicative of the results to be expected for the full year. |
| 2. | On October 14, 2011, TAC Holdings, LLC, a newly formed Virginia limited liability company (the “Buyer”), and Tredegar Film Products Corporation, which are indirect and direct, respectively, wholly-owned subsidiaries of Tredegar, entered into a Membership Interest Purchase Agreement (the “Purchase Agreement”) with Guacho Holdings, B.V. (the “Seller”) an indirect, wholly-owned subsidiary of Vision Capital Partners VII LP. On October 24, under the terms of the Purchase Agreement, the Buyer acquired from the Seller 100% of the outstanding equity interests of Terphane Holdings, LLC (“Terphane”) for approximately $188 million (subject to certain post-closing adjustments as provided in the Purchase Agreement). The purchase price was funded using available cash on hand and financing secured from our existing $300 million revolving credit facility. |
Terphane is headquartered in São Paulo, Brazil and operates two manufacturing facilities in Cabo, Pernambuco Brazil and Bloomfield, New York. It is a market leading producer of thin polyester films in Latin America with a growing presence in strategic niches in the United States. Polyester films have specialized properties, such as heat resistance and barrier protection, that make them uniquely suited for the fast-growing flexible packaging market. The acquisition of Terphane will thus allow us to extend our product offerings into adjacent specialty films markets and to expand in Latin America, which is one of the fastest growing and most dynamic geographic markets in the world.
| 3. | Plant shutdowns, asset impairments, restructurings and other charges are shown in the net sales and operating profit by segment table in Note 10, and unless otherwise noted below, are also included in “Asset impairments and costs associated with exit and disposal activities” in the consolidated statements of income. |
Plant shutdowns, asset impairments, restructurings and other items in the third quarter of 2011 include:
| • | Pretax charges of $2.3 million for acquisition-related expenses (included in “Selling, general and administrative expenses” in the consolidated statements of income) associated with the purchase of Terphane by Film Products; |
| • | Pretax gain of $1.0 million on the divestiture of our film products business in Roccamontepiano, Italy (included in “Other income (expenses), net” in the consolidated statements of income), which includes the recognition of previously unrealized foreign currency translation gains of $4.3 million that were associated with the business; |
6
| • | Pretax charges of $193,000 for severance and other employee-related costs in connection with restructurings in Film Products; and |
| • | Pretax losses of $43,000 for timing differences between the recognition of realized losses on aluminum futures contracts and related revenues from the delayed fulfillment by customers of fixed-price forward purchase commitments (included in “Cost of goods sold” in the consolidated statements of income). |
Plant shutdowns, asset impairments, restructurings and other items in the first nine months of 2011 include:
| • | Pretax charges of $2.3 million for acquisition-related expenses (included in “Selling, general and administrative expenses” in the consolidated statements of income) associated with the purchase of Terphane by Film Products; |
| • | Pretax gain of $1.0 million on the divestiture of our film products business in Roccamontepiano, Italy (included in “Other income (expenses), net” in the consolidated statements of income), which includes the recognition of previously unrealized foreign currency translation gains of $4.3 million that were associated with the business; |
| • | Pretax charges of $798,000 for asset impairments in Film Products; |
| • | Pretax charges of $479,000 for severance and other employee-related costs in connection with restructurings in Film Products; and |
| • | Pretax gains of $19,000 for timing differences between the recognition of realized losses on aluminum futures contracts and related revenues from the delayed fulfillment by customers of fixed-price forward purchase commitments (included in “Cost of goods sold” in the consolidated statements of income). |
Plant shutdowns, asset impairments, restructurings and other items in the third quarter of 2010 include:
| • | Pretax charge of $109,000 for severance and other employee-related costs in connection with restructurings in Film Products; and |
| • | Pretax gain of $14,000 for timing differences between the recognition of realized losses on aluminum futures contracts and related revenues from the delayed fulfillment by customers of fixed-price forward purchase commitments (included in “Cost of goods sold” in the consolidated statements of income). |
Plant shutdowns, asset impairments, restructurings and other items in the first nine months of 2010 include:
| • | Pretax gains of $480,000 for timing differences between the recognition of realized losses on aluminum futures contracts and related revenues from the delayed fulfillment by customers of fixed-price forward purchase commitments (included in “Cost of goods sold” in the consolidated statements of income); |
| • | Pretax charge of $355,000 for an asset impairment in Film Products; |
| • | Pretax charge of $165,000 for severance and other employee-related costs in connection with restructurings in Film Products; |
| • | Pretax gain of $120,000 on the sale of previously impaired equipment (included in “Other income (expense), net” in the consolidated statement of income) at our film products manufacturing facility in Pottsville, Pennsylvania; and |
| • | Pretax losses of $105,000 on the disposal of equipment (included in “Other income (expense), net” in the consolidated statements of income) from a previously shutdown film products manufacturing facility in LaGrange, Georgia. |
7
A reconciliation of the beginning and ending balances of accrued expenses related to asset impairments and costs associated with exit and disposal activities for the nine months ended September 30, 2011 is as follows:
| (In Thousands) |
Severance | Other (a) | Total | |||||||||
| Balance at December 31, 2010 |
$ | 237 | $ | 1,593 | $ | 1,830 | ||||||
| Changes in 2011: |
||||||||||||
| Charges |
479 | — | 479 | |||||||||
| Cash spent |
(359 | ) | (1,593 | ) | (1,952 | ) | ||||||
|
|
|
|
|
|
|
|||||||
| Balance at September 30, 2011 |
$ | 357 | $ | — | $ | 357 | ||||||
|
|
|
|
|
|
|
|||||||
| (a) | Other represents accrued losses on a sub-lease at a facility in Princeton, New Jersey. |
On February 12, 2008, we sold our aluminum extrusions business in Canada for approximately $25 million. All historical results for this business were previously reported in discontinued operations. In the second quarter of 2011, an adjustment of $345,000 ($345,000 net of tax) was made to amounts previously accrued for environmental obligations after we received notices of claims for indemnification under the related purchase agreement.
| 4. | The components of other comprehensive income or loss are as follows: |
| Three Months Ended September 30 |
Nine Months Ended September 30 |
|||||||||||||||
| (In Thousands) |
2011 | 2010 | 2011 | 2010 | ||||||||||||
| Net income |
$ | 12,736 | $ | 8,968 | $ | 25,107 | $ | 19,710 | ||||||||
| Foreign currency translation adjustment: |
||||||||||||||||
| Unrealized foreign currency translation adjustment arising during period |
(4,307 | ) | 5,404 | 1,001 | (2,060 | ) | ||||||||||
| Reclassification adjustment of foreign currency translation gain included in income (related to sale of film products business in Italy - see Note 3) |
(2,781 | ) | — | (2,781 | ) | — | ||||||||||
|
|
|
|
|
|
|
|
|
|||||||||
| Foreign currency translation adjustment |
(7,088 | ) | 5,404 | (1,780 | ) | (2,060 | ) | |||||||||
|
|
|
|
|
|
|
|
|
|||||||||
| Derivative financial instrument adjustment |
(330 | ) | 398 | (546 | ) | (562 | ) | |||||||||
| Amortization of prior service costs and net gains or losses |
905 | 910 | 2,925 | 2,306 | ||||||||||||
|
|
|
|
|
|
|
|
|
|||||||||
| Comprehensive income |
$ | 6,223 | $ | 15,680 | $ | 25,706 | $ | 19,394 | ||||||||
|
|
|
|
|
|
|
|
|
|||||||||
| 5. | The components of inventories are as follows: |
| (In Thousands) |
September 30, 2011 |
December 31, 2010 |
||||||
| Finished goods |
$ | 4,310 | $ | 7,373 | ||||
| Work-in-process |
2,107 | 3,669 | ||||||
| Raw materials |
10,441 | 15,327 | ||||||
| Stores, supplies and other |
17,804 | 16,689 | ||||||
|
|
|
|
|
|||||
| Total |
$ | 34,662 | $ | 43,058 | ||||
|
|
|
|
|
|||||
8
| 6. | Basic earnings per share is computed by dividing net income by the weighted average number of shares of common stock outstanding. Diluted earnings per share is computed by dividing net income by the weighted average common and potentially dilutive common equivalent shares outstanding, determined as follows: |
| Three Months Ended September 30 |
Nine Months Ended September 30 |
|||||||||||||||
| (In Thousands) |
2011 | 2010 | 2011 | 2010 | ||||||||||||
| Weighted average shares outstanding used to compute basic earnings per share |
31,952 | 31,779 | 31,918 | 32,455 | ||||||||||||
| Incremental dilutive shares attributable to stock options and restricted stock |
108 | 216 | 257 | 193 | ||||||||||||
|
|
|
|
|
|
|
|
|
|||||||||
| Shares used to compute diluted earnings per share |
32,060 | 31,995 | 32,175 | 32,648 | ||||||||||||
|
|
|
|
|
|
|
|
|
|||||||||
Incremental shares attributable to stock options and restricted stock are computed using the average market price during the related period. During the three and nine months ended September 30, 2011 and the three and nine months ended September 30, 2010, 693,183, 335,939, 368,267 and 432,300, respectively, of average out-of-the-money options to purchase shares of our common stock were excluded from the calculation of incremental shares attributable to stock options and restricted stock.
| 7. | We have invested $7.5 million in a privately held specialty pharmaceutical company. The company is developing and commercializing state of the art drug delivery systems designed to improve patient compliance and outcomes, and our ownership interest on a fully diluted basis is approximately 21%. The investment is accounted for under the fair value method. We elected the fair value option over the equity method of accounting since our investment objectives are similar to those of venture capitalists, which typically do not have controlling financial interests. |
At September 30, 2011 and December 31, 2010, the estimated fair value of our investment (also the carrying value included in “Other assets and deferred charges” in our balance sheet) was $16.0 million. The fair value estimates are based upon significant unobservable (Level 3) inputs since there is no secondary market for our ownership interest. Accordingly, until the next round of financing or other significant financial transaction, value estimates will primarily be based on assumptions relating to meeting product development and commercialization milestones, corresponding cash flow projections (projections of sales, costs, expenses, capital expenditures and working capital investment) and discounting of these factors for the high degree of risk. Adjustments to the estimated fair value of our investment will be made in the period during which changes can be quantified.
Had we not elected to account for our investment under the fair value method, we would have been required to use the equity method of accounting. For the three and nine months ended September 30, 2011, the specialty pharmaceutical company reported a net loss of $202,000 and net income of $423,000, respectively, compared to net income of $74,000 and net income of $11.2 million for the first three and nine months of 2010, respectively. Operating results included $2.3 million and $3.3 million in licensing revenues in the third quarters of 2011 and 2010, respectively, and $8.8 million and $25.8 million in the first nine months of 2011 and 2010, respectively. Total assets (which included cash and cash equivalents of $12.3 million at September 30, 2011 and $18.8 million at December 31, 2010) were $18.5 million and $26.6 million at September 30, 2011 and December 31, 2010, respectively.
Our investment in Harbinger Capital Partners Special Situations Fund, L.P. (“Harbinger Fund”) had a reported capital account value of $7.8 million at September 30, 2011, compared with $9.6 million at December 31, 2010. This investment had a carrying value in Tredegar’s balance
9
sheet (included in “Other assets and deferred charges”) of $5.7 million at September 30, 2011 and $6.4 million at December 31, 2010. The carrying value at September 30, 2011 reflected Tredegar’s cost basis in its investment in the Harbinger Fund, net of total withdrawal proceeds received. The timing and amount of future installments of withdrawal proceeds, which commenced in August 2010, were not known as of September 30, 2011. There were no gains or losses recognized due to our investment in Harbinger in 2011 or 2010. Gains on our investment in Harbinger will be recognized when the amounts expected to be collected from our withdrawal from the investment are known, which will likely be when cash in excess of our remaining carrying value is received. Losses will be recognized when management believes it is probable that future withdrawal proceeds will not exceed the remaining carrying value.
| 8. | We use derivative financial instruments for the purpose of hedging margin exposure from fixed-price forward sales contracts in Aluminum Extrusions and currency exchange rate exposures that exist due to specified transactions. Our derivative financial instruments are designated as and qualify as cash flow hedges and are recognized in the balance sheet at fair value. A change in the fair value of derivatives that are highly effective as and that are designated and qualify as cash flow hedges is recorded in other comprehensive income (loss). Gains and losses reported in other comprehensive income (loss) are reclassified to earnings in the periods in which earnings are affected by the variability of cash flows of the hedged transaction. Such gains and losses are reported on the same line as the underlying hedged item. Any hedge ineffectiveness (which represents the amount by which the changes in the fair value of the derivative exceed the variability in the cash flows of the forecasted transaction) is recorded in current period earnings. The amount of gains (losses) recognized for hedge ineffectiveness was not material to the third quarter or first nine months of 2011 and 2010. |
The fair value of derivative instruments recorded on the consolidated balance sheets are based upon significant other observable (Level 2) inputs within the corresponding commodity or foreign currency markets. If individual derivative instruments with the same counterparty can be settled on a net basis, we record the corresponding derivative fair values as a net asset or net liability.
In the normal course of business, we enter into fixed-price forward sales contracts with certain customers for the future sale of fixed quantities of aluminum extrusions at scheduled intervals. In order to hedge our margin exposure created from the fixing of future sales prices relative to volatile raw material (aluminum) costs, we enter into a combination of forward purchase commitments and futures contracts to acquire or hedge aluminum, based on the scheduled purchases for the firm sales commitments. The fixed-price firm sales commitments and related hedging instruments generally have durations of not more than 12 months, and the notional amount of aluminum futures contracts that hedged future purchases of aluminum to meet fixed-price forward sales contract obligations was $5.8 million (5.3 million pounds of aluminum) at September 30, 2011 and $5.8 million (5.7 million pounds of aluminum) at December 31, 2010.
10
The table below summarizes the location and gross amounts of aluminum futures contract fair values in the consolidated balance sheets as of September 30, 2011 and December 31, 2010:
| September 30, 2011 | December 31, 2010 | |||||||||||
| (In Thousands) |
Balance Sheet Account |
Fair Value |
Balance Sheet Account |
Fair Value |
||||||||
| Derivatives Designated as Hedging Instruments |
||||||||||||
| Asset derivatives: |
Prepaid expenses | |||||||||||
| Aluminum futures contracts |
Accrued expenses | $ | — | and other | $ | 490 | ||||||
| Liability derivatives: |
Prepaid expenses | |||||||||||
| Aluminum futures contracts |
Accrued expenses | $ | 428 | and other | $ | 36 | ||||||
In the event that the counterparty to an aluminum fixed-price forward sale contract chooses to not take delivery of its aluminum extrusions, the customer is contractually obligated to compensate us for any losses on the related aluminum futures and/or forward purchase contracts through the date of cancellation.
We used future fixed Euro-denominated contractual payments for equipment being purchased as part of our expansion of the Carthage, Tennessee aluminum extrusion manufacturing facility. We utilized a fixed rate Euro forward contract with various settlement dates through March 2010 to hedge exchange rate exposure on these obligations. There was no outstanding notional amount of this foreign currency forward contract at September 30, 2011 and December 31, 2010.
We receive Euro-based royalty payments relating to our operations in Europe. We have used zero-cost collar currency options to hedge a portion of our exposure to changes in cash flows due to variability in U.S. Dollar and Euro exchange rates. There was no outstanding notional amount for zero-cost collar currency option contracts at September 30, 2011 and December 31, 2010.
These derivative contracts involve elements of credit and market risk that are not reflected on our consolidated balance sheet, including the risk of dealing with counterparties and their ability to meet the terms of the contracts. The counterparties to our forward purchase commitments are major aluminum brokers and suppliers, and the counterparties to our aluminum futures contracts are major financial institutions. Fixed-price forward sales contracts are only made available to our most credit-worthy customers. The counterparties to our foreign currency futures and zero-cost collar option contracts are major financial institutions.
11
The effect on net income and other comprehensive income (loss) of derivative instruments classified as cash flow hedges and described in the previous paragraphs for the three and nine month periods ended September 30, 2011 and 2010 is summarized in the table below:
| (In Thousands) |
Cash Flow Derivative Hedges | |||||||||||||||
| Aluminum Futures Contracts |
Foreign Currency Forwards and Options |
|||||||||||||||
| Three Months Ended September 30 | ||||||||||||||||
| 2011 | 2010 | 2011 | 2010 | |||||||||||||
| Amount of pre-tax gain (loss) recognized in other comprehensive income |
$ | (478 | ) | $ | 783 | $ | — | $ | (341 | ) | ||||||
|
|
|
|
|
|
|
|
|
|||||||||
| Location of gain (loss) reclassified from accumulated other comprehensive income into net income (effective portion) |
|
Cost of sales |
|
|
Cost of sales |
|
|
Selling, general & admin. exp. |
| |||||||
| Amount of pre-tax gain (loss) reclassified from accumulated other comprehensive income to net income (effective portion) |
$ | 55 | $ | (160 | ) | $ | — | $ | (49 | ) | ||||||
|
|
|
|
|
|
|
|
|
|||||||||
| Cash Flow Derivative Hedges | ||||||||||||||||
| Aluminum Futures Contracts |
Foreign Currency Forwards and Options |
|||||||||||||||
| Nine Months Ended September 30 | ||||||||||||||||
| 2011 | 2010 | 2011 | 2010 | |||||||||||||
| Amount of pre-tax gain (loss) recognized in other comprehensive income |
$ | (242 | ) | $ | (305 | ) | $ | — | $ | (304 | ) | |||||
|
|
|
|
|
|
|
|
|
|||||||||
| Location of gain (loss) reclassified from accumulated other comprehensive income into net income (effective portion) |
|
Cost of sales |
|
|
Cost of sales |
|
|
Selling, general & admin. exp. |
| |||||||
| Amount of pre-tax gain (loss) reclassified from accumulated other comprehensive income to net income (effective portion) |
$ | 641 | $ | 325 | $ | — | $ | (49 | ) | |||||||
|
|
|
|
|
|
|
|
|
|||||||||
Gains and losses on the ineffective portion of derivative instruments or derivative instruments that were not designated as hedging instruments were immaterial for the three and nine months ended September 30, 2011 and 2010. As of September 30, 2011, we expect $266,000 of unrealized after-tax losses on derivative instruments reported in accumulated other comprehensive income (loss) to be reclassified to earnings within the next twelve months. For the three and nine months ended September 30, 2011 and 2010, net gains or losses realized on previously unrealized net gains or losses from hedges that had been discontinued were not material.
12
| 9. | The components of net periodic benefit cost for our pension and other post-retirement benefit programs reflected in consolidated results are shown below: |
| Pension Benefits for Three Months Ended September 30 |
Other Post-Retirement Benefits for Three Months Ended September 30 |
|||||||||||||||
| (In Thousands) |
2011 | 2010 | 2011 | 2010 | ||||||||||||
| Service cost |
$ | (919 | ) | $ | (892 | ) | $ | (15 | ) | $ | (21 | ) | ||||
| Interest cost |
(3,202 | ) | (3,227 | ) | (105 | ) | (107 | ) | ||||||||
| Expected return on plan assets |
5,123 | 5,132 | — | — | ||||||||||||
| Amortization of prior service costs, gains or losses and net transition asset |
(1,612 | ) | (1,421 | ) | 65 | 41 | ||||||||||
|
|
|
|
|
|
|
|
|
|||||||||
| Net periodic benefit cost |
$ | (610 | ) | $ | (408 | ) | $ | (55 | ) | $ | (87 | ) | ||||
|
|
|
|
|
|
|
|
|
|||||||||
| Pension Benefits for Nine Months Ended September 30 |
Other Post-Retirement Benefits for Nine Months Ended September 30 |
|||||||||||||||
| 2011 | 2010 | 2011 | 2010 | |||||||||||||
| Service cost |
$ | (2,521 | ) | $ | (2,486 | ) | $ | (41 | ) | $ | (57 | ) | ||||
| Interest cost |
(9,768 | ) | (9,804 | ) | (296 | ) | (350 | ) | ||||||||
| Expected return on plan assets |
15,336 | 15,397 | — | — | ||||||||||||
| Amortization of prior service costs, gains or losses and net transition asset |
(4,769 | ) | (3,603 | ) | 198 | 59 | ||||||||||
|
|
|
|
|
|
|
|
|
|||||||||
| Net periodic benefit cost |
$ | (1,722 | ) | $ | (496 | ) | $ | (139 | ) | $ | (348 | ) | ||||
|
|
|
|
|
|
|
|
|
|||||||||
We contributed $167,000 to our pension plans for continuing operations in 2010 and expect to contribute a similar amount in 2011. We fund our other post-retirement benefits (life insurance and health benefits) on a claims-made basis, which were $311,000 for the year ended December 31, 2010.
| 10. | We have four reportable segments, which include Film Products, Aluminum Extrusions, AFBS (formerly Therics, Inc.) and Other. The Other segment is comprised of the start-up operations of Bright View Technologies Corporation and Falling Springs, LLC. Information by business segment is reported below. There are no accounting transactions between segments and no allocations to segments. Net sales (sales less freight) and operating profit from ongoing operations are the measures of sales and operating profit used by the chief operating decision maker for purposes of assessing performance. |
13
The following table presents net sales and operating profit by segment for the three and nine months ended September 30, 2011 and 2010:
| Three Months Ended September 30 |
Nine Months Ended September 30 |
|||||||||||||||
| (In Thousands) |
2011 | 2010 | 2011 | 2010 | ||||||||||||
| Net Sales |
||||||||||||||||
| Film Products |
$ | 129,656 | $ | 137,325 | $ | 393,043 | $ | 389,692 | ||||||||
| Aluminum Extrusions |
66,815 | 54,629 | 186,712 | 152,099 | ||||||||||||
| Other |
1,483 | 496 | 1,948 | 1,979 | ||||||||||||
|
|
|
|
|
|
|
|
|
|||||||||
| Total net sales |
197,954 | 192,450 | 581,703 | 543,770 | ||||||||||||
| Add back freight |
4,636 | 5,068 | 13,377 | 13,760 | ||||||||||||
|
|
|
|
|
|
|
|
|
|||||||||
| Sales as shown in the Consolidated Statements of Income |
$ | 202,590 | $ | 197,518 | $ | 595,080 | $ | 557,530 | ||||||||
|
|
|
|
|
|
|
|
|
|||||||||
| Operating Profit (Loss) |
||||||||||||||||
| Film Products: |
||||||||||||||||
| Ongoing operations |
$ | 16,415 | $ | 17,828 | $ | 46,881 | $ | 50,732 | ||||||||
| Plant shutdowns, asset impairments, restructurings and other |
(1,435 | ) | (109 | ) | (2,519 | ) | (505 | ) | ||||||||
| Aluminum Extrusions: |
||||||||||||||||
| Ongoing operations |
2,301 | 140 | 2,539 | (2,618 | ) | |||||||||||
| Plant shutdowns, asset impairments, restructurings and other |
(43 | ) | 14 | 19 | 480 | |||||||||||
| Other: |
||||||||||||||||
| Ongoing operations |
(152 | ) | (840 | ) | (2,399 | ) | (2,934 | ) | ||||||||
|
|
|
|
|
|
|
|
|
|||||||||
| Total |
17,086 | 17,033 | 44,521 | 45,155 | ||||||||||||
| Interest income |
278 | 184 | 778 | 518 | ||||||||||||
| Interest expense |
367 | 358 | 1,083 | 775 | ||||||||||||
| Stock option-based compensation costs |
474 | 527 | 1,481 | 1,539 | ||||||||||||
| Corporate expenses, net |
3,920 | 4,168 | 10,954 | 13,047 | ||||||||||||
|
|
|
|
|
|
|
|
|
|||||||||
| Income from continuing operations before income taxes |
12,603 | 12,164 | 31,781 | 30,312 | ||||||||||||
| Income taxes |
(133 | ) | 3,196 | 6,329 | 10,602 | |||||||||||
|
|
|
|
|
|
|
|
|
|||||||||
| Income from continuing operations |
12,736 | 8,968 | 25,452 | 19,710 | ||||||||||||
| Loss from discontinued operations |
— | — | (345 | ) | — | |||||||||||
|
|
|
|
|
|
|
|
|
|||||||||
| Net income |
$ | 12,736 | $ | 8,968 | $ | 25,107 | $ | 19,710 | ||||||||
|
|
|
|
|
|
|
|
|
|||||||||
The following table presents identifiable assets by segment at September 30, 2011 and December 31, 2010:
| (In Thousands) |
September 30, 2011 |
December 31, 2010 |
||||||
| Film Products |
$ | 344,150 | $ | 363,312 | ||||
| Aluminum Extrusions |
87,534 | 81,731 | ||||||
| AFBS (formerly Therics) |
583 | 583 | ||||||
| Other |
21,647 | 19,701 | ||||||
|
|
|
|
|
|||||
| Subtotal |
453,914 | 465,327 | ||||||
| General corporate |
39,612 | 41,824 | ||||||
| Cash and cash equivalents |
109,403 | 73,191 | ||||||
|
|
|
|
|
|||||
| Total |
$ | 602,929 | $ | 580,342 | ||||
|
|
|
|
|
|||||
14
| 11. | The effective tax rate for continuing operations for the first nine months of 2011 was 19.9% compared to 35.0% in first nine months of 2010. The significant differences between the U.S. federal statutory rate and the effective income tax rate for the nine months ended September 30, 2011 and 2010 are as follows: |
| Percent of Income Before Income Taxes |
||||||||
| Nine Months Ended September 30 |
2011 | 2010 | ||||||
| Income tax expense at federal statutory rate |
35.0 | 35.0 | ||||||
| Non-deductible acquisition-related expenses |
2.4 | — | ||||||
| State taxes, net of federal income tax benefit |
2.1 | 0.9 | ||||||
| Unremitted earnings from foreign operations |
1.9 | 1.7 | ||||||
| Non-deductible expenses |
0.9 | 0.2 | ||||||
| Valuation allowance for foreign operating loss carry-forwards |
0.9 | 0.5 | ||||||
| Income tax contingency accruals/reversals |
0.4 | 0.1 | ||||||
| Changes in estimates related to prior year tax provision |
0.4 | (5.7 | ) | |||||
| Reserve for uncollectible tax indemnification receivable |
— | 2.4 | ||||||
| Domestic production activities deduction |
— | (1.2 | ) | |||||
| Valuation allowance for capital loss carry-forwards |
(0.1 | ) | 0.6 | |||||
| Research and development tax credit |
(0.9 | ) | — | |||||
| Foreign rate differences |
(4.5 | ) | 0.5 | |||||
| Deduction for divestiture of subsidiary stock |
(18.8 | ) | — | |||||
| Other |
0.2 | — | ||||||
|
|
|
|
|
|||||
| Effective income tax rate |
19.9 | 35.0 | ||||||
|
|
|
|
|
|||||
The effective tax rate for the first nine months of 2011 reflects an ordinary loss on the write-off of our investment in the film products business in Italy, which was divested in the third quarter of 2011. We anticipate realizing estimated tax benefits of approximately $5 million related to the divestiture of this business.
We claimed an ordinary loss on the write-off of our investment in our aluminum extrusions operations in Canada, which was sold in February 2008, on our 2008 consolidated tax return (included in discontinued operations in the consolidated statement of income in 2007). The Internal Revenue Service has challenged the ordinary nature of such deduction, asserting that the deduction should be re-characterized as capital in nature. We plan to vigorously defend our position related to this matter and believe that we will prevail but there can be no assurance of such a result. If the Company were not to prevail in final, non-appealable determinations, it is possible that the matter would result in additional tax payments of up to $12 million, plus any interest and penalties.
Tredegar and its subsidiaries file income tax returns in the U.S., various states and jurisdictions outside the U.S. Generally, except for refund claims and amended returns, Tredegar is no longer subject to U.S. federal income tax examinations by tax authorities for years before 2006. With few exceptions, Tredegar and its subsidiaries are no longer subject to state or non-U.S. income tax examinations by tax authorities for years before 2007.
| 12. | In May 2011, the Financial Accounting Standards Board (“FASB”) and the International Accounting Standards Board completed their joint project on fair value measurement and issued their respective final standards. The amended FASB guidance results in common fair value measurement and disclosure requirements for U.S. GAAP and International Financial Reporting Standards. Many of the changes to U.S. GAAP clarified existing guidance. Some changes, however, such as the change in the valuation premise and the application of premiums and discounts as well as new disclosure requirements, could have a more significant impact. The new disclosure requirements include: (1) enhanced disclosure for the valuation of all Level 3 fair value measurements; (2) disclosure of transfers between Level 1 and Level 2 fair value measurements on a gross basis, including reasons for those transfers; (3) disclosure about the highest and best use of |
15
| non-financial assets; and (4) disclosure of the fair value hierarchy categorization for those assets whose fair value is disclosed but not recognized on the balance sheet. The new FASB guidance is effective for interim and annual reporting periods beginning after December 15, 2011. Early application is not permitted. We are currently evaluating the impact of this guidance on our financial statements and disclosures. |
In June 2011, the FASB issued authoritative guidance that will require entities to present net income and other comprehensive income in either a single continuous statement or in two separate, but consecutive, statements of net income and other comprehensive income. The option to present the elements of other comprehensive income in the statement of changes in equity will be eliminated. The new guidance is effective for interim and annual periods beginning after December 15, 2011, however early application is permitted. In October 2011, the FASB decided to expose a proposed deferral of this new reporting requirement in response to concerns raised by issuers and other stakeholders. We will continue to monitor the FASB’s activities, and will implement the guidance when required.
In September 2011, the FASB issued guidance that changes the goodwill impairment guidance in order to reduce the cost and complexity of the annual impairment test. The changes will provide entities an option to perform a “qualitative” assessment to determine whether further impairment testing is necessary. If an entity believes, as a result of its qualitative assessment, that it is more-likely-than-not that the fair value of a reporting unit is less than its carrying amount, the quantitative impairment test will be required. Otherwise, no further testing will be required. The revised guidance will be effective for annual and interim goodwill impairment tests performed for fiscal years beginning after December 15, 2011. However, earlier adoption is permitted. We are currently evaluating the impact of this guidance on our annual impairment testing procedures.
16
Item 2. Management’s Discussion and Analysis of Financial Condition and Results of Operations.
Forward-looking and Cautionary Statements
Some of the information contained in this Quarterly Report on Form 10-Q may constitute “forward-looking statements” within the meaning of the “safe harbor” provisions of the Private Securities Litigation Reform Act of 1995. When we use the words “believe,” “estimate,” “anticipate,” “expect,” “project,” “likely,” “may” and similar expressions, we do so to identify forward-looking statements. Such statements are based on our then current expectations and are subject to a number of risks and uncertainties that could cause actual results to differ materially from those addressed in the forward-looking statements. It is possible that our actual results and financial condition may differ, possibly materially, from the anticipated results and financial condition indicated in or implied by these forward-looking statements. Accordingly, you should not place undue reliance on these forward-looking statements. Factors that could cause actual results to differ from expectations include, without limitation: acquired businesses, including Terphane, may not achieve the levels of revenue, profit, productivity, or otherwise perform as we expect; acquisitions, including our acquisition of Terphane, involve special risks, including without limitation, diversion of management’s time and attention to our existing businesses, the potential assumption of unanticipated liabilities and contingencies and potential difficulties in integrating acquired businesses and achieving anticipated operational improvements; Film Products is highly dependent on sales to one customer — The Procter & Gamble Company; growth of Film Products depends on its ability to develop and deliver new products at competitive prices; sales volume and profitability of Aluminum Extrusions are cyclical and highly dependent on economic conditions of end-use markets in the U.S., particularly in the construction sector, and are also subject to seasonal slowdowns; our substantial international operations subject us to risks of doing business in foreign countries, which could adversely affect our business, financial condition and results of operations; our future performance is influenced by costs incurred by our operating companies including, for example, the cost of energy and raw materials; and the other factors discussed in the reports Tredegar files with or furnishes to the Securities and Exchange Commission (the “SEC”) from time-to-time, including the risks and important factors set forth in additional detail in “Risk Factors” in Part I, Item 1A of Tredegar’s 2010 Annual Report on Form 10-K (the “2010 Form 10-K”) filed with the SEC. Readers are urged to review and carefully consider the disclosures Tredegar makes in the reports it files with or furnishes to the SEC, including its 2010 Form 10-K. Tredegar does not undertake to update any forward-looking statement to reflect any change in management’s expectations or any change in conditions, assumptions or circumstances on which such statements are based.
Executive Summary
On October 14, 2011, TAC Holdings, LLC, a newly formed Virginia limited liability company (the “Buyer”), and Tredegar Film Products Corporation, which are indirect and direct, respectively, wholly-owned subsidiaries of Tredegar, entered into a Membership Interest Purchase Agreement (the “Purchase Agreement”) with Guacho Holdings, B.V. (the “Seller”) an indirect, wholly-owned subsidiary of Vision Capital Partners VII LP. On October 24, 2011, under the terms of the Purchase Agreement, the Buyer acquired from the Seller 100% of the outstanding equity interests of Terphane Holdings, LLC (“Terphane”) for approximately $188 million (subject to certain post-closing adjustments as provided in the Purchase Agreement).
Terphane is headquartered in São Paulo, Brazil and operates two manufacturing facilities in Cabo, Pernambuco Brazil and Bloomfield, New York. It is a market leading producer of thin polyester films in Latin America with a growing presence in strategic niches in the United States. Polyester films have specialized properties, such as heat resistance and barrier protection, that make them uniquely suited for the fast-growing flexible packaging market. The acquisition of Terphane will thus allow us to extend our product offerings into adjacent specialty films markets and to expand in Latin America, which is one of the fastest growing and most dynamic geographic markets in the world.
17
Third-quarter 2011 net income from continuing operations was $12.7 million (40 cents per share) compared with $9.0 million (28 cents per share) in the third quarter of 2010. Net income from continuing operations for the first nine months of 2011 was $25.5 million (79 cents per share) compared with $19.7 million (60 cents per share) in the first nine months of 2010. Losses related to plant shutdowns, asset impairments, restructurings and other items are described in Note 3 on page 6. Net sales (sales less freight) and operating profit (loss) from ongoing operations are the measures of sales and operating profit used by the chief operating decision maker of each segment for purposes of assessing performance.
The following table presents Tredegar’s net sales and operating profit by segment for the three and nine months ended September 30, 2011 and 2010:
| Three Months Ended September 30 |
Nine Months Ended September 30 |
|||||||||||||||
| (In Thousands) |
2011 | 2010 | 2011 | 2010 | ||||||||||||
| Net Sales |
||||||||||||||||
| Film Products |
$ | 129,656 | $ | 137,325 | $ | 393,043 | $ | 389,692 | ||||||||
| Aluminum Extrusions |
66,815 | 54,629 | 186,712 | 152,099 | ||||||||||||
| Other |
1,483 | 496 | 1,948 | 1,979 | ||||||||||||
|
|
|
|
|
|
|
|
|
|||||||||
| Total net sales |
197,954 | 192,450 | 581,703 | 543,770 | ||||||||||||
| Add back freight |
4,636 | 5,068 | 13,377 | 13,760 | ||||||||||||
|
|
|
|
|
|
|
|
|
|||||||||
| Sales as shown in the Consolidated Statements of Income |
$ | 202,590 | $ | 197,518 | $ | 595,080 | $ | 557,530 | ||||||||
|
|
|
|
|
|
|
|
|
|||||||||
| Operating Profit (Loss) |
||||||||||||||||
| Film Products: |
||||||||||||||||
| Ongoing operations |
$ | 16,415 | $ | 17,828 | $ | 46,881 | $ | 50,732 | ||||||||
| Plant shutdowns, asset impairments, restructurings and other |
(1,435 | ) | (109 | ) | (2,519 | ) | (505 | ) | ||||||||
| Aluminum Extrusions: |
||||||||||||||||
| Ongoing operations |
2,301 | 140 | 2,539 | (2,618 | ) | |||||||||||
| Plant shutdowns, asset impairments, restructurings and other |
(43 | ) | 14 | 19 | 480 | |||||||||||
| Other: |
||||||||||||||||
| Ongoing operations |
(152 | ) | (840 | ) | (2,399 | ) | (2,934 | ) | ||||||||
|
|
|
|
|
|
|
|
|
|||||||||
| Total |
17,086 | 17,033 | 44,521 | 45,155 | ||||||||||||
| Interest income |
278 | 184 | 778 | 518 | ||||||||||||
| Interest expense |
367 | 358 | 1,083 | 775 | ||||||||||||
| Stock option-based compensation costs |
474 | 527 | 1,481 | 1,539 | ||||||||||||
| Corporate expenses, net |
3,920 | 4,168 | 10,954 | 13,047 | ||||||||||||
|
|
|
|
|
|
|
|
|
|||||||||
| Income from continuing operations before income taxes |
12,603 | 12,164 | 31,781 | 30,312 | ||||||||||||
| Income taxes |
(133 | ) | 3,196 | 6,329 | 10,602 | |||||||||||
|
|
|
|
|
|
|
|
|
|||||||||
| Income from continuing operations |
12,736 | 8,968 | 25,452 | 19,710 | ||||||||||||
| Loss from discontinued operations |
— | — | (345 | ) | — | |||||||||||
|
|
|
|
|
|
|
|
|
|||||||||
| Net income |
$ | 12,736 | $ | 8,968 | $ | 25,107 | $ | 19,710 | ||||||||
|
|
|
|
|
|
|
|
|
|||||||||
18
Film Products
A summary of operating results for Film Products is provided below:
| (In Thousands, Except Percentages) |
Quarter Ended September 30 |
Favorable/ (Unfavorable) % Change |
Nine Months Ended September 30 |
Favorable/ (Unfavorable) % Change |
||||||||||||||||||||
| 2011 | 2010 | 2011 | 2010 | |||||||||||||||||||||
| Sales volume (pounds) |
51,396 | 58,232 | (11.7 | )% | 157,852 | 167,032 | (5.5 | )% | ||||||||||||||||
| Net sales |
$ | 129,656 | $ | 137,325 | (5.6 | )% | $ | 393,043 | $ | 389,692 | 0.9 | % | ||||||||||||
| Operating profit from ongoing operations |
$ | 16,415 | $ | 17,828 | (7.9 | )% | $ | 46,881 | $ | 50,732 | (7.6 | )% | ||||||||||||
Net sales (sales less freight) in Film Products for the third quarter of 2011 decreased compared to the same period for the prior year primarily due to lower volumes in surface protection materials and personal care films, partially offset by an increase in average selling prices from the pass-through of higher resin prices to customers and the favorable impact of the change in the U.S. dollar value of currencies for operations outside the U.S. As noted in previous quarters, the slowdown in end-user demand for large-sized LCD panels has negatively impacted our market for surface protection materials. Reduced consumer demand for applications that utilize our premium personal care films has also contributed to the reduction in sales volumes. In 2010, volumes for personal care films included the favorable impact of a surge in volume associated with a new product ramp-up.
Net sales for the first nine months of 2011 remained relatively unchanged from the same period in 2010 as a result of an increase in average selling prices with the pass-through of higher average resin costs to customers and the favorable impact of the change in the U.S. dollar value of currencies for operations outside the U.S., offset by lower volumes noted above.
Operating profit from ongoing operations decreased in the third quarter and year-to-date periods of 2011 compared with the comparable periods in the prior year due primarily to the lower volumes noted above. The unfavorable impact of lower volumes was partially offset by cost reduction efforts and improved manufacturing efficiencies in the current year as well as the favorable impact of both the lag in the pass-through of higher resin costs and the change in the U.S. dollar value of currencies for operations outside the U.S. Operating results in the third quarter of 2010 were adversely impacted by operational inefficiencies that resulted from a surge in customer demand and the ramp-up of new products.
Film Products has index-based pass-through raw material cost agreements for the majority of its business. However, under certain agreements, changes in resin prices are not passed through for an average period of 90 days. The estimated favorable impact of the quarterly lag in the pass-through of changes in average resin costs was $2.5 million in the third quarter of 2011, compared to a favorable impact of $311,000 in the third quarter of 2010. The change in the U.S. dollar value of currencies for operations outside the U.S. had a favorable impact of approximately $1.2 million in the third quarter of 2011 compared to the third quarter of 2010. For the first nine months of 2011, the estimated impact of the resin pass-through lag was an unfavorable $1.8 million versus an unfavorable $4.6 million for the first nine months of 2010. The change in the U.S. dollar value of currencies for operations outside the U.S. had a favorable impact of approximately $1.7 million in the first nine months of 2011 compared to the first nine months of 2010.
Sales volumes and operating profits in Film Products are expected to be unfavorably impacted by lower end-user demand and competitive pricing pressures for some of our more mature product lines. We expect to incur some margin compression, which may not fully be offset by costs saving measures and manufacturing efficiency initiatives as we enter into new multi-year supply agreements for these mature products.
19
Capital expenditures in Film Products were $8.9 million in the first nine months of 2011 compared with $11.2 million in the first nine months of last year. Film Products currently projects that capital expenditures will be approximately $12 million in 2011. Depreciation expense was $25.5 million in the first nine months of 2011 and $25.1 million in the first nine months of 2010, and is projected to be approximately $34 million in 2011.
Aluminum Extrusions
A summary of operating results for Aluminum Extrusions is provided below:
| (In Thousands, | Quarter Ended September 30 |
Favorable/ (Unfavorable) |
Nine Months Ended September 30 |
Favorable/ (Unfavorable) |
||||||||||||||||||||
| Except Percentages) |
2011 | 2010 | % Change | 2011 | 2010 | % Change | ||||||||||||||||||
| Sales volume (pounds) |
29,484 | 26,290 | 12.1 | % | 82,679 | 72,187 | 14.5 | % | ||||||||||||||||
| Net sales |
$ | 66,815 | $ | 54,629 | 22.3 | % | $ | 186,712 | $ | 152,099 | 22.8 | % | ||||||||||||
| Operating profit (loss) from ongoing operations |
$ | 2,301 | $ | 140 | 1,543.6 | % | $ | 2,539 | $ | (2,618 | ) | |||||||||||||
Net sales in the third quarter and first nine months of 2011 increased in comparison to the same periods in 2010 due to higher volumes and an increase in average selling prices driven by higher aluminum prices. The improvement in results from ongoing operations versus the third quarter and first nine months of 2010 was primarily driven by higher volumes as some of our key customers have gained momentum in their related markets.
Capital expenditures in Aluminum Extrusions were $2.2 million in the first nine months of 2011 compared with $2.3 million in the first nine months of last year. Capital expenditures are projected to be approximately $2.8 million in 2011. Depreciation expense was $6.3 million in the first nine months of 2011 compared with $6.9 million in the first nine months of last year, and is projected to be approximately $8.4 million in 2011.
Other
The Other segment is comprised of the start-up operations of Bright View Technologies Corporation (Bright View Technologies) and Falling Springs, LLC (Falling Springs). Bright View Technologies is a developer and producer of high-value microstructure-based optical films for the LED (light emitting diode) and fluorescent lighting markets. Falling Springs develops, owns and operates multiple mitigation banks. Through the establishment of perpetual easements to restore, enhance and preserve wetlands, streams or other protected environmental resources, these mitigation banks create saleable credits that are used by the purchaser of credits to offset the negative environmental impacts from private and public development projects.
Net sales for this segment can fluctuate from quarter-to-quarter as Bright View Technologies is a late-stage development company and Falling Springs’ revenue can vary based upon the timing of development projects within its markets. Operating losses from ongoing operations were $152,000 and $2.4 million for the three and nine month periods ended September 30, 2011, respectively, compared to $840,000 and $2.9 million for the three and nine month periods ended September 30, 2010, respectively.
20
Corporate Expenses, Interest and Taxes
Pension expense was $610,000 in the third quarter of 2011 and $1.7 million in the first nine months of 2011, an unfavorable change of $202,000 and $1.2 million, respectively, from the pension expense recognized in comparable periods of 2010. Most of the impact of pensions on earnings is reflected in “Corporate expenses, net” in the net sales and operating profit by segment table. We contributed $167,000 to our pension plans for continuing operations in 2010, and minimum required contributions to our pension plans in 2011 are expected to be comparable. Corporate expenses, net decreased in 2011 versus 2010 due to lower performance-based incentives and the favorable impact of the timing of recognition of other corporate-related expenses, partially offset by the unfavorable impact of pension expense noted above.
The effective tax rate used to compute income taxes from continuing operations for the first nine months of 2011 was 19.9% compared to 35.0% in the first nine months of 2010. The significant differences between the U.S. federal statutory rate and the effective tax rate for the first nine months of 2011 and 2010 is shown in the table provided in Note 11 on page 15.
Net capitalization and other credit measures are provided in the liquidity and capital resources section beginning on page 25.
Critical Accounting Policies
In the ordinary course of business, we make a number of estimates and assumptions relating to the reporting of results of operations and financial position in the preparation of financial statements in conformity with generally accepted accounting principles. We believe the estimates, assumptions and judgments described in the section “Management’s Discussion and Analysis of Financial Condition and Results of Operations – Critical Accounting Policies” of our Annual Report on Form 10-K for the year ended December 31, 2010, have the greatest potential impact on our financial statements, so we consider these to be our critical accounting policies. These policies include our accounting for impairment of long-lived assets and goodwill, investment accounted for under the fair value method, pension benefits and income taxes. These policies require management to exercise judgments that are often subjective and complex due to the necessity of estimating the effect of matters that are inherently uncertain. Actual results could differ significantly from those estimates under different assumptions and conditions. We believe the consistent application of these policies enables us to provide readers of our financial statements with useful and reliable information about our operating results and financial condition. Since December 31, 2010, there have been no changes in these policies that have had a material impact on results of operations or financial position. See Note 3 on page 6 for losses related to plant shutdowns, asset impairments, restructurings and other items occurring during the third quarter and first nine months of 2011 and the comparable periods in 2010.
Recently Issued Accounting Standards
In May 2011, the Financial Accounting Standards Board (“FASB”) and the International Accounting Standards Board completed their joint project on fair value measurement and issued their respective final standards. The amended FASB guidance results in common fair value measurement and disclosure requirements for U.S. GAAP and International Financial Reporting Standards. Many of the changes to U.S. GAAP clarified existing guidance. Some changes, however, such as the change in the valuation premise and the application of premiums and discounts as well as new disclosure requirements, could have a more significant impact. The new disclosure requirements include: (1) enhanced disclosure for the valuation of all Level 3 fair value measurements; (2) disclosure of transfers between Level 1 and Level 2 fair value measurements on a gross basis, including reasons for those transfers; (3) disclosure about the highest and best use of non-financial assets; and (4) disclosure of the fair value hierarchy categorization for those assets whose fair value is disclosed but not recognized on the balance sheet. The new FASB guidance is effective for interim and annual reporting periods beginning after December 15, 2011. Early application is not permitted. We are currently evaluating the impact of this guidance on our financial statements and disclosures.
21
In June 2011, the FASB issued authoritative guidance that will require entities to present net income and other comprehensive income in either a single continuous statement or in two separate, but consecutive, statements of net income and other comprehensive income. The option to present the elements of other comprehensive income in the statement of changes in equity will be eliminated. The new guidance is effective for interim and annual periods beginning after December 15, 2011, however early application is permitted. In October 2011, the FASB decided to expose a proposed deferral of this new reporting requirement in response to concerns raised by issuers and other stakeholders. We will continue to monitor the FASB’s activities, and will implement the guidance when required.
In September 2011, the FASB issued guidance that changes the goodwill impairment guidance in order to reduce the cost and complexity of the annual impairment test. The changes will provide entities an option to perform a “qualitative” assessment to determine whether further impairment testing is necessary. If an entity believes, as a result of its qualitative assessment, that it is more-likely-than-not that the fair value of a reporting unit is less than its carrying amount, the quantitative impairment test will be required. Otherwise, no further testing will be required. The revised guidance will be effective for annual and interim goodwill impairment tests performed for fiscal years beginning after December 15, 2011. However, earlier adoption is permitted. We are currently evaluating the impact of this guidance on our annual impairment testing procedures.
Results of Operations
Third Quarter 2011 Compared with Third Quarter 2010
Overall, sales in the third quarter of 2011 increased by 2.6% compared with the third quarter of 2010. Net sales (sales less freight) decreased 5.6% in Film Products primarily due to lower volumes in personal care films and surface protection materials, partially offset by an increase in average selling prices from the pass-through of higher resin prices and the favorable impact of the change in the U.S. dollar value of currencies for operations outside the U.S. Net sales increased 22.3% in Aluminum Extrusions due to higher sales volume in most markets and an increase in average selling prices driven by higher aluminum prices. For more information on net sales and volume, see the executive summary beginning on page 17.
Consolidated gross profit (sales minus cost of goods sold and freight) as a percentage of sales decreased to 16.4% in the third quarter of 2011 from 17.1% in the third quarter of 2010. The gross profit margin in Film Products decreased primarily due to lower sales volumes noted above, partially offset by the estimated favorable impact of the quarterly lag in the pass-through of changes in average resin costs and the change in the U.S. dollar value of currencies for operations outside the U.S. Gross profit margin in Aluminum Extrusions increased as a result of the higher sales volumes noted above.
As a percentage of sales, selling, general and administrative and R&D expenses were 10.5% in the third quarter of 2011, down from 11.1% in the third quarter of last year. The decrease in selling, general and administrative and R&D expenses as a percentage of sales can be attributed to the 2.6% increase in year-over-year sales noted above and lower performance-based incentive accruals, partially offset by higher acquisition-related expenditures in 2011.
22
Plant shutdowns, asset impairments, restructurings and other items in the third quarter of 2011 shown in the segment operating profit table on page 18 include:
| • | Pretax charges of $2.3 million for acquisition-related expenses (included in “Selling, general and administrative expenses” in the consolidated statements of income) associated with the purchase of Terphane by Film Products; |
| • | Pretax gain of $1.0 million on the divestiture of our film products business in Roccamontepiano, Italy (included in “Other income (expenses), net” in the consolidated statements of income), which includes the recognition of previously unrealized foreign currency translation gains of $4.3 million that were associated with the business; |
| • | Pretax charges of $193,000 for severance and other employee-related costs in connection with restructurings in Film Products; and |
| • | Pretax losses of $43,000 for timing differences between the recognition of realized losses on aluminum futures contracts and related revenues from the delayed fulfillment by customers of fixed-price forward purchase commitments (included in “Cost of goods sold” in the consolidated statements of income). |
Plant shutdowns, asset impairments, restructurings and other items in the third quarter of 2010 shown in the segment operating profit table on page 18 include:
| • | Pretax charge of $109,000 for severance and other employee-related costs in connection with restructurings in Film Products; and |
| • | Pretax gain of $14,000 for timing differences between the recognition of realized losses on aluminum futures contracts and related revenues from the delayed fulfillment by customers of fixed-price forward purchase commitments (included in “Cost of goods sold” in the consolidated statements of income). |
Interest income, which is included in “Other income (expense), net” in the consolidated statements of income, was $278,000 in the third quarter of 2011 and $184,000 in the third quarter of 2010. Interest expense, which includes the amortization of debt issue costs, was $367,000 in the third quarter of 2011 in comparison to $358,000 in the third quarter of last year.
Average debt outstanding and interest rates were as follows:
| Three Months Ended September 30 |
||||||||
| (In Millions) |
2011 | 2010 | ||||||
| Floating-rate debt with interest charged on a rollover basis at one-month LIBOR plus a credit spread: |
||||||||
| Average outstanding debt balance |
$ | — | $ | — | ||||
| Average interest rate |
n/a | n/a | ||||||
| Fixed-rate and other debt: |
||||||||
| Average outstanding debt balance |
$ | .2 | $ | .8 | ||||
| Average interest rate |
3.2 | % | 2.1 | % | ||||
|
|
|
|
|
|||||
| Total debt: |
||||||||
| Average outstanding debt balance |
$ | .2 | $ | .8 | ||||
| Average interest rate |
3.2 | % | 2.1 | % | ||||
|
|
|
|
|
|||||
The effective tax rate used to compute taxes from continuing operations for the third quarter of 2011 was (1.1)% compared to 26.3% in the third quarter of 2010. The change in the effective tax rate for
23
the third quarter reflects the impact to income taxes during the third quarter to adjust the effective tax rate for the first nine months of the year to the rate estimated for the entire year. The significant differences between the U.S. federal statutory rate and the effective tax rate for the first nine months is shown in the table provided in Note 11 on page 15.
First Nine Months of 2011 Compared with First Nine Months of 2010
Overall, sales in the first nine months of 2011 increased by 6.7% compared with 2010. Net sales increased 0.9% in Film Products primarily due to an increase in average selling prices from the pass-through of higher resin prices, offset by lower volumes in personal care films and surface protection materials. Net sales from ongoing operations increased 22.8% in Aluminum Extrusions due to higher sales volume in most markets and an increase in average selling prices driven by higher aluminum prices. For more information on net sales and volume, see the executive summary beginning on page 17.
Consolidated gross profit as a percentage of sales increased to 17.1% in the first nine months of 2011 from 16.8% in 2010. The gross profit margin in Film Products decreased primarily due to lower volumes in personal care films and surface protection materials, partially offset the estimated favorable impact of the quarterly lag in the pass-through of changes in average resin costs and the change in the U.S. dollar value of currencies for operations outside the U.S. Gross profit margin in Aluminum Extrusions increased as a result of the higher sales volumes noted above.
As a percentage of sales, selling, general and administrative and R&D expenses were 10.0% in the first nine months of 2011, down from 11.2% in the first nine months of last year. The decrease in selling, general and administrative and R&D expenses as a percentage of sales can be attributed to the 6.7% increase in year-over-year sales noted above and lower performance-based incentive accruals, partially offset by higher acquisition-related expenditures in 2011.
Plant shutdowns, asset impairments, restructurings and other items in the first nine months of 2011 shown in the segment operating profit table on page 18 include:
| • | Pretax charges of $2.3 million for acquisition-related expenses (included in “Selling, general and administrative expenses” in the consolidated statements of income) associated with the purchase of Terphane by Film Products; |
| • | Pretax gain of $1.0 million on the divestiture of our film products business in Roccamontepiano, Italy (included in “Other income (expenses), net” in the consolidated statements of income), which includes the recognition of previously unrealized foreign currency translation gains of $4.3 million that were associated with the business; |
| • | Pretax charges of $798,000 for asset impairments in Film Products; |
| • | Pretax charges of $479,000 for severance and other employee-related costs in connection with restructurings in Film Products; and |
| • | Pretax gains of $19,000 for timing differences between the recognition of realized losses on aluminum futures contracts and related revenues from the delayed fulfillment by customers of fixed-price forward purchase commitments (included in “Cost of goods sold” in the consolidated statements of income). |
Plant shutdowns, asset impairments, restructurings and other items in the first nine months of 2010 shown in the segment operating profit table on page 18 include:
| • | Pretax gains of $480,000 for timing differences between the recognition of realized losses on aluminum futures contracts and related revenues from the delayed fulfillment by customers of fixed-price forward purchase commitments (included in “Cost of goods sold” in the consolidated statements of income); |
24
| • | Pretax charge of $355,000 for an asset impairment in Film Products; |
| • | Pretax charge of $165,000 for severance and other employee-related costs in connection with restructurings in Film Products; |
| • | Pretax gain of $120,000 on the sale of previously impaired equipment (included in “Other income (expense), net” in the consolidated statement of income) at our film products manufacturing facility in Pottsville, Pennsylvania; and |
| • | Pretax losses of $105,000 on the disposal of equipment (included in “Other income (expense), net” in the consolidated statements of income) from a previously shutdown film products manufacturing facility in LaGrange, Georgia. |
Interest income, which is included in “Other income (expense), net” in the consolidated statements of income, was $778,000 in the first nine months of 2011 and $518,000 in first nine months of 2010. Interest expense, which includes the amortization of debt issue costs, was $1.1 million in the first nine months of 2011 compared to $775,000 for the same period in 2010.
Average debt outstanding and interest rates were as follows:
| Nine Months Ended September 30 |
||||||||
| (In Millions) |
2011 | 2010 | ||||||
| Floating-rate debt with interest charged on a rollover basis at one-month LIBOR plus a credit spread: |
||||||||
| Average outstanding debt balance |
$ | — | $ | — | ||||
| Average interest rate |
n/a | n/a | ||||||
| Fixed-rate and other debt: |
||||||||
| Average outstanding debt balance |
$ | .4 | $ | 1.0 | ||||
| Average interest rate |
4.4 | % | 3.1 | % | ||||
|
|
|
|
|
|||||
| Total debt: |
||||||||
| Average outstanding debt balance |
$ | .4 | $ | 1.0 | ||||
| Average interest rate |
4.4 | % | 3.1 | % | ||||
|
|
|
|
|
|||||
The effective tax rate used to compute income taxes from continuing operations was 19.9% in the first nine months of 2011 compared with 35.0% in the first nine months of 2010. The significant differences between the U.S. federal statutory rate and the effective tax rate for the first nine months is shown in the table provided in Note 11 on page 15.
Liquidity and Capital Resources
Changes in operating assets and liabilities from December 31, 2010 to September 30, 2011 are summarized below:
| • | Accounts receivable increased $16.0 million (19.0%). |
| • | Accounts receivable in Film Products increased by $5.5 million primarily due to the timing of cash receipts. |
| • | Accounts receivable in Aluminum Extrusions increased by $12.1 million due to higher sales and the timing of cash receipts. |
| • | Account and other receivables in corporate and other segment businesses decreased $1.6 million due to the timing of cash receipts. |
25
| • | Inventories decreased $8.4 million (19.5%). |
| • | Inventories in Film Products decreased by approximately $6.9 million. Lower inventories at Film Products can be primarily attributed to lower sales volume for personal care films and surface protection materials as well as efforts to reduce inventory levels. |
| • | Inventories for Aluminum Extrusions decreased by approximately $1.5 million due to the timing of shipments. |
| • | Net property, plant and equipment decreased $22.6 million (10.9%) due primarily to depreciation of $32.1 million, capital expenditures of $11.2 million, asset disposals of $2.0 million associated with the divestiture of the Film Products business in Italy, asset impairments of $798,000 and a change in the value of the U.S. Dollar relative to foreign currencies ($821,000 increase). |
| • | Accounts payable increased $5.4 million (9.3%). |
| • | Accounts payable in Film Products increased $1.5 million due to the timing of payments to vendors. |
| • | Accounts payable in Aluminum Extrusions increased by $3.8 million, or 16.6%, primarily due to the timing of aluminum purchases as a result of higher volumes and an increase in raw materials costs due to higher average aluminum prices. |
| • | Accrued expenses decreased by $6.3 million (19.0%) primarily due to lower performance-based incentive accruals and the settlement of estimated losses on a sub-lease at a facility in Princeton, New Jersey. |
| • | Net deferred income tax liabilities in excess of assets increased by $810,000. Income taxes recoverable increased $3.3 million due primarily to the timing of payments. |
Cash provided by operating activities was $48.7 million in the first nine months of 2011 compared with cash provided by operating activities of $29.6 million in 2010. The change is primarily related to normal volatility of working capital components.
Cash used in investing activities was $9.6 million in the first nine months of 2011 compared with $17.6 million in the first nine months of 2010. Cash used in investing activities in 2011 primarily includes capital expenditures of $11.2 million.
Net cash flow used in financing activities was $3.7 million in the first nine months of 2011 and related to the payment of regular quarterly dividends of $4.3 million (13.5 cents per share), partially offset by the proceeds from the exercise of stock options. Net cash flow used in financing activities was $41.0 million in the first nine months of 2010 and related to the repurchase of 2.1 million shares of Tredegar common stock for $35.1 million and the payment of regular quarterly dividends of $3.9 million (12 cents per share).
Further information on cash flows for the nine months ended September 30, 2011 and 2010 are provided in the consolidated statements of cash flows on page 4.
26
Net capitalization and indebtedness as defined under our revolving credit agreement as of September 30, 2011 were as follows:
| Net Capitalization and Indebtedness as of September 30, 2011 | ||||
| (In Thousands) |
||||
| Net capitalization: |
||||
| Cash and cash equivalents |
$ | 109,403 | ||
| Debt: |
||||
| $300 million revolving credit agreement maturing June 21, 2014 |
— | |||
| Other debt |
— | |||
|
|
|
|||
| Total debt |
— | |||
|
|
|
|||
| Cash and cash equivalents net of debt |
(109,403 | ) | ||
| Shareholders’ equity |
441,343 | |||
|
|
|
|||
| Net capitalization |
$ | 331,940 | ||
|
|
|
|||
| Indebtedness as defined in revolving credit agreement: |
||||
| Total debt |
$ | — | ||
| Face value of letters of credit |
5,394 | |||
| Liabilities relating to derivative financial instruments, net of cash deposits |
428 | |||
| Other |
123 | |||
|
|
|
|||
| Indebtedness |
$ | 5,945 | ||
|
|
|
|||
Under the revolving credit agreement, borrowings are permitted up to $300 million, and approximately $267 million was available to borrow at September 30, 2011 based upon the most restrictive covenants (no amounts borrowed at September 30, 2011). In October 2011, we borrowed $125 million under the revolving credit agreement and used $63 million of cash on hand to fund the purchase price for our acquisition of Terphane.
The credit spread and commitment fees charged on the unused amount under the revolving credit agreement at various indebtedness-to-adjusted EBITDA levels are as follows:
| Pricing Under Revolving Credit Agreement (Basis Points) |
||||||||
| Indebtedness-to-Adjusted EBITDA Ratio |
Credits Spread Over LIBOR |
Commitment Fee |
||||||
| > 2.0x but <= 3.0x |
250 | 40 | ||||||
| > 1.0x but <=2.0x |
225 | 35 | ||||||
| <= 1.0x |
200 | 30 | ||||||
At September 30, 2011, the interest rate on debt under the revolving credit agreement was priced at one-month LIBOR plus the applicable credit spread of 200 basis points.
The computations of adjusted EBITDA, adjusted EBIT, the leverage ratio and interest coverage ratio as defined in the revolving credit agreement as of September 30, 2011 are presented below along with the related most restrictive covenants. Adjusted EBITDA and adjusted EBIT as defined in the revolving credit agreement are not intended to represent net income (loss) or cash flow from operations as defined by GAAP and should not be considered as either an alternative to net income or to cash flow.
27
| Computations of Adjusted EBITDA, Adjusted EBIT, Leverage Ratio and | ||||
| Interest Coverage Ratio as Defined in Revolving Credit Agreement Along with Related Most | ||||
| Restrictive Covenants | ||||
| As of and for the Twelve Months Ended September 30, 2011 (In Thousands) |
||||
| Computations of adjusted EBITDA and adjusted EBIT as defined in revolving credit agreement for the twelve months ended September 30, 2011: |
||||
| Net income |
$ | 32,424 | ||
| Plus: |
||||
| After-tax losses related to discontinued operations |
345 | |||
| Total income tax expense for continuing operations |
9,483 | |||
| Interest expense |
1,444 | |||
| Depreciation and amortization expense for continuing operations |
43,457 | |||
| All non-cash losses and expenses, plus cash losses and expenses not to exceed $10,000, for continuing operations that are classified as unusual, extraordinary or which are related to plant shutdowns, asset impairments and/or restructurings (cash-related of $879) |
1,930 | |||
| Charges related to stock option grants and awards accounted for under the fair value-based method |
2,006 | |||
| Losses related to the application of the equity method of accounting |
— | |||
| Losses related to adjustments in the estimated fair value of assets accounted for under the fair value method of accounting |
2,200 | |||
| Minus: |
||||
| After-tax income related to discontinued operations |
— | |||
| Total income tax benefits for continuing operations |
— | |||
| Interest income |
(969 | ) | ||
| All non-cash gains and income, plus cash gains and income in excess of $10,000, for continuing operations that are classified as unusual, extraordinary or which are related to plant shutdowns, asset impairments and/or restructurings |
(1,016 | ) | ||
| Income related to changes in estimates for stock option grants and awards accounted for under the fair value-based method |
— | |||
| Income related to the application of the equity method of accounting |
(8 | ) | ||
| Income related to adjustments in the estimated fair value of assets accounted for under the fair value method of accounting |
— | |||
| Plus cash dividends declared on investments accounted for under the equity method of accounting |
13 | |||
| Plus or minus, as applicable, pro forma EBITDA adjustments associated with acquisitions and asset dispositions |
— | |||
|
|
|
|||
| Adjusted EBITDA as defined in revolving credit agreement |
91,309 | |||
| Less: Depreciation and amortization expense for continuing operations (including pro forma for acquisitions and asset dispositions) |
(43,457 | ) | ||
|
|
|
|||
| Adjusted EBIT as defined in revolving credit agreement |
$ | 47,852 | ||
|
|
|
|||
| Shareholders’ equity at September 30, 2011 as defined in revolving credit agreement |
$ | 441,343 | ||
| Computations of leverage and interest coverage ratios as defined in revolving credit agreement at September 30, 2011: |
||||
| Leverage ratio (indebtedness-to-adjusted EBITDA) |
.07x | |||
| Interest coverage ratio (adjusted EBIT-to-interest expense) |
33.14x | |||
| Most restrictive covenants as defined in revolving credit agreement: |
||||
| Maximum permitted aggregate amount of dividends that can be paid by Tredegar during the term of the revolving credit agreement ($100,000 plus 50% of net income generated beginning January 1, 2010) |
$ | 126,067 | ||
| Minimum adjusted shareholders’ equity permitted ($300,000 plus 50% of net income generated, to the extent positive, beginning January 1, 2010) |
$ | 326,067 | ||
| Maximum leverage ratio permitted: |
||||
| Ongoing |
3.00x | |||
| Pro forma for acquisitions |
2.50x | |||
| Minimum interest coverage ratio permitted |
2.50x | |||
28
We had no outstanding borrowings under our $300 million revolving credit agreement as of September 30, 2011. However, as noted above, in October 2011, we borrowed $125 million under our revolving credit agreement to fund a portion of the purchase price for our acquisition of Terphane. Noncompliance with any one or more of the debt covenants may have a material adverse effect on financial condition or liquidity in the event such noncompliance cannot be cured or should we be unable to obtain a waiver from the lenders as we would not be permitted to borrow under the credit facility and any amounts outstanding would become due and payable. Renegotiation of the covenant(s) through an amendment to the credit agreement may effectively cure the noncompliance, but may have an effect on financial condition or liquidity depending upon how the covenant is renegotiated.
We believe that the existing borrowing availability, our current cash balances and our cash flow from operations will be sufficient to satisfy our working capital, capital expenditure and dividend requirements for the foreseeable future.
| Item 3. | Quantitative and Qualitative Disclosures About Market Risk. |
Tredegar has exposure to the volatility of interest rates, polyethylene and polypropylene resin prices, aluminum ingot and scrap prices, energy prices, foreign currencies and emerging markets. See the liquidity and capital resources section beginning on page 25 regarding credit agreements and interest rate exposures.
Changes in resin prices, and the timing of those changes, could have a significant impact on profit margins in Film Products. Profit margins in Aluminum Extrusions are sensitive to fluctuations in aluminum ingot and scrap prices as well as natural gas prices (natural gas is the principal energy source used to operate our casting furnaces). There is no assurance of our ability to pass through higher raw material and energy costs to our customers.
See the executive summary beginning on page 17 for discussion regarding the impact of the lag in the pass-through of resin price changes. The volatility of average quarterly prices of low density polyethylene resin in the U.S. (a primary raw material for Film Products) is shown in the chart below.
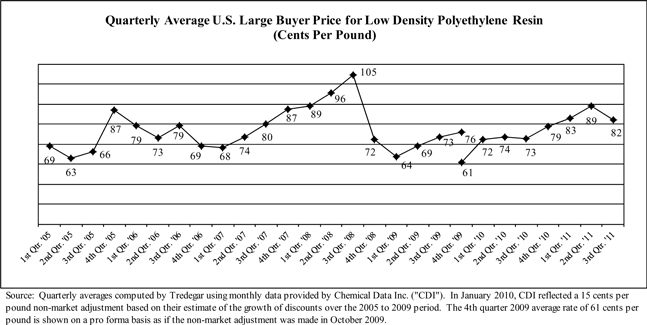
29
Resin prices in Europe, Asia and South America have exhibited similar long-term trends. The price of resin is driven by several factors including supply and demand and the price of oil, ethylene and natural gas. To address fluctuating resin prices, Film Products has index-based pass-through raw material cost agreements for the majority of its business. However, under certain agreements, changes in resin prices are not passed through for an average period of 90 days.
In the normal course of business, we enter into fixed-price forward sales contracts with certain customers for the sale of fixed quantities of aluminum extrusions at scheduled intervals. In order to hedge our exposure to aluminum price volatility (see the chart below) under these fixed-price arrangements, which generally have a duration of not more than 12 months, we enter into a combination of forward purchase commitments and futures contracts to acquire or hedge aluminum, based on the scheduled deliveries. See Note 8 on page 10 for additional information.
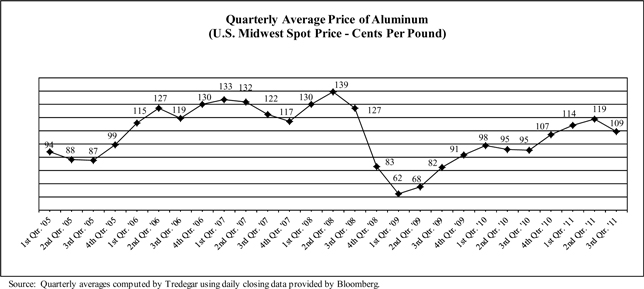
In Aluminum Extrusions, we hedge from time-to-time a portion of our exposure to natural gas price volatility by entering into fixed-price forward purchase contracts with our natural gas suppliers. We estimate that, in an unhedged situation, every $1 per mmBtu per month change in the market price of natural gas has a $78,000 impact on the continuing monthly operating profit in Aluminum Extrusions. In September 2005, we announced an energy surcharge for our aluminum extrusions business in the U.S. to be applied when the NYMEX natural gas price is in excess of $8.85 per mmBtu.
30
Trends for the quarterly average price of natural gas are below:
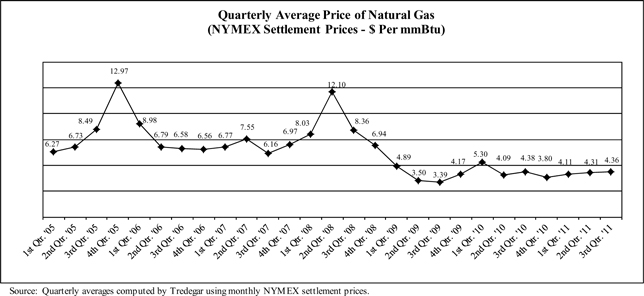
We sell to customers in foreign markets through our foreign operations and through exports from U.S. plants. The percentage of sales for manufacturing operations related to foreign markets for the first nine months of 2011 and 2010 are as follows:
| Percentage of Net Sales from Ongoing Operations Related to Foreign Markets* |
||||||||||||||||
| Nine Months Ended September 30 | ||||||||||||||||
| 2011 | 2010 | |||||||||||||||
| Exports From U.S. |
Foreign Operations |
Exports From U.S. |
Foreign Operations |
|||||||||||||
| Canada |
7 | % | — | % | 7 | % | — | % | ||||||||
| Europe |
1 | 16 | 1 | 16 | ||||||||||||
| Latin America |
1 | 3 | — | 3 | ||||||||||||
| Asia |
8 | 4 | 9 | 5 | ||||||||||||
|
|
|
|
|
|
|
|
|
|||||||||
| Total |
17 | % | 23 | % | 17 | % | 24 | % | ||||||||
|
|
|
|
|
|
|
|
|
|||||||||
The percentages for foreign markets are relative to Tredegar’s total net sales from ongoing operations
We attempt to match the pricing and cost of our products in the same currency and generally view the volatility of foreign currencies (see trends for the Euro and Chinese Yuan in the chart below) and emerging markets, and the corresponding impact on earnings and cash flow, as part of the overall risk of operating in a global environment. Exports from the U.S. are generally denominated in U.S. Dollars. Our foreign currency exposure on income from foreign operations relates to the Euro, the Chinese Yuan, the Hungarian Forint, the Brazilian Real and the Indian Rupee.
In Film Products, where we are typically able to match the currency of our sales and costs, we estimate that the change in value of foreign currencies relative to the U.S. Dollar had a positive impact on operating profit of approximately $1.2 million in the third quarter of 2011 compared with the third quarter of 2010, and a positive impact of approximately $1.7 million in the first nine months of 2011 compared to the first nine months of 2010.
31
Trends for the Euro and Chinese Yuan are shown in the chart below:
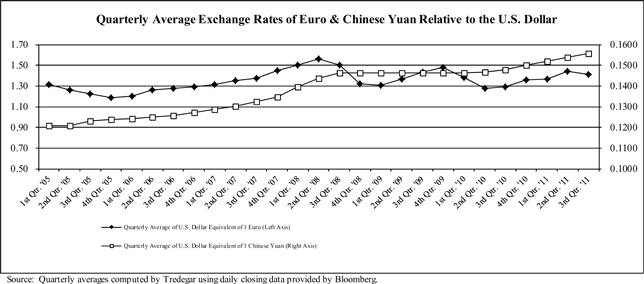
| Item 4. | Controls and Procedures. |
Pursuant to Rule 13a-15(b) under the Securities Exchange Act of 1934, we carried out an evaluation, with the participation of our management, including our principal executive officer and principal financial officer, of the effectiveness of our disclosure controls and procedures (as defined under Rule 13a-15(e) under the Securities Exchange Act of 1934) as of the end of the period covered by this report. Based upon that evaluation, our principal executive officer and principal financial officer concluded that our disclosure controls and procedures are effective to ensure that information required to be disclosed by us in the reports that we file or submit under the Securities Exchange Act of 1934, is recorded, processed, summarized and reported, within the time periods specified in the SEC’s rules and forms, and that such information is accumulated and communicated to our management, including our principal executive officer and principal financial officer, as appropriate, to allow timely decisions regarding required disclosure.
There has been no change in our internal control over financial reporting during the quarter ended September 30, 2011, that has materially affected, or is reasonably likely to materially affect, our internal control over financial reporting.
PART II - OTHER INFORMATION
| Item 1A. | Risk Factors. |
There are a number of risks and uncertainties that can have a material effect on the operating results of our businesses and our financial condition. These risk factors have not changed materially since the filing of our Annual Report on Form 10-K for the year ended December 31, 2010.
32
| Item 6. | Exhibits. |
Exhibit Nos.
| 4.1 | Amendment to Amended and Restated Rights Agreement, dated as of June 30, 2009, between Tredegar Corporation and Computershare Trust Company, N.A., as Rights Agent (filed as Exhibit 2 to Amendment No. 3 to Tredegar Corporation’s Registration Statement on Form 8-A/A (File No. 1-10258) filed on September 2, 2011, and incorporated herein by reference). | |
| 4.2 | Amendment to Amended and Restated Rights Agreement, dated as of June 30, 2009, between Tredegar Corporation and Computershare Trust Company, N.A., as Rights Agent (filed as Exhibit 3 to Amendment No. 3 to Tredegar Corporation’s Registration Statement on Form 8-A/A (File No. 1-10258) filed on September 2, 2011, and incorporated herein by reference). | |
| 31.1 | Certification of Nancy M. Taylor, President and Chief Executive Officer of Tredegar Corporation, pursuant to Rules 13a-14(a) and 15d-14(a) promulgated under the Securities Exchange Act of 1934, as adopted pursuant to Section 302 of the Sarbanes-Oxley Act of 2002. | |
| 31.2 | Certification of Kevin A. O’Leary, Vice President, Chief Financial Officer and Treasurer (Principal Financial Officer) of Tredegar Corporation, pursuant to Rules 13a-14(a) and 15d-14(a) promulgated under the Securities Exchange Act of 1934, as adopted pursuant to Section 302 of the Sarbanes-Oxley Act of 2002. | |
| 32.1 | Certification of Nancy M. Taylor, President and Chief Executive Officer of Tredegar Corporation, pursuant to 18 U.S.C. Section 1350, as adopted pursuant to Section 906 of the Sarbanes-Oxley Act of 2002. | |
| 32.2 | Certification of Kevin A. O’Leary, Vice President, Chief Financial Officer and Treasurer (Principal Financial Officer) of Tredegar Corporation, pursuant to 18 U.S.C. Section 1350, as adopted pursuant to Section 906 of the Sarbanes-Oxley Act of 2002. | |
| 101 | XBRL Instance Document and Related Items | |
33
SIGNATURES
Pursuant to the requirements of the Securities Exchange Act of 1934, the Registrant has duly caused this report to be signed on its behalf by the undersigned thereunto duly authorized.
| Tredegar Corporation | ||||||
| (Registrant) | ||||||
| Date: | November 3, 2011 |
/s/ Nancy M. Taylor | ||||
| Nancy M. Taylor | ||||||
| President and Chief Executive Officer | ||||||
| (Principal Executive Officer) | ||||||
| Date: | November 3, 2011 |
/s/ Kevin A. O’Leary | ||||
| Kevin A. O’Leary | ||||||
| Vice President, Chief Financial Officer and | ||||||
| Treasurer | ||||||
| (Principal Financial Officer) | ||||||
| Date: | November 3, 2011 |
/s/ Frasier W. Brickhouse, II | ||||
| Frasier W. Brickhouse, II | ||||||
| Controller | ||||||
| (Principal Accounting Officer) | ||||||
34