Attached files
| file | filename |
|---|---|
| 8-K - FORM 8-K - Sabra Health Care REIT, Inc. | sbra8-k11211.htm |
| EX-99.1 - PRESS RELEASE OF SABRA HEALTH CARE REIT, INC., DATED NOVEMBER 2, 2011 - Sabra Health Care REIT, Inc. | sbraex991093011.htm |
Exhibit 99.2

Supplemental Information
September 30, 2011
(Unaudited)


Disclaimer
Certain information contained in this supplement includes forward-looking statements. Forward-looking statements include statements regarding our expectations, beliefs, intentions, plans, objectives, goals, strategies, future events or performance and underlying assumptions and other statements that are not statements of historical facts. These statements may be identified, without limitation by the use of “expects,” “believes,” “intends,” “should” or comparable terms or the negative thereof. Forward-looking statements in this supplement include all statements regarding expected future financial position, results of operations, cash flows, liquidity, financing plans, business strategy, the expected amounts and timing of dividends and distributions, projected expenses and capital expenditures, competitive position, growth opportunities, potential acquisitions and plans and objectives of management for future operations.
These statements are made as of the date hereof and are subject to known and unknown risks, uncertainties, assumptions and other factors—many of which are out of the Company’s control and difficult to forecast—that could cause actual results to differ materially from those set forth in or implied by forward-looking statements. These risks and uncertainties include but are not limited to: our dependence on Sun Healthcare Group, Inc. (“New Sun”) until we are able to further diversify our portfolio; our ability to qualify and maintain our status as a real estate investment trust (“REIT”); changes in general economic conditions and volatility in financial and credit markets; our ability to pursue and complete acquisitions, including the ability of the parties to pending acquisitions to satisfy specified closing conditions, and the costs and management attention required to do so; the significant amount of our indebtedness; covenants in our debt agreements that may restrict our ability to make acquisitions, incur additional indebtedness and refinance indebtedness on favorable terms; increases in market interest rates; the impact of healthcare reform legislation on our business; the impact of reductions in CMS reimbursement on the business of our tenants; competitive conditions in our industry; and other factors discussed from time to time in our news releases, public statements and/or filings with the Securities and Exchange Commission (the “SEC”), especially the “Risk Factors” sections of our Annual and Quarterly Reports on Forms 10-K and 10-Q. The Company assumes no, and hereby disclaims any, obligation to update any of the foregoing or any other forward-looking statements as a result of new information or new or future developments, except as otherwise required by law.
Forward-looking information is provided by us pursuant to the safe harbor established under the Private Securities Litigation Reform Act of 1995 and should be evaluated in the context of these factors. We disclaim any intent or obligation to update these forward-looking statements.
Note Regarding Non-GAAP Financial Measures
This supplement includes the following financial measures defined as non-GAAP financial measures by the SEC: EBITDA, funds from operations (“FFO”), adjusted FFO (“AFFO”), normalized AFFO, FFO per diluted share, AFFO per diluted share and normalized AFFO per diluted share. These measures may be different than non-GAAP financial measures used by other companies, and the presentation of these measures is not intended to be considered in isolation or as a substitute for financial information prepared and presented in accordance with U.S. generally accepted accounting principles. Explanations of these non-GAAP financial measures are included under “Reporting Definitions” in this supplement and reconciliations of these non-GAAP financial measures to the GAAP financial measures we consider most comparable are included under “Reconciliations of Net Income to EBITDA, Funds from Operations (FFO), Adjusted Funds from Operations (AFFO) and Normalized AFFO” in this supplement.
Tenant Information
This supplement includes information regarding New Sun. New Sun is subject to the reporting requirements of the SEC and is required to file with the SEC annual reports containing audited financial information and quarterly reports containing unaudited financial information. New Sun's filings with the SEC can be found at www.sec.gov. This supplement also includes information regarding the tenants of each of (i) Texas Regional Medical Center at Sunnyvale, (ii) Oak Brook Health Care Center, and (iii) four skilled nursing facilities—Broadmeadow Healthcare, Capitol Healthcare, Pike Creek Healthcare and Renaissance Healthcare (collectively, the “Cadia Portfolio”)—we have acquired. The information related to these tenants that is provided in this supplement has been provided by the tenants or, in the case of New Sun, derived from New Sun's public filings or provided by New Sun. We have not independently verified this information. We have no reason to believe that such information is inaccurate in any material respect. We are providing this data for informational purposes only. Tenant financial information related to the two skilled nursing facilities we acquired on September 30, 2011—Honey Hill Care Center and Manokin Manor Nursing & Rehabilitation Center (collectively, the “Aurora Portfolio”)—is not included in the information presented because the Aurora Portfolio was not acquired until the end of the period presented.

Table of Contents
Portfolio Geographic Concentrations | |
Recent Acquisition Activity | |
Company Information
Board of Directors
Richard K. Matros Chairman of the Board, President and Chief Executive Officer Sabra Health Care REIT, Inc. | Michael J. Foster Managing Director RFE Management Corp. | |
Milton J. Walters President Tri-River Capital | Robert A. Ettl Chief Operating Officer Harvard Management Company | |
Craig A. Barbarosh Partner Pillsbury Winthrop Shaw Pittman LLP | ||
Senior Management
Richard K. Matros Chairman of the Board, President and Chief Executive Officer | Harold W. Andrews, Jr. Executive Vice President, Chief Financial Officer and Secretary | |
Talya Nevo-Hacohen Executive Vice President, Chief Investment Officer and Treasurer | ||
Other Information
Corporate Headquarters 18500 Von Karman Avenue, Suite 550 Irvine, CA 92612 | Transfer Agent American Stock Transfer and Trust Company 6201 15th Avenue Brooklyn, NY 11219 | |
www.sabrahealth.com
The information in this supplemental information package should be read in conjunction with the Company’s Annual Report on Form 10-K, Quarterly Reports on Form 10-Q, Current Reports on Form 8-K and other information filed with the SEC. The Reporting Definitions and Reconciliations of Non-GAAP Measures are an integral part of the information presented herein.
On Sabra's website, www.sabrahealth.com, you can access, free of charge, Sabra’s Annual Report on Form 10-K, Quarterly Reports on Form 10-Q, Current Reports on Form 8-K, and amendments to those reports filed or furnished pursuant to Sections 13(a) or 15(d) of the Securities Exchange Act of 1934, as amended, as soon as reasonably practicable after such material is filed with, or furnished to, the SEC. The information contained on Sabra’s website is not incorporated by reference into, and should not be considered a part of, this supplemental information package. All material filed with the SEC can also be accessed through their website, www.sec.gov.
For more information, contact Harold W. Andrews, Jr., Executive Vice President, Chief Financial Officer and Secretary at
(949) 679-0243.
(949) 679-0243.
| 1 | |
SABRA HEALTH CARE REIT, INC.
COMPANY FACT SHEET
Company Profile
Sabra Health Care REIT, Inc., a Maryland corporation (“Sabra,” the “Company” or “we”), is a self-administered, self-managed real estate investment trust (“REIT”) that, through its subsidiaries, owns and invests in real estate serving the healthcare industry. Sabra operates through an umbrella partnership (commonly referred to as an UPREIT) structure in which substantially all of its properties and assets are held by Sabra Health Care Limited Partnership, of which Sabra is the sole general partner, or by subsidiaries of Sabra Health Care Limited Partnership. Sabra primarily generates revenues by leasing properties to tenants and operators throughout the United States. As of September 30, 2011, Sabra’s portfolio included 94 real estate properties (consisting of (i) 74 skilled nursing facilities, (ii) ten combined skilled nursing, assisted living and independent living facilities, (iii) five assisted living facilities, (iv) two mental health facilities, (v) one independent living facility, (vi) one continuing care retirement community, and (vii) one acute care hospital), and one mortgage note secured by a combined assisted living, independent living and memory care facility in Ann Arbor, Michigan. As of September 30, 2011, Sabra’s 94 properties had a total of 10,578 licensed beds, or units, spread across 22 states.
Sabra began operations on November 15, 2010, following the completion of a restructuring of Sun Healthcare Group, Inc.’s (“Old Sun”) business whereby Old Sun separated its real estate assets and its operating assets into two separate publicly traded companies – Sabra and SHG Services, Inc. (which has been renamed Sun Healthcare Group, Inc., and which we refer to in this supplement as New Sun). This separation was accounted for as a reverse spin-off whereby the assets and liabilities of Sabra are recorded based on the historical carrying values of Old Sun. Subsidiaries of Sabra lease 86 of our properties to subsidiaries of New Sun pursuant to triple-net master lease agreements. Sabra is organized as a REIT and intends to elect to be treated as a REIT for U.S. federal income tax purposes commencing with its taxable year beginning January 1, 2011. Shares of Sabra common stock are traded on the NASDAQ Global Select Market under the symbol “SBRA.”
Objectives and Strategies
Strategy & Business Model
Sabra’s business strategies focus on opportunistic acquisitions and property diversification. Sabra does not currently have a fixed schedule of the number of acquisitions it will make over a particular time period, but instead Sabra will pursue those acquisitions that meet its investing and financing strategy and that are attractively priced. Sabra also intends to further develop its relationships with tenants and healthcare providers with a goal to progressively expand the mixture of tenants managing and operating its properties.
Growth Opportunities
Sabra expects to continue to grow its portfolio through the acquisition of healthcare facilities, including skilled nursing, senior housing facilities (which may include assisted living, independent living and continuing care retirement community facilities) and hospitals. As Sabra acquires additional properties and expands its portfolio, it expects to further diversify by geography, asset class and tenant within the healthcare sector. Over time, Sabra expects to pursue the acquisition of other healthcare property types, such as medical office buildings and life sciences facilities (commercial facilities that are primarily focused on life sciences research, development or commercialization, including properties that house biomedical and medical device companies). Sabra employs a disciplined, opportunistic approach in its healthcare real estate investment strategy by investing in assets that provide the best opportunity for dividend growth and appreciation of asset values, while maintaining balance sheet strength and liquidity, thereby creating long-term stockholder value.
Market Facts (as of September 30, 2011) | Portfolio Information (as of September 30, 2011) | |||
Stock Information | Investments | |||
Closing Price: | $9.54 | Equity Investments | ||
52-week range: | $9.40 - $19.31 | SNF | 74 | |
Market Capitalization: | $351.7 million | Multi-License | 10 | |
Enterprise Value: | $679.5 million | ALF/ILF | 6 | |
Outstanding Shares: | 36.9 million | Mental Health | 2 | |
Ticker symbol: | SBRA | CCRC | 1 | |
Stock Exchange: | NASDAQ | Acute Care Hospital | 1 | |
Credit Ratings | 94 | |||
Moody's: | B2 (stable) | Debt Investments | 1 | |
S&P: | Total Investments | 95 | ||
Corporate Rating | B+ (stable) | |||
Senior Notes Rating | BB- | Bed/Unit Count | ||
SNF | 9,393 | |||
ALF | 912 | |||
ILF | 82 | |||
Mental Health | 121 | |||
Acute Care Hospital | 70 | |||
Total Beds/Units | 10,578 | |||
| See reporting definitions. | 2 |
SABRA HEALTH CARE REIT, INC.
FINANCIAL HIGHLIGHTS
(dollars in thousands, except per share data)
Three Months Ended September 30, 2011 | Nine Months Ended September 30, 2011 | |||||
Revenues | $ | 21,470 | $ | 57,876 | ||
EBITDA | $ | 16,818 | $ | 47,631 | ||
Net income | $ | 2,344 | $ | 5,678 | ||
FFO | $ | 9,194 | $ | 24,905 | ||
AFFO | $ | 12,529 | $ | 31,895 | ||
Normalized AFFO | $ | 12,529 | $ | 32,205 | ||
Per share data: | ||||||
Diluted EPS | $ | 0.07 | $ | 0.20 | ||
Diluted FFO | $ | 0.28 | $ | 0.89 | ||
Diluted AFFO | $ | 0.38 | $ | 1.13 | ||
Diluted Normalized AFFO | $ | 0.38 | $ | 1.14 | ||
Weighted-average number of common shares outstanding, diluted: | ||||||
EPS & FFO | 33,049,621 | 27,891,690 | ||||
AFFO & Normalized AFFO | 33,320,262 | 28,142,867 | ||||
Net cash flow from operations | $ | 16,581 | $ | 34,509 | ||
September 30, 2011 | December 31, 2010 | |||||
Real Estate Portfolio | ||||||
Total Equity Investments (#) | 94 | 86 | ||||
Total Equity Investments ($) | $ | 756,899 | $ | 570,768 | ||
Total Licensed Beds/Units | 10,578 | 9,603 | ||||
Weighted Average Remaining Lease Term (in months) | 146 | 136 | ||||
Total Debt Investments (#) | 1 | — | ||||
Total Debt Investment ($) | $ | 5,348 | $ | — | ||
Three Months Ended September 30, 2011 | Twelve Months Ended September 30, 2011 | |||||
Facility EBITDARM Coverage (1) | 2.07x | 2.08x | ||||
Facility EBITDAR Coverage (1) | 1.59x | 1.61x | ||||
Tenant EBITDAR Coverage (1) | 1.82x | 1.83x | ||||
September 30, 2011 | December 31, 2010 | |||||
Debt | ||||||
Principal | ||||||
Fixed Rate Debt | $ | 324,724 | $ | 326,125 | ||
Variable Rate Debt | 59,456 | 60,315 | ||||
Total Debt | 384,180 | 386,440 | ||||
Rate | ||||||
Fixed Rate Debt | 7.57 | % | 7.56 | % | ||
Variable Rate Debt | 5.50 | % | 5.50 | % | ||
Total Debt | 7.25 | % | 7.24 | % | ||
% of Total | ||||||
Fixed Rate Debt | 84.5 | % | 84.4 | % | ||
Variable Rate Debt | 15.5 | % | 15.6 | % | ||
Total Debt | 100.0 | % | 100.0 | % | ||
Availability Under Credit Facility: | $ | 100,000 | $ | 87,600 | ||
Available Liquidity (Unrestricted Cash and Availability Under Credit Facility) | $ | 156,417 | $ | 161,833 | ||
(1) Facility EBITDARM, Facility EBITDAR and Tenant EBITDAR information for the Aurora Portfolio are not included in the information presented because the Aurora Portfolio was not acquired until the end of the period presented.
| See reporting definitions. | 3 |
SABRA HEALTH CARE REIT, INC.
2011 OUTLOOK
Low | High | ||||||
Net income | $ | 0.36 | $ | 0.39 | |||
Add: | |||||||
Depreciation and amortization of real estate assets | 0.88 | 0.88 | |||||
Funds from Operations (FFO) | $ | 1.24 | $ | 1.27 | |||
Acquisition pursuit costs | 0.10 | 0.10 | |||||
Stock-based compensation expense | 0.13 | 0.13 | |||||
Straight-line rental income adjustments | (0.06 | ) | (0.06 | ) | |||
Amortization of deferred financing costs | 0.07 | 0.07 | |||||
Adjusted Funds from Operations (AFFO) | $ | 1.48 | $ | 1.51 | |||
Start-up costs | 0.01 | 0.01 | |||||
Normalized AFFO | $ | 1.49 | $ | 1.52 | |||
Except as otherwise noted above, the foregoing projections reflect management's view of current and future market conditions, including assumptions with respect to the earnings impact of the events referenced in this supplement, as of the date of this supplement. These estimates do not reflect the potential impact of future acquisitions or the impact on the Company's stock based compensation for changes in the price of the Company's common stock. There can be no assurance that the Company's actual results will not differ materially from the estimates set forth above. Except as otherwise required by law, the Company assumes no, and hereby disclaims any, obligation to update any of the foregoing projections as a result of new information or new or future developments.
| See reporting definitions. | 4 |
SABRA HEALTH CARE REIT, INC.
CONSOLIDATED STATEMENTS OF INCOME
(in thousands, except share and per share data)
Three Months Ended September 30, 2011 | Nine Months Ended September 30, 2011 | |||||
Revenues: | ||||||
Rental income | $ | 21,294 | $ | 57,483 | ||
Interest income | 176 | 393 | ||||
Total revenues | 21,470 | 57,876 | ||||
Expenses: | ||||||
Depreciation and amortization | 6,850 | 19,227 | ||||
Interest | 7,624 | 22,726 | ||||
General and administrative | 4,652 | 10,245 | ||||
Total expenses | 19,126 | 52,198 | ||||
Net income | $ | 2,344 | $ | 5,678 | ||
Net income per common share, basic | $ | 0.07 | $ | 0.20 | ||
Net income per common share, diluted | $ | 0.07 | $ | 0.20 | ||
Weighted-average number of common shares outstanding, basic | 32,986,657 | 27,797,411 | ||||
Weighted-average number of common shares outstanding, diluted | 33,049,621 | 27,891,690 | ||||
Dividends per common share | $ | 0.32 | $ | 0.64 | ||
| See reporting definitions. | 5 |
SABRA HEALTH CARE REIT, INC.
CONSOLIDATED BALANCE SHEETS
(in thousands, except share and per share data)
September 30, 2011 | December 31, 2010 | ||||||
Assets | |||||||
Real estate investments, net of accumulated depreciation of $107,887 and $88,701 as of September 30, 2011 and December 31, 2010, respectively | $ | 649,251 | $ | 482,297 | |||
Cash and cash equivalents | 56,417 | 74,233 | |||||
Restricted cash | 6,286 | 4,716 | |||||
Deferred tax assets | 26,300 | 26,300 | |||||
Prepaid expenses, deferred financing costs and other assets | 19,791 | 12,013 | |||||
Total assets | $ | 758,045 | $ | 599,559 | |||
Liabilities and stockholders’ equity | |||||||
Mortgage notes payable | $ | 159,180 | $ | 161,440 | |||
Senior unsecured notes payable | 225,000 | 225,000 | |||||
Accounts payable and accrued liabilities | 17,641 | 9,286 | |||||
Tax liability | 26,300 | 26,300 | |||||
Total liabilities | 428,121 | 422,026 | |||||
Stockholders’ equity: | |||||||
Preferred stock, $.01 par value; 10,000,000 shares authorized, zero shares issued and outstanding as of September 30, 2011 and December 31, 2010 | — | — | |||||
Common stock, $.01 par value; 125,000,000 shares authorized, 36,868,248 and 25,061,072 shares issued and outstanding as of September 30, 2011 and December 31, 2010, respectively | 369 | 251 | |||||
Additional paid-in capital | 343,748 | 177,275 | |||||
Cumulative distributions in excess of net income | (14,193 | ) | 7 | ||||
Total stockholders’ equity | 329,924 | 177,533 | |||||
Total liabilities and stockholders’ equity | $ | 758,045 | $ | 599,559 | |||
| See reporting definitions. | 6 |
SABRA HEALTH CARE REIT, INC.
CONSOLIDATED STATEMENT OF CASH FLOWS
(in thousands)
Nine Months Ended September 30, 2011 | |||
Cash flows from operating activities: | |||
Net income | $ | 5,678 | |
Adjustments to reconcile net income to net cash provided by operating activities: | |||
Depreciation and amortization | 19,227 | ||
Amortization of deferred financing costs | 1,507 | ||
Stock-based compensation expense | 3,249 | ||
Amortization of premium on notes payable | (11 | ) | |
Straight-line rental income adjustments | (720 | ) | |
Changes in operating assets and liabilities: | |||
Prepaid expenses and other assets | 556 | ||
Accounts payable and accrued liabilities | 7,860 | ||
Restricted cash | (2,837 | ) | |
Net cash provided by operating activities | 34,509 | ||
Cash flows from investing activities: | |||
Acquisitions of real estate | (187,700 | ) | |
Acquisition of note receivable | (5,348 | ) | |
Additions to real estate | (86 | ) | |
Net cash used in investing activities | (193,134 | ) | |
Cash flows from financing activities: | |||
Principal payments on mortgage notes payable | (2,249 | ) | |
Payments of deferred financing costs | (495 | ) | |
Issuance of common stock | 163,431 | ||
Dividends paid | (19,878 | ) | |
Net cash provided by financing activities | 140,809 | ||
Net decrease in cash and cash equivalents | (17,816 | ) | |
Cash and cash equivalents, beginning of period | 74,233 | ||
Cash and cash equivalents, end of period | $ | 56,417 | |
Supplemental disclosure of cash flow information: | |||
Interest paid | $ | 17,024 | |
| See reporting definitions. | 7 |
SABRA HEALTH CARE REIT, INC.
RECONCILIATIONS OF NET INCOME TO EBITDA, FUNDS FROM OPERATIONS (FFO),
ADJUSTED FUNDS FROM OPERATIONS (AFFO) AND NORMALIZED AFFO
(in thousands, except share and per share data)
Three Months Ended September 30, 2011 | Nine Months Ended September 30, 2011 | |||||
Net income | $ | 2,344 | $ | 5,678 | ||
Interest expense | 7,624 | 22,726 | ||||
Depreciation and amortization | 6,850 | 19,227 | ||||
EBITDA | $ | 16,818 | $ | 47,631 | ||
Net income | $ | 2,344 | $ | 5,678 | ||
Add: | ||||||
Depreciation of real estate assets | 6,850 | 19,227 | ||||
Funds from Operations (FFO) | $ | 9,194 | $ | 24,905 | ||
Acquisition pursuit costs | 2,643 | 2,954 | ||||
Stock-based compensation expense | 771 | 3,249 | ||||
Straight-line rental income adjustments | (591 | ) | (720 | ) | ||
Amortization of deferred financing costs | 512 | 1,507 | ||||
Adjusted Funds from Operations (AFFO) | $ | 12,529 | $ | 31,895 | ||
Start-up costs | — | 310 | ||||
Normalized AFFO | $ | 12,529 | $ | 32,205 | ||
Net income per diluted common share | $ | 0.07 | $ | 0.20 | ||
FFO per diluted common share | $ | 0.28 | $ | 0.89 | ||
AFFO per diluted common share | $ | 0.38 | $ | 1.13 | ||
Normalized AFFO per diluted common share | $ | 0.38 | $ | 1.14 | ||
Weighted average number of common shares outstanding, diluted | ||||||
Net income and FFO | 33,049,621 | 27,891,690 | ||||
AFFO and Normalized AFFO | 33,320,262 | 28,142,867 | ||||
| See reporting definitions. | 8 |
SABRA HEALTH CARE REIT, INC.
CAPITALIZATION
(in thousands, except share and per share amounts)
Debt | September 30, 2011 | December 31, 2010 | |||||
Secured mortgage debt | $ | 159,180 | $ | 161,440 | |||
Senior unsecured notes | 225,000 | 225,000 | |||||
Revolving line of credit | — | — | |||||
Total debt | $ | 384,180 | $ | 386,440 | |||
Book capitalization(1) | |||||||
Total debt | $ | 384,180 | $ | 386,440 | |||
Total equity | 329,924 | 177,533 | |||||
Book capitalization | 714,104 | 563,973 | |||||
Accumulated depreciation and amortization | 107,887 | 88,701 | |||||
Undepreciated book capitalization | $ | 821,991 | $ | 652,674 | |||
Enterprise Value | ||||||||||
As of September 30, 2011 | Shares Outstanding | Price | Value | |||||||
Common stock | 36,868,248 | $ | 9.54 | $ | 351,723 | |||||
Total debt | 384,180 | |||||||||
Cash and cash equivalents | (56,417 | ) | ||||||||
Total enterprise value | $ | 679,486 | ||||||||
As of December 31, 2010 | Shares Outstanding | Price | Value | |||||||
Common stock | 25,061,062 | $ | 18.40 | $ | 461,124 | |||||
Total debt | 386,440 | |||||||||
Cash and cash equivalents | (74,233 | ) | ||||||||
Total enterprise value | $ | 773,331 | ||||||||
Common Stock and Equivalents | ||||||||||||
Weighted Avg. Common Shares | ||||||||||||
Three Months Ended September 30, 2011 | Nine Months Ended September 30, 2011 | |||||||||||
EPS & FFO | AFFO & Normalized AFFO | EPS & FFO | AFFO & Normalized AFFO | |||||||||
Common stock | 32,915,748 | 32,915,748 | 27,729,213 | 27,729,213 | ||||||||
Common equivalents | 70,909 | 70,909 | 68,198 | 68,198 | ||||||||
Basic common and common equivalents | 32,986,657 | 32,986,657 | 27,797,411 | 27,797,411 | ||||||||
Dilutive securities: | ||||||||||||
Restricted stock and units | 62,209 | 332,850 | 81,673 | 332,850 | ||||||||
Options | 755 | 755 | 12,606 | 12,606 | ||||||||
Diluted common and common equivalents | 33,049,621 | 33,320,262 | 27,891,690 | 28,142,867 | ||||||||
(1) | Book capitalization is based on the historical carrying value of Sabra’s real estate investments as previously reported by Old Sun (as discussed in the Company Profile section of this supplement). Therefore, total equity does not reflect any fair market value adjustment for Sabra’s real estate investments as of November 15, 2010 (the Separation Date), and accumulated depreciation and amortization are for the period from the date of acquisition of the assets by Old Sun to September 30, 2011. |
| See reporting definitions. | 9 |
SABRA HEALTH CARE REIT, INC.
INDEBTEDNESS
September 30, 2011
(dollars in thousands)
Principal | Weighted Average Rate | % of Total | |||||||
Fixed rate debt | |||||||||
Secured mortgage debt (1) | $ | 99,724 | 6.30 | % | 26.0 | % | |||
Unsecured senior notes | 225,000 | 8.13 | % | 58.5 | % | ||||
Total fixed rate debt | 324,724 | 7.57 | % | 84.5 | % | ||||
Variable rate debt | |||||||||
Secured mortgage debt(2) | 59,456 | 5.50 | % | 15.5 | % | ||||
Revolving line of credit | — | 5.75 | % | — | % | ||||
Total variable rate debt | 59,456 | 5.50 | % | 15.5 | % | ||||
Total debt | $ | 384,180 | 7.25 | % | 100.0 | % | |||
Secured debt | |||||||||
Secured mortgage debt | $ | 159,180 | 6.00 | % | 41.4 | % | |||
Revolving line of credit | — | 5.75 | % | — | % | ||||
Total secured debt | 159,180 | 6.00 | % | 41.4 | % | ||||
Unsecured debt | |||||||||
Unsecured senior notes | 225,000 | 8.13 | % | 58.6 | % | ||||
Total unsecured debt | 225,000 | 8.13 | % | 58.6 | % | ||||
Total debt | $ | 384,180 | 7.25 | % | 100.0 | % | |||
(1) | Fixed rate secured mortgage debt includes $31.6 million which converts to a variable interest rate based on 90-day LIBOR plus 4.5% (1.00% floor) effective January 2014. This debt matures in August 2015. Fixed rate secured mortgage debt includes $0.5 million of mortgage premium. |
(2) | Variable rate secured mortgage debt interest is based on 90-day LIBOR plus 4.5% (1.00% floor). |
Maturities | ||||||||||||||||||||||||||
Secured Mortgage Debt | Unsecured Senior Notes | Revolving Line of Credit | Total | |||||||||||||||||||||||
Principal | Rate | Principal | Rate | Principal | Rate | Principal | Rate | |||||||||||||||||||
October 1 through December 31, 2011 | $ | 779 | 6.04 | % | $ | — | — | $ | — | — | $ | 779 | 6.04 | % | ||||||||||||
2012 | 3,204 | 6.06 | % | — | — | — | — | 3,204 | 6.06 | % | ||||||||||||||||
2013 | 3,427 | 6.04 | % | — | — | — | — | 3,427 | 6.04 | % | ||||||||||||||||
2014 | 3,649 | 6.04 | % | — | — | — | — | 3,649 | 6.04 | % | ||||||||||||||||
2015 | 86,048 | 6.02 | % | — | — | — | — | 86,048 | 6.02 | % | ||||||||||||||||
2016 | 1,689 | 5.99 | % | — | — | — | — | 1,689 | 5.99 | % | ||||||||||||||||
2017 | 1,809 | 5.97 | % | — | — | — | — | 1,809 | 5.97 | % | ||||||||||||||||
2018 | 1,937 | 5.94 | % | 225,000 | 8.13 | % | — | — | 226,937 | 8.11 | % | |||||||||||||||
2019 | 2,075 | 5.90 | % | — | — | — | — | 2,075 | 5.90 | % | ||||||||||||||||
2020 | 2,222 | 5.86 | % | — | — | — | — | 2,222 | 5.86 | % | ||||||||||||||||
Thereafter | 51,837 | 5.56 | % | — | — | — | — | 51,837 | 5.56 | % | ||||||||||||||||
158,676 | 225,000 | — | 383,676 | |||||||||||||||||||||||
Mortgage premium | 504 | — | — | 504 | ||||||||||||||||||||||
Total debt | $ | 159,180 | $ | 225,000 | $ | — | $ | 384,180 | ||||||||||||||||||
Weighted average maturity in years | 11.9 | 7.1 | 2.1 | 9.1 | ||||||||||||||||||||||
Weighted average interest rate | 6.00 | % | 8.13 | % | 5.75 | % | 7.25 | % | ||||||||||||||||||
| See reporting definitions. | 10 |
SABRA HEALTH CARE REIT, INC.
DEBT COVENANTS
(dollars in millions)
September 30, 2011 | December 31, 2010 | |||||||||||||
Minimum | Maximum | Actual | Actual | |||||||||||
Credit Facility: | ||||||||||||||
Consolidated Leverage Ratio | 6.25x | 4.45x | 5.95x | |||||||||||
Consolidated Fixed Charge Coverage Ratio | 1.75x | 2.76x | 2.10x | |||||||||||
Consolidated Tangible Net Worth | $ | 162.0 | $ | 427.9 | $ | 255.2 | ||||||||
Unsecured Senior Notes: | ||||||||||||||
Total Debt/ Asset Value | 60 | % | 39 | % | 48 | % | ||||||||
Secured Debt/ Asset Value | 40 | % | 16 | % | 20 | % | ||||||||
Unencumbered Assets/ Unsecured Debt | 150 | % | 227 | % | 162 | % | ||||||||
Minimum Interest Coverage | 2.00x | 3.11x | 2.24x | |||||||||||
Note: All covenants are based on terms defined in the related credit agreement and unsecured senior notes indenture. Asset Value and Unencumbered Assets used for debt covenant calculation purposes include a value for the initial real estate portfolio obtained in the separation from New Sun, which is calculated by dividing the total initial annual rental revenue from this portfolio by an assumed 9.75% capitalization rate. This results in an assumed total portfolio value for the initial real estate portfolio of $720 million.
| See reporting definitions. | 11 |
SABRA HEALTH CARE REIT, INC.
PORTFOLIO SUMMARY
September 30, 2011
(dollars in thousands)
Rental Income | Occupancy Percentage | |||||||||||||||||||||||||
Facility Type | Number of Properties | Investment | Average Facility Age (Years) | Three Months Ended September 30, 2011 | Nine Months Ended September 30, 2011 | Number of Licensed Beds/Units | Three Months Ended September 30, 2011 | Nine Months Ended September 30, 2011 | ||||||||||||||||||
Skilled Nursing (1) | 74 | $ | 573,465 | 16.6 | $ | 15,870 | $ | 43,447 | 8,406 | 87.1 | % | 87.5 | % | |||||||||||||
Multi-License Designation | 10 | 81,245 | 25.8 | 2,728 | 8,183 | 1,389 | 88.8 | % | 89.2 | % | ||||||||||||||||
Assisted Living | 5 | 24,094 | 18.5 | 487 | 1,460 | 367 | 91.7 | % | 89.5 | % | ||||||||||||||||
Mental Health | 2 | 998 | 37.1 | 103 | 308 | 82 | 87.3 | % | 87.6 | % | ||||||||||||||||
Independent Living | 1 | 8,022 | 25.8 | 72 | 216 | 49 | 93.9 | % | 96.6 | % | ||||||||||||||||
CCRC | 1 | 7,435 | 1.7 | 386 | 1,157 | 215 | 79.6 | % | 81.9 | % | ||||||||||||||||
Acute Care Hospital | 1 | 61,640 | 2.7 | 1,648 | 2,712 | 70 | 68.3 | % | 73.6 | % | ||||||||||||||||
Total | 94 | $ | 756,899 | 16.5 | $ | 21,294 | $ | 57,483 | 10,578 | 87.2 | % | 87.6 | % | |||||||||||||
Three Months Ended September 30, 2011 | Twelve Months Ended September 30, 2011 | |||||||||||
Facility Type | Facility EBITDARM Coverage | Facility EBITDAR Coverage | Tenant EBITDAR Coverage | Facility EBITDARM Coverage | Facility EBITDAR Coverage | Tenant EBITDAR Coverage | ||||||
Skilled Nursing (1) | 1.97x | 1.45x | 1.73x | 1.97x | 1.46x | 1.73x | ||||||
Multi-License Designation | 2.08x | 1.61x | 1.74x | 2.07x | 1.60x | 1.74x | ||||||
Assisted Living | 1.95x | 1.57x | 1.74x | 1.92x | 1.55x | 1.74x | ||||||
Mental Health | 4.93x | 3.89x | 1.74x | 3.92x | 2.91x | 1.74x | ||||||
Independent Living | 1.80x | 1.55x | 1.74x | 1.69x | 1.44x | 1.74x | ||||||
CCRC | 1.50x | 1.22x | 1.74x | 1.75x | 1.47x | 1.74x | ||||||
Acute Care Hospital | 3.15x | 3.08x | 3.08x | 3.27x | 3.17x | 3.17x | ||||||
Total | 2.07x | 1.59x | 1.82x | 2.08x | 1.61x | 1.83x | ||||||
(1) Occupancy percentage, Facility EBITDARM, Facility EBITDAR and Tenant EBITDAR information for the Aurora Portfolio are not included in the information presented because the Aurora Portfolio was not acquired until the end of the period presented.
| See reporting definitions. | 12 |
SABRA HEALTH CARE REIT, INC.
INVESTMENT ACTIVITY
Inception to September 30, 2011
(dollars in thousands)
Real Estate Investments | |||||||||||||
Acquisition Date | Facility Type | Beds | Investment Amount | Initial Cash Yield | |||||||||
Texas Regional Medical Center at Sunnyvale | 05/03/11 | Acute Care Hospital | 70 | $ | 62,700 | 9.25 | % | ||||||
Oak Brook Health Care Center | 06/30/11 | Skilled Nursing Facility | 120 | 11,300 | 9.50 | % | |||||||
Cadia Portfolio | |||||||||||||
Broadmeadow Healthcare | 08/30/11 | Skilled Nursing Facility | 120 | 23,800 | 8.75 | % | |||||||
Capitol Healthcare | 08/30/11 | Skilled Nursing Facility | 120 | 20,800 | 8.75 | % | |||||||
Pike Creek Healthcare | 08/30/11 | Skilled Nursing Facility | 130 | 28,200 | 8.75 | % | |||||||
Renaissance Healthcare | 08/30/11 | Skilled Nursing Facility | 130 | 24,700 | 8.75 | % | |||||||
500 | 97,500 | 8.75 | % | ||||||||||
Aurora Portfolio | |||||||||||||
Honey Hill Care Center | 09/30/11 | Skilled Nursing Facility | 150 | 8,000 | 10.61 | % | |||||||
Manokin Manor Nursing & Rehabilitation Center | 09/30/11 | Skilled Nursing Facility | 135 | 10,000 | 10.61 | % | |||||||
285 | 18,000 | 10.61 | % | ||||||||||
Total real estate investments | 975 | $ | 189,500 | 9.14 | % | ||||||||
Debt Investments | |||||||||||||
Hillside Terrace Mortgage Note | 03/25/11 | 5,348 | 12.17 | % | |||||||||
Total Investments | $ | 194,848 | 9.22 | % | |||||||||
Annualized Revenue Concentration by Tenant
As of December 31, 2010 | As of September 30, 2011 |
| See reporting definitions. | 13 |
SABRA HEALTH CARE REIT, INC.
PORTFOLIO GEOGRAPHIC CONCENTRATIONS - PROPERTY TYPE
September 30, 2011
State | Skilled Nursing | Multi-License Designation | Assisted Living | Mental Health | Independent Living | CCRC | Acute Care Hospital | Total | % of Total | |||||||||||||||||
Kentucky | 11 | 2 | 2 | — | — | — | — | 15 | 16.0 | % | ||||||||||||||||
New Hampshire | 8 | 5 | 2 | — | — | — | — | 15 | 16.0 | |||||||||||||||||
Connecticut | 9 | 1 | — | — | 1 | — | — | 11 | 11.7 | |||||||||||||||||
Ohio | 8 | — | — | — | — | — | — | 8 | 8.5 | |||||||||||||||||
Florida | 5 | — | — | — | — | — | — | 5 | 5.3 | |||||||||||||||||
Oklahoma | 3 | 1 | — | 1 | — | — | — | 5 | 5.3 | |||||||||||||||||
Montana | 4 | — | — | — | — | — | — | 4 | 4.2 | |||||||||||||||||
Delaware | 4 | — | — | — | — | — | — | 4 | 4.2 | |||||||||||||||||
California | 3 | — | — | — | — | — | — | 3 | 3.2 | |||||||||||||||||
Idaho | 1 | 1 | — | 1 | — | — | — | 3 | 3.2 | |||||||||||||||||
Massachusetts | 3 | — | — | — | — | — | — | 3 | 3.2 | |||||||||||||||||
New Mexico | 2 | — | — | — | — | 1 | — | 3 | 3.2 | |||||||||||||||||
Colorado | 2 | — | — | — | — | — | — | 2 | 2.1 | |||||||||||||||||
Georgia | 2 | — | — | — | — | — | — | 2 | 2.1 | |||||||||||||||||
Rhode Island | 2 | — | — | — | — | — | — | 2 | 2.1 | |||||||||||||||||
West Virginia | 2 | — | — | — | — | — | — | 2 | 2.1 | |||||||||||||||||
Texas | 1 | — | — | — | — | — | 1 | 2 | 2.1 | |||||||||||||||||
Indiana | 1 | — | — | — | — | — | — | 1 | 1.1 | |||||||||||||||||
North Carolina | 1 | — | — | — | — | — | — | 1 | 1.1 | |||||||||||||||||
Maryland | 1 | — | — | — | — | — | — | 1 | 1.1 | |||||||||||||||||
Tennessee | 1 | — | — | — | — | — | — | 1 | 1.1 | |||||||||||||||||
Washington | — | — | 1 | — | — | — | — | 1 | 1.1 | |||||||||||||||||
Total | 74 | 10 | 5 | 2 | 1 | 1 | 1 | 94 | 100.0 | % | ||||||||||||||||
| See reporting definitions. | 14 |
SABRA HEALTH CARE REIT, INC.
PORTFOLIO GEOGRAPHIC CONCENTRATIONS - DISTRIBUTION OF LICENSED BEDS/UNITS
September 30, 2011
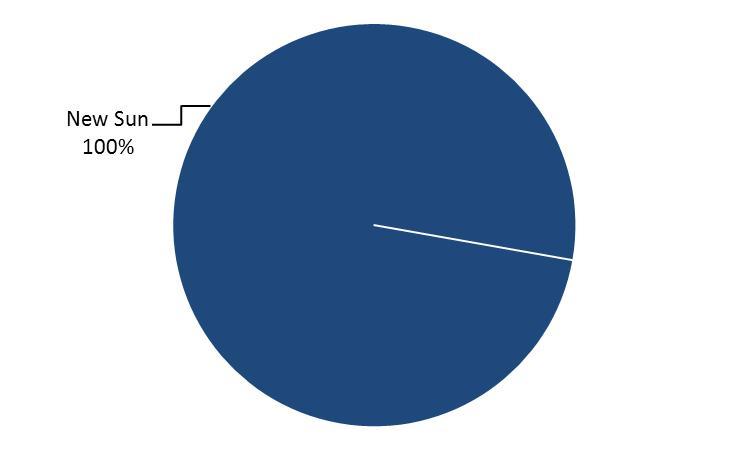
Tenant Revenue Concentration (Nine Months Ended September 30, 2011) | ||||
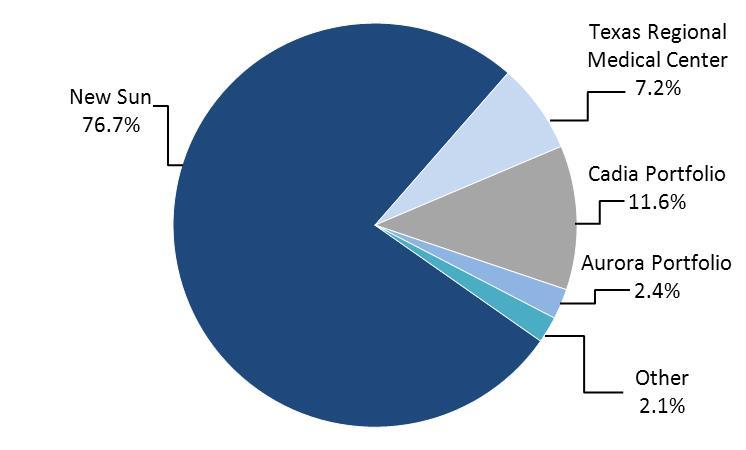
New Sun | 91.6 | % | ||
Texas Regional Medical Center | 4.7 | % | ||
Cadia Portfolio | 3.1 | % | ||
Oak Brook Health Care Center | 0.6 | % | ||
Aurora Portfolio | 0.0 | % | ||
Total | 100.0 | % | ||
Total Number of Properties | Bed Type | ||||||||||||||||||||||
State | Skilled Nursing | Assisted Living | Mental Health | Independent Living | Acute Care Hospital | Total | % of Total | ||||||||||||||||
Connecticut | 11 | 1,131 | 474 | — | — | — | 1,605 | 15.3 | % | ||||||||||||||
New Hampshire | 15 | 1,477 | 23 | — | 49 | — | 1,549 | 14.7 | |||||||||||||||
Kentucky | 15 | 976 | 172 | — | — | — | 1,148 | 11.0 | |||||||||||||||
Ohio | 8 | 954 | — | — | — | — | 954 | 9.0 | |||||||||||||||
Florida | 5 | 660 | — | — | — | — | 660 | 6.2 | |||||||||||||||
Oklahoma | 5 | 441 | 71 | 60 | 12 | — | 584 | 5.5 | |||||||||||||||
Montana | 4 | 538 | — | — | — | — | 538 | 5.1 | |||||||||||||||
Delaware | 4 | 500 | — | — | — | — | 500 | 4.7 | |||||||||||||||
New Mexico | 3 | 190 | 120 | — | 60 | — | 370 | 3.5 | |||||||||||||||
Colorado | 2 | 362 | — | — | — | — | 362 | 3.4 | |||||||||||||||
Georgia | 2 | 310 | — | — | — | — | 310 | 2.9 | |||||||||||||||
California | 3 | 301 | — | — | — | — | 301 | 2.8 | |||||||||||||||
Massachusetts | 3 | 301 | — | — | — | — | 301 | 2.8 | |||||||||||||||
Idaho | 3 | 229 | 16 | 22 | — | — | 267 | 2.5 | |||||||||||||||
Rhode Island | 2 | 261 | — | — | — | — | 261 | 2.5 | |||||||||||||||
Texas | 2 | 120 | — | — | — | 70 | 190 | 1.8 | |||||||||||||||
West Virginia | 2 | 185 | — | — | — | — | 185 | 1.7 | |||||||||||||||
Maryland | 1 | 135 | — | — | — | — | 135 | 1.3 | |||||||||||||||
Tennessee | 1 | 134 | — | — | — | — | 134 | 1.3 | |||||||||||||||
North Carolina | 1 | 100 | — | — | — | — | 100 | 0.9 | |||||||||||||||
Indiana | 1 | 88 | — | — | — | — | 88 | 0.8 | |||||||||||||||
Washington | 1 | — | 36 | — | — | — | 36 | 0.3 | |||||||||||||||
94 | 9,393 | 912 | 82 | 121 | 70 | 10,578 | 100.0 | % | |||||||||||||||
% of Total beds/units | 88.8 | % | 8.6 | % | 0.8 | % | 1.1 | % | 0.7 | % | 100.0 | % | |||||||||||
| See reporting definitions. | 15 |
SABRA HEALTH CARE REIT, INC.
PORTFOLIO GEOGRAPHIC CONCENTRATIONS - MULTI-LICENSE AND CCRC SUMMARY
September 30, 2011
Number of Licensed Beds/Units | |||||||||||||||||||||||||||
Total Number of Properties | Multi-License Designation | CCRC | |||||||||||||||||||||||||
State | Skilled Nursing | Assisted Living | Independent Living | Total | Skilled Nursing | Assisted Living | Independent Living | Total | |||||||||||||||||||
New Hampshire | 5 | 434 | 271 | — | 705 | — | — | — | — | ||||||||||||||||||
Kentucky | 2 | 95 | 44 | — | 139 | — | — | — | — | ||||||||||||||||||
Connecticut | 1 | 274 | 23 | — | 297 | — | — | — | — | ||||||||||||||||||
Oklahoma | 1 | — | 71 | 12 | 83 | — | — | — | — | ||||||||||||||||||
New Mexico | 1 | — | — | — | — | 35 | 120 | 60 | 215 | ||||||||||||||||||
Idaho | 1 | 149 | 16 | — | 165 | — | — | — | — | ||||||||||||||||||
Total | 11 | 952 | 425 | 12 | 1,389 | 35 | 120 | 60 | 215 | ||||||||||||||||||
% of Total Beds/Units | 68.5 | % | 30.6 | % | 0.9 | % | 100.0 | % | 16.3 | % | 55.8 | % | 27.9 | % | 100.0 | % | |||||||||||
| See reporting definitions. | 16 |
SABRA HEALTH CARE REIT, INC.
PORTFOLIO GEOGRAPHIC CONCENTRATIONS - INVESTMENT
September 30, 2011
(dollars in thousands)
State | Total Number of Centers | Skilled Nursing | Multi-License Designation | Assisted Living | Mental Health | Independent Living | CCRC | Acute Care Hospital | Total | % of Total | ||||||||||||||||||||||||||||
Connecticut | 11 | $ | 108,793 | $ | 21,878 | $ | — | $ | — | $ | 8,022 | $ | — | $ | — | $ | 138,693 | 18.3 | % | |||||||||||||||||||
Delaware | 4 | 95,780 | — | — | — | — | — | — | 95,780 | 12.7 | ||||||||||||||||||||||||||||
New Hampshire | 15 | 41,788 | 34,366 | 13,408 | — | — | — | — | 89,562 | 11.8 | ||||||||||||||||||||||||||||
Texas | 2 | 11,080 | — | — | — | — | — | 61,640 | 72,720 | 9.6 | ||||||||||||||||||||||||||||
Kentucky | 15 | 50,485 | 10,089 | 10,504 | — | — | — | — | 71,078 | 9.4 | ||||||||||||||||||||||||||||
Ohio | 8 | 44,017 | — | — | — | — | — | — | 44,017 | 5.8 | ||||||||||||||||||||||||||||
Montana | 4 | 42,948 | — | — | — | — | — | — | 42,948 | 5.7 | ||||||||||||||||||||||||||||
Florida | 5 | 32,073 | — | — | — | — | — | — | 32,073 | 4.2 | ||||||||||||||||||||||||||||
Oklahoma | 5 | 23,737 | 5,730 | — | 709 | — | — | — | 30,176 | 4.0 | ||||||||||||||||||||||||||||
Colorado | 2 | 29,052 | — | — | — | — | — | — | 29,052 | 3.8 | ||||||||||||||||||||||||||||
Rhode Island | 2 | 20,122 | — | — | — | — | — | — | 20,122 | 2.7 | ||||||||||||||||||||||||||||
New Mexico | 3 | 7,236 | — | — | — | — | 7,435 | — | 14,671 | 1.9 | ||||||||||||||||||||||||||||
West Virginia | 2 | 14,340 | — | — | — | — | — | — | 14,340 | 1.9 | ||||||||||||||||||||||||||||
Massachusetts | 3 | 13,235 | — | — | — | — | — | — | 13,235 | 1.7 | ||||||||||||||||||||||||||||
Idaho | 3 | 1,730 | 9,182 | — | 289 | — | — | — | 11,201 | 1.6 | ||||||||||||||||||||||||||||
Maryland | 1 | 9,780 | — | — | — | — | — | — | 9,780 | 1.3 | ||||||||||||||||||||||||||||
North Carolina | 1 | 9,759 | — | — | — | — | — | — | 9,759 | 1.3 | ||||||||||||||||||||||||||||
California | 3 | 4,636 | — | — | — | — | — | — | 4,636 | 0.6 | ||||||||||||||||||||||||||||
Tennessee | 1 | 4,535 | — | — | — | — | — | — | 4,535 | 0.6 | ||||||||||||||||||||||||||||
Indiana | 1 | 4,403 | — | — | — | — | — | — | 4,403 | 0.6 | ||||||||||||||||||||||||||||
Georgia | 2 | 3,936 | — | — | — | — | — | — | 3,936 | 0.5 | ||||||||||||||||||||||||||||
Washington | 1 | — | — | 182 | — | — | — | — | 182 | 0.0 | ||||||||||||||||||||||||||||
Total | 94 | $ | 573,465 | $ | 81,245 | $ | 24,094 | $ | 998 | $ | 8,022 | $ | 7,435 | $ | 61,640 | $ | 756,899 | 100.0 | % | |||||||||||||||||||
| See reporting definitions. | 17 |
SABRA HEALTH CARE REIT, INC.
PORTFOLIO GEOGRAPHIC CONCENTRATIONS - RENTAL INCOME
Three Months Ended September 30, 2011
(dollars in thousands)
State | Total Number of Centers | Skilled Nursing | Multi-License Designation | Assisted Living | Mental Health | Independent Living | CCRC | Acute Care Hospital | Total | % of Total | ||||||||||||||||||||||||||||
New Hampshire | 15 | $ | 1,638 | $ | 1,211 | $ | 327 | $ | — | $ | — | $ | — | $ | — | $ | 3,176 | 14.8 | % | |||||||||||||||||||
Connecticut | 11 | 2,164 | 426 | — | — | 72 | — | — | 2,662 | 12.5 | ||||||||||||||||||||||||||||
Kentucky | 15 | 1,953 | 353 | 116 | — | — | — | — | 2,422 | 11.4 | ||||||||||||||||||||||||||||
Texas | 2 | 322 | — | — | — | — | — | 1,648 | 1,970 | 9.3 | ||||||||||||||||||||||||||||
Florida | 5 | 1,919 | — | — | — | — | — | — | 1,919 | 9.0 | ||||||||||||||||||||||||||||
Delaware | 4 | 1,763 | — | — | — | — | — | — | 1,763 | 8.3 | ||||||||||||||||||||||||||||
Ohio | 8 | 1,281 | — | — | — | — | — | — | 1,281 | 6.0 | ||||||||||||||||||||||||||||
Montana | 4 | 1,272 | — | — | — | — | — | — | 1,272 | 6.0 | ||||||||||||||||||||||||||||
Colorado | 2 | 809 | — | — | — | — | — | — | 809 | 3.8 | ||||||||||||||||||||||||||||
Idaho | 3 | 25 | 610 | — | 70 | — | — | — | 705 | 3.3 | ||||||||||||||||||||||||||||
California | 3 | 679 | — | — | — | — | — | — | 679 | 3.2 | ||||||||||||||||||||||||||||
New Mexico | 3 | 227 | — | — | — | — | 386 | — | 613 | 2.9 | ||||||||||||||||||||||||||||
Oklahoma | 5 | 432 | 128 | — | 33 | — | — | — | 593 | 2.8 | ||||||||||||||||||||||||||||
West Virginia | 2 | 339 | — | — | — | — | — | — | 339 | 1.6 | ||||||||||||||||||||||||||||
North Carolina | 1 | 283 | — | — | — | — | — | — | 283 | 1.3 | ||||||||||||||||||||||||||||
Massachusetts | 3 | 262 | — | — | — | — | — | — | 262 | 1.2 | ||||||||||||||||||||||||||||
Rhode Island | 2 | 203 | — | — | — | — | — | — | 203 | 1.0 | ||||||||||||||||||||||||||||
Georgia | 2 | 153 | — | — | — | — | — | — | 153 | 0.7 | ||||||||||||||||||||||||||||
Tennessee | 1 | 92 | — | — | — | — | — | — | 92 | 0.4 | ||||||||||||||||||||||||||||
Indiana | 1 | 54 | — | — | — | — | — | — | 54 | 0.3 | ||||||||||||||||||||||||||||
Washington | 1 | — | — | 44 | — | — | — | — | 44 | 0.2 | ||||||||||||||||||||||||||||
Maryland | 1 | — | — | — | — | — | — | — | — | — | ||||||||||||||||||||||||||||
Total | 94 | $ | 15,870 | $ | 2,728 | $ | 487 | $ | 103 | $ | 72 | $ | 386 | $ | 1,648 | $ | 21,294 | 100.0 | % | |||||||||||||||||||
74.6 | % | 12.8 | % | 2.3 | % | 0.5 | % | 0.3 | % | 1.8 | % | 7.7 | % | 100.0 | % | |||||||||||||||||||||||
| See reporting definitions. | 18 |
SABRA HEALTH CARE REIT, INC.
PORTFOLIO GEOGRAPHIC CONCENTRATIONS - RENTAL INCOME
Nine Months Ended September 30, 2011
(dollars in thousands)
State | Total Number of Centers | Skilled Nursing | Multi-License Designation | Assisted Living | Mental Health | Independent Living | CCRC | Acute Care Hospital | Total | % of Total | ||||||||||||||||||||||||||||
New Hampshire | 15 | $ | 4,915 | $ | 3,632 | $ | 981 | $ | — | $ | — | $ | — | $ | — | $ | 9,528 | 16.5 | % | |||||||||||||||||||
Connecticut | 11 | 6,494 | 1,277 | — | — | 216 | — | — | 7,987 | 13.9 | ||||||||||||||||||||||||||||
Kentucky | 15 | 5,861 | 1,059 | 347 | — | — | — | — | 7,267 | 12.6 | ||||||||||||||||||||||||||||
Florida | 5 | 5,757 | — | — | — | — | — | — | 5,757 | 10.0 | ||||||||||||||||||||||||||||
Ohio | 8 | 3,842 | — | — | — | — | — | — | 3,842 | 6.7 | ||||||||||||||||||||||||||||
Montana | 4 | 3,816 | — | — | — | — | — | — | 3,816 | 6.6 | ||||||||||||||||||||||||||||
Texas | 2 | 324 | — | — | — | — | — | 2,712 | 3,036 | 5.3 | ||||||||||||||||||||||||||||
Colorado | 2 | 2,426 | — | — | — | — | — | — | 2,426 | 4.2 | ||||||||||||||||||||||||||||
Idaho | 3 | 75 | 1,831 | — | 210 | — | — | — | 2,116 | 3.7 | ||||||||||||||||||||||||||||
California | 3 | 2,036 | — | — | — | — | — | — | 2,036 | 3.5 | ||||||||||||||||||||||||||||
New Mexico | 3 | 682 | — | — | — | — | 1,157 | — | 1,839 | 3.2 | ||||||||||||||||||||||||||||
Oklahoma | 5 | 1,296 | 384 | — | 98 | — | — | — | 1,778 | 3.1 | ||||||||||||||||||||||||||||
Delaware | 4 | 1,763 | — | — | — | — | — | 1,763 | 3.1 | |||||||||||||||||||||||||||||
West Virginia | 2 | 1,018 | — | — | — | — | — | — | 1,018 | 1.8 | ||||||||||||||||||||||||||||
North Carolina | 1 | 850 | — | — | — | — | — | — | 850 | 1.5 | ||||||||||||||||||||||||||||
Massachusetts | 3 | 785 | — | — | — | — | — | — | 785 | 1.4 | ||||||||||||||||||||||||||||
Rhode Island | 2 | 610 | — | — | — | — | — | — | 610 | 1.1 | ||||||||||||||||||||||||||||
Georgia | 2 | 458 | — | — | — | — | — | — | 458 | 0.8 | ||||||||||||||||||||||||||||
Tennessee | 1 | 277 | — | — | — | — | — | — | 277 | 0.5 | ||||||||||||||||||||||||||||
Indiana | 1 | 162 | — | — | — | — | — | — | 162 | 0.3 | ||||||||||||||||||||||||||||
Washington | 1 | — | — | 132 | — | — | — | — | 132 | 0.2 | ||||||||||||||||||||||||||||
Maryland | 1 | — | — | — | — | — | — | — | — | — | ||||||||||||||||||||||||||||
Total | 94 | $ | 43,447 | $ | 8,183 | $ | 1,460 | $ | 308 | $ | 216 | $ | 1,157 | $ | 2,712 | $ | 57,483 | 100.0 | % | |||||||||||||||||||
75.7 | % | 14.2 | % | 2.5 | % | 0.5 | % | 0.4 | % | 2.0 | % | 4.7 | % | 100.0 | % | |||||||||||||||||||||||
| See reporting definitions. | 19 |
SABRA HEALTH CARE REIT, INC.
HISTORICAL SKILLED MIX AND OCCUPANCY PERCENTAGE
Skilled Mix | ||||||||||||||||||||
Three Months Ended September 30, 2011 | Three Months Ended September 30, 2010 | Nine Months Ended September 30, 2011 | Nine Months Ended September 30, 2010 | Twelve Months Ended September 30, 2011 | Year Ended December 31, | |||||||||||||||
2010 | 2009 | |||||||||||||||||||
Skilled Nursing (1) | 41.8 | % | 38.6 | % | 42.0 | % | 38.6 | % | 41.4 | % | 39.3 | % | 39.2 | % | ||||||
Occupancy Percentage | ||||||||||||||||||||
Three Months Ended September 30, 2011 | Three Months Ended September 30, 2010 | Nine Months Ended September 30, 2011 | Nine Months Ended September 30, 2010 | Twelve Months Ended September 30, 2011 | Year Ended December 31, | |||||||||||||||
2010 | 2009 | |||||||||||||||||||
Skilled Nursing (1) | 87.1 | % | 87.7 | % | 87.5 | % | 88.5 | % | 87.7 | % | 87.7 | % | 89.7 | % | ||||||
Multi-License Designation | 88.8 | % | 91.7 | % | 89.2 | % | 92.1 | % | 89.4 | % | 91.5 | % | 92.5 | % | ||||||
Assisted Living | 91.7 | % | 90.8 | % | 89.5 | % | 88.4 | % | 89.2 | % | 88.2 | % | 91.3 | % | ||||||
Mental Health | 87.3 | % | 86.4 | % | 87.6 | % | 81.8 | % | 87.4 | % | 83.9 | % | 81.5 | % | ||||||
Independent Living | 93.9 | % | 86.4 | % | 96.6 | % | 82.3 | % | 97.8 | % | 88.7 | % | 79.4 | % | ||||||
CCRC | 79.6 | % | 82.0 | % | 81.9 | % | 84.6 | % | 82.6 | % | 85.5 | % | 87.4 | % | ||||||
Acute Care Hospital | 68.3 | % | N/A | 73.6 | % | N/A | 71.1 | % | N/A | N/A | ||||||||||
Total | 87.2 | % | 88.2 | % | 87.6 | % | 88.8 | % | 87.8 | % | 88.2 | % | 90.0 | % | ||||||
(1) Skilled Mix and Occupancy Percentage for the Aurora Portfolio are not included in the information presented because the Aurora Portfolio was not acquired until the end of the period presented.
| See reporting definitions. | 20 |
SABRA HEALTH CARE REIT, INC.
PORTFOLIO LEASE EXPIRATIONS
September 30, 2011
(dollars in thousands)
2011 - 2019 | 2020 | 2021 | 2022 | 2023 | 2024 | 2025 | Thereafter | Total | |||||||||||||||||||||||||||
Skilled Nursing | |||||||||||||||||||||||||||||||||||
Properties | — | 26 | 26 | 10 | — | 1 | 4 | 7 | 74 | ||||||||||||||||||||||||||
Annualized Revenues | $ | — | $ | 21,155 | $ | 21,793 | $ | 6,633 | $ | — | $ | 1,776 | $ | 3,790 | $ | 14,088 | $ | 69,235 | |||||||||||||||||
Multi-License Designation | |||||||||||||||||||||||||||||||||||
Properties | — | 1 | 4 | 2 | — | — | 3 | — | 10 | ||||||||||||||||||||||||||
Annualized Revenues | — | 2,441 | 4,728 | 1,412 | — | — | 2,330 | — | 10,911 | ||||||||||||||||||||||||||
Assisted Living | |||||||||||||||||||||||||||||||||||
Properties | — | 1 | 1 | 2 | — | — | 1 | — | 5 | ||||||||||||||||||||||||||
Annualized Revenues | — | 176 | 625 | 463 | — | — | 683 | — | 1,947 | ||||||||||||||||||||||||||
Independent Living | |||||||||||||||||||||||||||||||||||
Properties | — | — | 1 | — | — | — | — | — | 1 | ||||||||||||||||||||||||||
Annualized Revenues | — | — | 287 | — | — | — | — | — | 287 | ||||||||||||||||||||||||||
Mental Health | |||||||||||||||||||||||||||||||||||
Properties | — | 2 | — | — | — | — | — | — | 2 | ||||||||||||||||||||||||||
Annualized Revenues | — | 410 | — | — | — | — | — | — | 410 | ||||||||||||||||||||||||||
CCRC | |||||||||||||||||||||||||||||||||||
Properties | — | 1 | — | — | — | — | — | — | 1 | ||||||||||||||||||||||||||
Annualized Revenues | — | 1,543 | — | — | — | — | — | — | 1,543 | ||||||||||||||||||||||||||
Acute Care Hospital | |||||||||||||||||||||||||||||||||||
Properties | — | — | — | — | — | — | — | 1 | 1 | ||||||||||||||||||||||||||
Annualized Revenues | — | — | — | — | — | — | — | 6,593 | 6,593 | ||||||||||||||||||||||||||
Total | |||||||||||||||||||||||||||||||||||
Properties | — | 31 | 32 | 14 | — | 1 | 8 | 8 | 94 | ||||||||||||||||||||||||||
Annualized Revenues | $ | — | $ | 25,725 | $ | 27,433 | $ | 8,508 | $ | — | $ | 1,776 | $ | 6,803 | $ | 20,681 | $ | 90,926 | |||||||||||||||||
% of Revenue | — | % | 28.3 | % | 30.2 | % | 9.4 | % | — | % | 2.0 | % | 7.5 | % | 22.6 | % | 100.0 | % | |||||||||||||||||
| See reporting definitions. | 21 |
SABRA HEALTH CARE REIT, INC.
RECENT ACQUISITION ACTIVITY
Aurora Portfolio
• Acquisition Date: | September 30, 2011 | ||||||
• Purchase Price: | $18.0 million | ||||||
• Investment Type: | Equity | ||||||
• Number of Properties: | 2 | Location | Available Beds | Facility Age (Years) | |||
Honey Hill Care Center | Norwalk, CT | 150 | 19 | ||||
Manokin Manor Nursing & Rehabilitation Center | Princess Anne, MD | 135 | 25 | ||||
285 | 22 | ||||||
• Property Type: | Skilled Nursing Facilities | ||||||
• Annualized GAAP Rental Income: | $2.2 million | ||||||
• Initial Cash Yield: | 10.61% | ||||||
| See reporting definitions. | 22 |
SABRA HEALTH CARE REIT, INC.
RECENT ACQUISITION ACTIVITY
Encore Portfolio
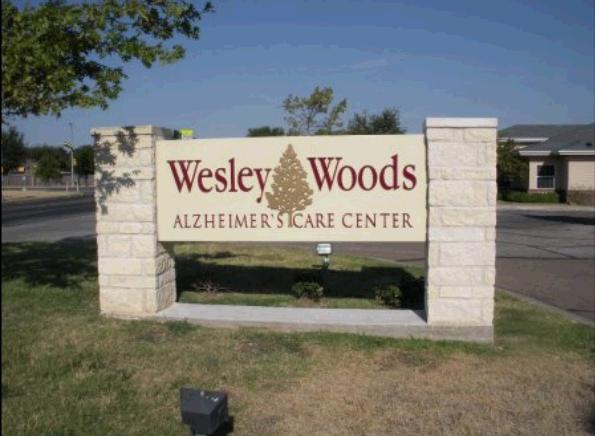

• Acquisition Date: | November 1, 2011 | ||||||
• Purchase Price: | $14.2 million | ||||||
• Investment Type: | Equity | ||||||
• Number of Properties: | 2 | Location | Available Beds | Facility Age (Years) | |||
Windcrest Alzheimer's Care Center | Abilene, TX | 120 | 12 | ||||
Wesley Woods Alzheimer's Care Center | Waco, TX | 120 | 7 | ||||
240 | 10 | ||||||
• Property Type: | Skilled Nursing Facilities | ||||||
• Annualized GAAP Rental Income: | $1.7 million | ||||||
• Initial Cash Yield: | 9.4% | ||||||
| See reporting definitions. | 23 |
SABRA HEALTH CARE REIT, INC.
RECENT ACQUISITION ACTIVITY - PRO FORMA INFORMATION
(dollars in thousands, except per share data)
Note: The following pro forma information assumes the acquisitions of Texas Regional Medical Center at Sunnyvale, Oak Brook Health Care Center, the Cadia Portfolio, the Aurora Portfolio, the Encore Portfolio and the Hillside Terrace Mortgage Note, as well as the offering of 11.7 million shares of common stock that closed in August 2011, were completed as of January 1, 2011.
Pro Forma Net Income, FFO, AFFO, and Normalized AFFO
Three Months Ended September 30, 2011 | Nine Months Ended September 30, 2011 | |||||
Net income | $ | 2,344 | $ | 5,678 | ||
Revenues - acquisitions | 1,853 | 12,105 | ||||
Depreciation and amortization - acquisitions (estimated) | (543 | ) | (3,192 | ) | ||
Acquisition pursuit costs (estimated) | (60 | ) | (60 | ) | ||
Pro forma net income | $ | 3,594 | $ | 14,531 | ||
Pro forma net income | $ | 3,594 | $ | 14,531 | ||
Add: | ||||||
Depreciation of real estate assets (estimated) | 7,393 | 22,419 | ||||
Pro forma FFO | $ | 10,987 | $ | 36,950 | ||
Straight-line rental income adjustments | (539 | ) | (2,909 | ) | ||
Acquisition pursuit costs (estimated) | 2,703 | 3,014 | ||||
Stock-based compensation expense | 771 | 3,249 | ||||
Amortization of deferred financing costs | 512 | 1,507 | ||||
Pro forma AFFO | $ | 14,434 | $ | 41,811 | ||
Start-up costs | — | 310 | ||||
Pro forma Normalized AFFO | $ | 14,434 | $ | 42,121 | ||
Pro forma net income per diluted common share | $ | 0.10 | $ | 0.39 | ||
Pro forma FFO per diluted common share | $ | 0.30 | $ | 1.00 | ||
Pro forma AFFO per diluted common share | $ | 0.39 | $ | 1.12 | ||
Pro forma Normalized AFFO per diluted common share | $ | 0.39 | $ | 1.13 | ||
Weighted average number of common shares outstanding, diluted | ||||||
Pro forma net income and FFO | 37,002,121 | 37,000,701 | ||||
Pro forma AFFO and Normalized AFFO | 37,272,762 | 37,251,878 | ||||
Pro Forma Debt Covenants
Minimum | Maximum | Pro Forma | |||
Credit Facility: | |||||
Consolidated Leverage Ratio | 6.25x | 4.36x | |||
Consolidated Fixed Charge Coverage Ratio | 1.75x | 2.81x | |||
Consolidated Tangible Net Worth | $162.0 | $427.9 | |||
Unsecured Senior Notes: | |||||
Total Debt/ Asset Value | 60% | 39% | |||
Secured Debt/ Asset Value | 40% | 16% | |||
Unencumbered Assets/ Unsecured Debt | 150% | 227% | |||
Minimum Interest Coverage | 2.00x | 3.11x | |||
| See reporting definitions. | 24 |
SABRA HEALTH CARE REIT, INC.
ACTIVITY AFTER SEPTEMBER 30, 2011 - PRO FORMA INFORMATION
Pro Forma Annualized Revenue by Tenant

Revenue Concentration by Tenant | Pro Forma Revenue Concentration by Tenant |
| See reporting definitions. | 25 |
SABRA HEALTH CARE REIT, INC.
REPORTING DEFINITIONS
Acute Care Hospital. A facility designed to provide extended medical and rehabilitation care for patients who are
clinically complex and have multiple acute or chronic conditions.
Annualized Revenues. The annual straight-line rental revenues under leases. Annualized Revenues do not include tenant recoveries or additional rents. The Company uses Annualized Revenues for the purpose of determining tenant concentrations and lease expirations.
Assisted Living Facility (“ALF”). A senior housing facility that predominantly consists of assisted living units is classified by the Company as an ALF.
Continuing Care Retirement Community (“CCRC”). A senior housing facility which provides at least three levels of care (i.e., independent living, assisted living and skilled nursing) is classified by the Company as a CCRC.
EBITDA. The real estate industry uses earnings before interest, taxes, depreciation and amortization (“EBITDA”), a non-GAAP financial measure, as a measure of both operating performance and liquidity. The Company uses EBITDA to measure both its operating performance and liquidity. By excluding interest expense, EBITDA allows investors to measure the Company’s operating performance independent of its capital structure and indebtedness and, therefore, allows for a more meaningful comparison of its operating performance between quarters as well as annual periods and to compare its operating performance to that of other companies, both in the real estate industry and in other industries. As a liquidity measure, the Company believes that EBITDA helps investors analyze the Company’s ability to meet its interest payments on outstanding debt. The Company believes investors should consider EBITDA in conjunction with net income (the primary measure of the Company’s performance) and the other required GAAP measures of its performance and liquidity, to improve their understanding of the Company’s operating results and liquidity, and to make more meaningful comparisons of its performance between periods and against other companies. EBITDA has limitations as an analytical tool and should be used in conjunction with the Company’s required GAAP presentations. EBITDA does not reflect the Company’s historical cash expenditures or future cash requirements for capital expenditures or contractual commitments. While EBITDA is a relevant and widely used measure of operating performance and liquidity, it does not represent net income or cash flow from operations as defined by GAAP and it should not be considered as an alternative to those indicators in evaluating operating performance or liquidity. Further, the Company’s computation of EBITDA may not be comparable to similar measures reported by other companies.
Enterprise Value. The Company believes Enterprise Value is an important measurement as it is a measure of a company’s value. We calculate Enterprise Value as market equity capitalization plus debt. Market equity capitalization is calculated as the number of shares of common stock multiplied by the closing price of our common stock on the last day of the period presented. Total Enterprise Value includes our market equity capitalization and consolidated debt, less cash and cash equivalents.
Facility Age. Facility age represents the age of the facility based on the date built or the date renovated (if applicable).
Facility EBITDAR(M). Earnings before interest, taxes, depreciation, amortization, rent (“EBITDAR”) and management fees ("EBITDARM") for a particular facility accruing to the operator/tenant of the property (not the Company), for the period presented. The Company uses Facility EBITDAR(M) in determining Facility EBITDAR(M) Coverages. Facility EBITDAR(M) has limitations as an analytical tool. Facility EBITDAR(M) does not reflect historical cash expenditures or future cash requirements for facility capital expenditures or contractual commitments. In addition, Facility EBITDAR(M) does not represent a property’s net income or cash flow from operations and should not be considered an alternative to those indicators. However, the Company receives periodic financial information from operators/tenants regarding the performance of the Company’s facilities under the operator’s/tenant’s management. The Company utilizes Facility EBITDAR(M) as a supplemental measure of the ability of those properties to generate sufficient liquidity to meet related obligations to the Company and EBITDARM in particular to evaluate the core operations of the properties by eliminating management fees, which vary based on operator/tenant and its operating structure. All facility financial performance data was derived solely from information provided by operators/tenants and borrowers without independent verification by the Company. All facility financial performance data are presented one month in arrears. The Company includes Facility EBITDAR(M) for a property if it was operated at any time during the period presented subject to a lease with the Company. Information related to the Aurora Portfolio is not included in the information presented because the Aurora Portfolio was not acquired until the end of the period presented.
Facility EBITDAR(M) Coverage. Facility EBITDAR(M) for the trailing 3 and 12 month periods prior to and including the period presented divided by the same period cash rent. Facility EBITDAR(M) coverage is a supplemental measure of a property’s ability to generate cash flows for the operator/tenant (not the Company) to meet the operator’s/tenant’s related cash rent and other obligations to the Company. However, its usefulness is limited by, among other things, the same factors that limit the usefulness of Facility EBITDAR(M). All facility financial performance data were derived solely from information provided by operators/tenants and borrowers without independent verification by the Company. All facility financial performance data are presented one month in arrears. Information related to the Aurora Portfolio is not included in the information presented because the Aurora Portfolio was not acquired until the end of the period presented.
| 26 | |
SABRA HEALTH CARE REIT, INC.
REPORTING DEFINITIONS
Funds From Operations (“FFO”) and Adjusted Funds from Operations (“AFFO”). The Company believes that net income as defined by GAAP is the most appropriate earnings measure. The Company also believes that Funds From Operations, or FFO, as defined by the National Association of Real Estate Investment Trusts (“NAREIT”) and Adjusted Funds from Operations or AFFO (and related per share amounts) are important non-GAAP supplemental measures of operating performance for a real estate investment trust. Because the historical cost accounting convention used for real estate assets requires straight-line depreciation (except on land), such accounting presentation implies that the value of real estate assets diminishes predictably over time. However, since real estate values have historically risen or fallen with market and other conditions, presentations of operating results for a real estate investment trust that use historical cost accounting for depreciation could be less informative. Thus, NAREIT created FFO as a supplemental measure of operating performance for real estate investment trusts that excludes historical cost depreciation and amortization, among other items, from net income, as defined by GAAP. FFO is defined as net income, computed in accordance with GAAP, excluding gains or losses from real estate dispositions, plus real estate depreciation and amortization. AFFO is defined as FFO excluding non-cash revenues (including straight-line rental income adjustments and amortization of acquired above/below market lease intangibles), non-cash expenses (including stock-based compensation expense and amortization of deferred financing costs) and acquisition pursuit costs. The Company believes that the use of FFO and AFFO (and the related per share amounts), combined with the required GAAP presentations, improves the understanding of operating results of real estate investment trusts among investors and makes comparisons of operating results among such companies more meaningful. The Company considers FFO and AFFO to be useful measures for reviewing comparative operating and financial performance because, by excluding gains or losses related to sales of previously depreciated operating real estate assets and real estate depreciation and amortization, and, for AFFO, by excluding non-cash revenues (including straight-line rental income adjustments and amortization of acquired above/below market lease intangibles), non-cash expenses (including stock-based compensation expense and amortization of deferred financing costs) and acquisition pursuit costs, FFO and AFFO can help investors compare the operating performance of the Company between periods or as compared to other companies. While FFO and AFFO are relevant and widely used measures of operating performance of real estate investment trusts, they do not represent cash flows from operations or net income as defined by GAAP and should not be considered an alternative to those measures in evaluating the Company’s liquidity or operating performance. FFO and AFFO also do not consider the costs associated with capital expenditures related to the Company’s real estate assets nor do they purport to be indicative of cash available to fund the Company’s future cash requirements. Further, the Company’s computation of FFO and AFFO may not be comparable to FFO and AFFO reported by other real estate investment trusts that do not define FFO in accordance with the current NAREIT definition or that interpret the current NAREIT definition or define AFFO differently from the Company.
Independent Living Facility (“ILF”). A senior housing facility that predominantly consists of independent living units.
Investment. Represents the carrying amount of real estate assets after adding back accumulated depreciation and amortization.
Licensed Beds/Units. Senior housing facilities are measured in units (e.g., studio, one or two bedroom units). Skilled nursing and mental health facilities are measured in licensed bed count. All facility financial performance data were derived solely from information provided by operators/tenants and borrowers without independent verification by the Company.
Market Capitalization. Total common shares of Sabra outstanding multiplied by the closing price per share as of a given period.
Mental Health Facility. Mental Health Facilities provide a range of inpatient and outpatient behavioral health services for adults and children through specialized treatment programs.
Multi-License Designation. A senior housing facility that provides two levels of care (i.e. skilled nursing and assisted living or assisted living and independent living) is classified by the Company as Multi-License Designation.
Normalized AFFO. Normalized AFFO represents AFFO adjusted for one-time start-up costs. The Company considers normalized AFFO to be a useful measure to evaluate the Company’s operating results excluding one-time start-up costs. Normalized AFFO can help investors compare the operating performance of the Company between periods or as compared to other companies. Normalized AFFO does not represent cash flows from operations or net income as defined by GAAP and should not be considered an alternative to those measures in evaluating the Company’s liquidity or operating performance. Normalized AFFO also does not consider the costs associated with capital expenditures related to the Company’s real estate assets nor does it purport to be indicative of cash available to fund the Company’s future cash requirements. Further, the Company’s computation of normalized AFFO may not be comparable to normalized AFFO reported by other real estate investment trusts that do not define FFO in accordance with the current NAREIT definition or that interpret the current NAREIT definition or define AFFO or Normalized AFFO differently from the Company.
Occupancy Percentage. Occupancy Percentage represents the facilities’ average operating occupancy for the period indicated. The percentages are calculated based on available beds and units. All facility financial performance data were derived solely from information provided by operators/tenants and borrowers without independent verification by the Company. All facility financial performance data are presented one month in arrears. The Company includes the occupancy percentage for a property if it was owned by the Company at any time during the period presented. Information related to the Aurora Portfolio is not included in the information presented because the Aurora Portfolio was not acquired until the end of the period presented.
| 27 | |
SABRA HEALTH CARE REIT, INC.
REPORTING DEFINITIONS
Skilled Mix. Skilled Mix is defined as the total Medicare and non-Medicaid managed care patient revenue at skilled nursing facilities divided by the total revenues at skilled nursing facilities for any given period. All facility financial performance data were derived solely from information provided by the Company's tenants without independent verification by the Company. All facility financial performance data are presented one month in arrears. The Company includes skilled mix for a property if it was owned by the Company at any time during the period presented. Information related to the Aurora Portfolio is not included in the information presented because the Aurora Portfolio was not acquired until the end of the period presented.
Skilled Nursing Facility (“SNF”). Skilled nursing facilities provide services that include daily nursing, therapeutic rehabilitation, social services, housekeeping, nutrition and administrative services for individuals requiring certain assistance for activities in daily living.
Tenant EBITDAR. Facility EBITDAR, as defined herein, plus EBITDAR for the period presented for all other operations of any entities that guarantee the tenants' lease obligations to the Company. The Company uses Tenant EBITDAR in determining Tenant EBITDAR Coverage. As with Facility EBITDAR, the Company receives the underlying information from its tenants and, with respect to Tenant EBITDAR, the guarantors of its tenants' lease obligation to the Company. To the extent that a particular tenant's lease obligations are not guaranteed by another entity, Tenant EBITDAR and Facility EBITDAR with respect to a particular tenant are the same. The Company utilizes Tenant EBITDAR as a supplemental measure of the ability of the tenant to meet its cash rent and other obligations to the Company should the facilities be unable to generate sufficient liquidity to meet related obligations to the Company. The usefulness of Tenant EBITDAR is limited by the same factors that limit the usefulness of Facility EBITDAR. All facility and tenant financial performance data was derived solely from information provided by operators/tenants, guarantors and borrowers without independent verification by the Company. All facility and tenant financial performance data are presented one month in arrears. The Company includes Tenant EBITDAR with respect to property if the property was operated at any time during the period presented subject to a lease with the Company. Information related to the Aurora Portfolio is not included in the information presented because the Aurora Portfolio was not acquired until the end of the period presented.
Tenant EBITDAR Coverage. Tenant EBITDAR for the trailing 3 and 12 month periods prior to and including the period presented divided by the same period rent for all of our facilities plus rent expense for other operations of any entity that guarantees the tenants' lease obligation to the Company. Tenant EBITDAR coverage is a supplemental measure of a tenant's ability to meet its cash rent and other obligations to the Company. However, its usefulness is limited by, among other things, the same factors that limit the usefulness of Facility EBITDAR and Tenant EBITDAR. All facility and tenant financial performance data were derived solely from information provided by operators/tenants, guarantors and borrowers without independent verification by the Company. All facility and tenant financial performance data are presented one month in arrears. Information related to the Aurora Portfolio is not included in the information presented because the Aurora Portfolio was not acquired until the end of the period presented.
Total Debt. The carrying amount of the Company’s secured revolving credit facility, senior unsecured notes, and mortgage indebtedness, as reported in the Company’s consolidated financial statements.
Total Secured Debt. Mortgage and other debt secured by real estate.
| 28 | |