Attached files
| file | filename |
|---|---|
| 8-K - FORM 8-K - PNC FINANCIAL SERVICES GROUP, INC. | d250118d8k.htm |
 The PNC
Financial Services Group, Inc. BancAnalysts Association of Boston
November 3, 2011
Exhibit 99.1 |
 2
DRAFT
Cautionary Statement Regarding Forward-Looking
Information and Adjusted Information
This
presentation
includes
“snapshot”
information
about
PNC
used
by
way
of
illustration.
It
is
not
intended
as
a
full
business
or
financial
review
and
should
be
viewed
in
the
context
of
all
of
the
information
made
available
by
PNC
in
its
SEC
filings.
The
presentation
also
contains
forward-looking
statements
regarding
our
outlook
for
earnings,
revenues,
expenses,
capital
levels,
liquidity
levels,
asset
levels,
asset
quality
and
other
matters
regarding
or
affecting
PNC
and
its
future
business
and
operations.
Forward-looking
statements
are
necessarily
subject
to
numerous
assumptions,
risks
and
uncertainties,
which
change
over
time.
The
forward-looking
statements
in
this
presentation
are
qualified
by
the
factors
affecting
forward-looking
statements
identified
in
the
more
detailed
Cautionary
Statement
included
in
the
Appendix,
which
is
included
in
the
version
of
the
presentation
materials
posted
on
our
corporate
website
at
www.pnc.com/investorevents.
We
provide
greater
detail
regarding
some
of
these
factors
in
our
2010
Form
10-K
and
2011
Form
10-Qs,
including
in
the
Risk
Factors
and
Risk
Management
sections
of
those
reports,
and
in
our
subsequent
SEC
filings.
Our
forward-looking
statements
may
also
be
subject
to
other
risks
and
uncertainties,
including
those
we
may
discuss
in
this
presentation
or
in
SEC
filings,
accessible
on
the
SEC’s
website
at
www.sec.gov
and
on
PNC’s
corporate
website
at
www.pnc.com/secfilings.
We
have
included
web
addresses
in
this
presentation
as
inactive
textual
references
only.
Information
on
these
websites
is
not
part
of
this
presentation.
Future
events
or
circumstances
may
change
our
outlook
and
may
also
affect
the
nature
of
the
assumptions,
risks
and
uncertainties
to
which
our
forward-looking
statements
are
subject.
Forward-looking
statements
in
this
presentation
speak
only
as
of
the
date
of
this
presentation.
We
do
not
assume
any
duty
and
do
not
undertake
to
update
those
statements.
Actual
results
or
future
events
could
differ,
possibly
materially,
from
those
anticipated
in
forward-looking
statements,
as
well
as
from
historical
performance.
In
this
presentation,
we
sometimes
refer
to
adjusted
results
to
help
illustrate
the
impact
of
certain
types
of
items.
This
information
supplements
our
results
as
reported
in
accordance
with
GAAP
and
should
not
be
viewed
in
isolation
from,
or
a
substitute
for,
our
GAAP
results.
We
believe
that
this
additional
information
and
the
reconciliations
we
provide
may
be
useful
to
investors,
analysts,
regulators
and
others
as
they
evaluate
the
impact
of
these
respective
items
on
our
results
for
the
periods
presented
due
to
the
extent
to
which
the
items
are
not
indicative
of
our
ongoing
operations.
We
may
also
provide
information
on
pretax
pre-provision
earnings
(total
revenue
less
noninterest
expense)
and
on
tangible
book
value
per
share
(calculated
as
book
value
per
share
less
total
intangible
assets,
other
than
servicing
rights,
per
share).
We
believe
that
pretax
pre-provision
earnings,
a
non-GAAP
measure,
is
useful
as
a
tool
to
help
evaluate
the
ability
to
provide
for
credit
costs
through
operations,
and
that
tangible
book
value
per
share,
a
non-GAAP
measure,
is
useful
as
a
tool
to
help
evaluate
the
amount,
on
a
per
share
basis,
of
intangible
assets
other
than
servicing
rights
included
in
book
value.
Where
applicable,
we
provide
GAAP
reconciliations
for
such
additional
information,
including
in
the
Appendix.
In
certain
discussions,
we
may
also
provide
information
on
yields
and
margins
for
all
interest-earning
assets
calculated
using
net
interest
income
on
a
taxable-equivalent
basis
by
increasing
the
interest
income
earned
on
tax-exempt
assets
to
make
it
fully
equivalent
to
interest
income
earned
on
taxable
investments.
We
believe
this
adjustment
may
be
useful
when
comparing
yields
and
margins
for
all
earning
assets.
We
may
also
use
annualized,
proforma,
estimated
or
third
party
numbers
for
illustrative
or
comparative
purposes
only.
These
may
not
reflect
actual
results.
This
presentation
may
also
include
discussion
of
other
non-GAAP
financial
measures,
which,
to
the
extent
not
so
qualified
therein
or
in
the
Appendix,
is
qualified
by
GAAP
reconciliation
information
available
on
our
corporate
website
at
www.pnc.com
under
“About
PNC–Investor
Relations.” |
 3
DRAFT
Today’s Discussion
PNC’s differentiated business model has delivered
strong results through the cycle
Investing for future growth
Balance sheet positioned to support client demand
Significant opportunity to deliver long-term
shareholder value
PNC Continues to Build a Great Company.
PNC Continues to Build a Great Company. |
 4
DRAFT
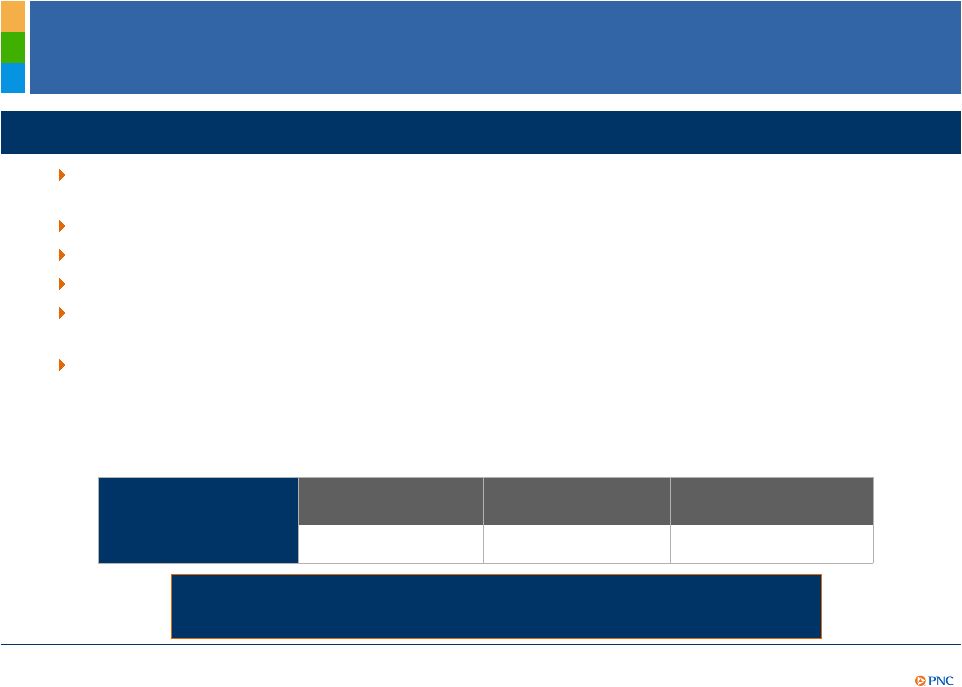
Significant 2011 Achievements
PNC Is Positioned to Deliver Even Greater Shareholder Value.
PNC Is Positioned to Deliver Even Greater Shareholder Value.
YTD financial
summary
Net income
Diluted EPS from
net income
Return on
average assets
$2,578 million
$4.79
1.31%
Delivered strong financial results through exceptional client growth across businesses and
markets
Grew commercial loans
Maintained
a
high
quality
balance
sheet,
improved
overall
credit
quality
Disciplined expense management
Pending
RBC
Bank
(USA)
acquisition
will
provide
access
to
growth
markets
at
a
price
below
tangible book value
Continued to maintain strong capital levels and ratios and liquidity positions
YTD11 highlights
—
Increased common dividend 250% in second quarter
—
Issued $1 billion preferred stock
—
Issued $1.25 billion senior debt |
 5
DRAFT
Delivering Strong Returns
YTD return on average assets
YTD return on Tier 1 common
capital²
Peer
Source:
SNL
DataSource,
First
Call
reports
and
company
reports,
as
available.
(1)
PNC
Sept.
30,
2011
Tier
1
common
and
Tier
1
common
ratio
estimated.
(2)
Return
on
Tier
1
common
capital
calculated
as
annualized
net
income
divided
by
estimated
Tier
1
common
capital.
Further
information is provided in the Appendix.
STI as of June 30, 2011.
9/30/11 Tier 1 common ratio¹
BAC
-.03%
BAC
-.06% |
 6
DRAFT
942
1,076
Sept 10
Sept 11
Growing Customers –
Retail Banking
Strong results
December
2010
Goal
Free checking
Relationship checking³
September
2011
30%
68%
70%
(1)
Organic
growth
refers
to
consumer
and
small
business
customers
excluding
32,000
relationships
from
2Q11
acquisition.
(2)
Organic
growth
excludes
3,000
customers
acquired
by
acquisition
in
2Q11.
(3)
Relationship
checking
refers
to
accounts
with
a
committed
balance
level
or
self-
service accounts with lower cost of servicing.
YTD highlights
Checking relationships YTD
annualized organic growth
rate of 5.5% far exceeded
the 1.2% population growth
of our retail footprint
On track to achieve new
checking account mix target
of 70% relationship checking
Organic checking
relationship growth¹
Organic growth in online bill
payment active customers
New originations
Period end
48
225
YTD10
YTD11
2
+
+ |
 7
DRAFT
Strong results
Corporate Banking New Cumulative Primary Client
1
Growth
1Q
2Q
3Q
4Q
New primary clients:
—
New
client
additions
represent
revenue
potential
of
$200
million
per
performance of existing clients
—
Grew
10%
each
year
for
two
years
while
improving
average
risk
rating
—
Referral
sales
to
Corporate
Banking
from Retail increased 34%
YTD highlights
YTD10
YTD11
37%
46%
Corporate Banking New Client Loan Utilization
256
565
869
0
250
500
750
1,000
2011 Goal
2011 Actual
New primary
clients increased
25% YoY
(1) A Corporate Banking primary client is defined as a corporate
banking relationship with annual revenue generation of $50,000 or more or,
within corporate banking, a commercial banking client relationship with annual revenue
generation of $10,000 or more. Growing Customers –
Corporate Banking |
  8
DRAFT
Growing Customers –
Asset Management Group
(1)
Referral
sales
are
new
sales
to
clients
referred
to
AMG
by
Retail
Banking
or
Corporate
and
Institutional
Banking.
(2)
Primary
clients
are
client
relationships
with
annual
revenue
generation
of
$10,000
or
more.
(3)
Total
net
flows
defined
as
net
change
from
clients
including
dividends received.
YTD highlights
Total sales increased 38% in 3Q11 compared
with 3Q10
Expanding distribution in all markets with a
particular focus on higher growth markets
—
216
external
new
hires
in
the
first
nine
months
of
2011
–
primarily
front
line
talent
acquisition
YTD earnings impacted by higher marketing
costs from PNC Wealth Insight
SM
product
launch in 3Q
—
Accessible
to
over
12,000
clients
Strong results
Referral sales
1
YTD11 vs. YTD10
86%
New primary clients
2
YTD11 vs. YTD10
34%
$.1B
$1.3B
3Q11
3Q10
Discretionary AUM Total Net Flows |
 9
DRAFT
3.71
Performance and Team Driven Culture
Reflects PNC’s brand attributes of ease, confidence and
achievement
Awarded to 29 companies worldwide for extraordinary ability
to create an engaged workplace culture
PNC is a three-time winner and the only U.S bank to be
recognized
4.04
4.21
4.40
4.34
4.40
4.49
4.55
4.35
4.41
4.44
4.44
4.43
4.41
4.48
4.00
4.50
5.00
4Q07
4Q08
4Q09
4Q10
2Q11
Employee
Engagement
Customer
Engagement
High employee and customer engagement
“Gallup Great Workplace Award”
recipient for 2011
Employee engagement shown for total bank branches. Source: Gallup.
4.43
4.38
NCC Conversions
Strongly
Agree
Agree |
 10
DRAFT
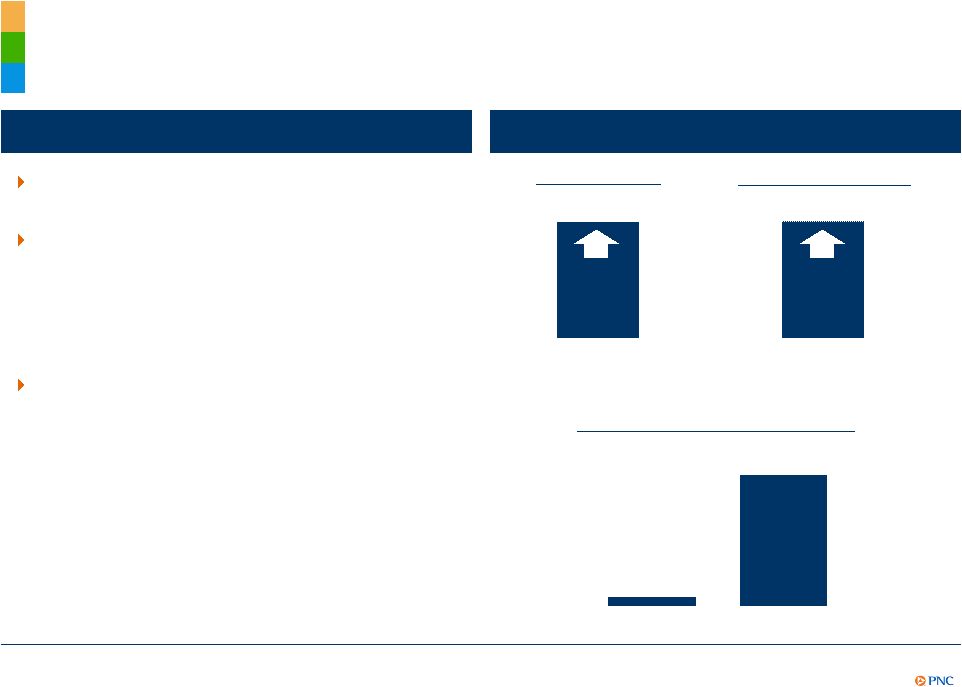
Investing for Future Growth
Expanding into faster growing regions with
attractive market demographics
—
Chicago, Atlanta
1
, Charlotte
1
, Orlando
1
Adding relationship managers and product
specialists in targeted, under-penetrated growth
markets
—
Increasing distribution capacity
—
Product training
Opportunity to deliver PNC’s products and services
to new customers
—
Utilizing technology and market research on
changing customer behavior to provide customers
more choices
—
Leveraging cross sell synergies
Higher growth markets
People
Product capabilities
Large markets provide excellent C&IB
and Wealth Management opportunities
RBC Bank (USA)¹
Market Potential
Market Revenue Growth
(YTD10-YTD11)
Washington, DC
11%
Chicago
27%
Yielding results
(1) Acquisition pending. (2) Source: SNL DataSource as of September 30, 2011.
|
 11
DRAFT
The Chicago Story –
“Go-To-Market Strategy”
Convert to PNC common platform
Initiate “Human Sigma”
in retail distribution
Increase brand awareness
Invest in product and relationship managers
Significant increase in PNC’s customer confidence and brand awareness
53%
55%
56%
54%
58%
41%
32%
22%
23%
23%
2007
2008
2009
2010
2011
Strategy
(1)
Confidence
is
measured
at
PNC
by
asking
“PNC
is
a
name
I
can
always
trust”
and
“PNC
always
delivers
on
what
they
promise.”
A
respondent
is
considered
Confident
if
they
answer
a
“5”
Strongly
Agree
to
both
items.
Source:
Gallup
June
2011.
(2)
Source:
TNS
Strategic
Market report as of 2Q11.
27%
29%
20%
28%
51%
55%
56%
58%
Pre-conversion
Post-conversion
3Q09
4Q09
1Q10
2Q10
3Q10
4Q10
1Q11
2Q11
Total Brand Awareness –
Chicago
2
National Customer Confidence
PNC customer confidence
1
US population
confidence in banking industry |
 12
DRAFT
The Chicago Story –
Market Opportunity
Philadelphia
Chicago
Projected 5-year growth:
Population
.71%
1.86%
Household income
15.4%
16.6%
Market demographics:
Population (in millions)
5.9
9.7
Deposits (in millions)
$204,860
$291,896
Branches
1,892
3,214
Market opportunities:
Households²
(in millions)
2.2
3.5
Universities
64
74
Corporate
Banking¹
4,800
7,300
PNC’s presence:
Deposit market share
8.2%
4.1%
Branches
190
151
Source: SNL Database and Nielsen as of September 30, 2011. (1) Corporate banking prospects
include Large Corporate, Middle Market, Commercial Segment, Public Finance and a minor
amount of other segments. (2) Source: Nielsen. |
  13
DRAFT
The Chicago Story –
Executing on the Opportunity
PNC’s demonstrated execution and revenue potential
Total Corporate Banking and AMG Sales
1
48%
68%
52%
32%
Non-Credit
Sales
Credit Sales
$26
$114
$52
Prior to
conversion of
Chicago
market
August 2011,
annualized
Philadelphia
Chicago
Philadelphia
Chicago
(1) Chicago market application systems conversion occurred in June 2010.
Pre-conversion Sales reflect the first six months of 2010, annualized. (2)
Year-to-date August 2011. Corporate Banking Cross-sell Revenue
2 |
 14
DRAFT
Balance Sheet Management in a Low Rate
Environment
Drivers
Increase responsible lending to partially offset lower asset yields
Substantially reduce cost of funding to maintain net interest income
Maintain liquidity and strong capital position
Focus on risk-adjusted loan growth to mitigate impact of securities repricing
Lower funding cost
Strategies
Funding Cost Reduction
Opportunities
Expected 2012 Impact
(in millions)
Repricing CDs
$450-$500
Trust preferreds
Maturing debt
Deposit funding
Expected
2012
impact
compared
to
2011
assumes
an
extended
period
of
slow
economic
growth
and
low
interest
rates. |
 15
DRAFT
Accelerating Commercial and Industrial Loan Growth
Source: Federal Reserve H8 reports for all domestic commercial banks. Seasonally
adjusted annual growth rate. PNC loan data from TARP reports. (1) PNC Corporate &
Institutional Banking quarterly utilization rates reflect the consolidation of Market Street Funding Corporation
beginning January 2010. 2011 represents year to date results through September 30, 2011.
Annual loan growth
Every percentage point increase in utilization
increases loan balances by $1.4B and
approximately $40M in annual net interest
income.
Utilization
-20%
-15%
-10%
-5%
0%
5%
10%
15%
20%
25%
PNC
All Commercial Banks
45%
46%
47%
48%
49%
50%
51%
52%
53%
PNC Corporate & Institutional
Banking Utilization
1 |
 16
DRAFT
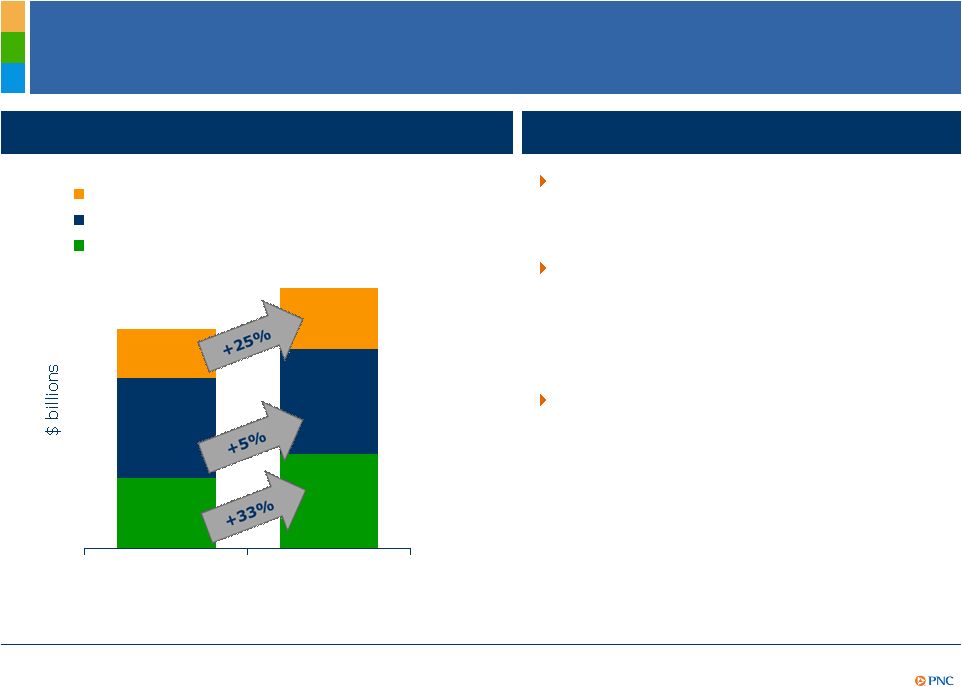
Loan Growth Momentum
Total Corporate & Institutional Banking
average loans increased in 3Q11 by 7%
compared with 3Q10
Loans have been steadily increasing in
Business Credit, Middle Market and
Corporate Finance since the end of 2010,
primarily driven by new client growth and
commitments
Average credit commitments per new
client has increased 60% YTD11 vs.
YTD10
YTD highlights
Average
loan
growth
primarily
driven
by
new
clients
9.1
9.6
6.4
8.5
4.4
5.5
3Q10
3Q11
Corporate Finance
Middle Market
Business Credit |
 17
DRAFT
Highlights
Capital Management
Tier 1 common ratio
(1) Proforma estimate is based on PNC’s estimated Tier 1 common ratio of 10.5% as of
9/30/11, and includes the assumed benefit of 1.4%, which reflects First Call 2011 and
2012 estimates and current dividend payout, as well as the assumed decrease of 3.3%-3.8%, which reflects assumptions utilizing Basel II
methodology regarding credit, operating and market risk and includes the treatment of
BlackRock and sub-investment grade securities (assuming no AOCI double counting)
under Basel II, and assumes no common share issuance for the pending RBC Bank (USA) acquisition. This estimate is subject to
further regulatory guidance and clarity. The estimate is based on the phase-in of Basel
III rules in effect as of 2012. (2) Regulatory requirements include capital
conservation buffer. (3) Parent company liquidity coverage defined as liquid assets divided by funding obligations within a two year period.
Basel III requirements²
12/31/12
Proforma Basel III
8.0% -
8.5%¹
Proforma Basel III Tier 1 common ratio
estimated to be between 8.0-8.5% at
December 31,
2012²
–
Possible improvement assuming final
capital requirements reflect the inherent
risk profile in our sub-investment grade
securities
–
Assumes no common stock issuance to
fund pending acquisition of RBC Bank
(USA)
Strong liquidity position at September 30, 2011
–
Loan-to-deposit ratio of 82%
–
Parent company two year liquidity
coverage³
of 168%
Capital Priorities:
–
Investing in organic growth
–
Meeting regulatory requirements
–
Return capital to shareholders |
 18
DRAFT
Delivering Long-Term Shareholder Value
Tangible book value per share¹
Pretax pre-provision earnings per share³
$17.58
$44.85
12/31/07
9/30/11
$7.06
$11.16
2007
2011
PNC
% change 2007-2011²
PNC
4
155%
87%
71%
48%
36%
24%
21%
-4%
-5%
-10%
-14%
-42%
-44%
58%
23%
17%
13%
11%
-7%
-29%
-36%
-43%
-55%
-57%
-68%
-84%
PNC
MTB
WFC
USB
JPM
COF
BBT
FITB
STI
CMA
RF
KEY
BAC
Peer
banks
identified
in
the
Appendix.
Source
for
banks
other
than
PNC:
SNL
DataSource.
(1)
Tangible
book
value
per
share
calculated
as
book
value
per
share
less
goodwill
and
other
intangible
assets
other
than
servicing
rights.
Further
information
is
provided
in
the
Appendix.
(2)
Percentage
change
for
2007
to
nine
months
ended
September
30,
2011,
annualized,
respectively.
(3)
Pretax,
pre-provision
earnings
are
from
continuing
operations
and
are
calculated
as
total
revenue
less
noninterest
expense.
Further
information
is
provided
in
the
Appendix.
(4)
2011
represents
pretax
pre-provision
earnings
for
the
nine
months
ended
September
30,
2011,
annualized,
divided
by
the
number
of
shares outstanding as of September 30, 2011.
% change 2007-2011²
PNC
WFC
USB
JPM
MTB
BBT
COF
BAC
CMA
FITB
STI
RF
KEY |
 19
DRAFT
Cautionary Statement Regarding Forward-Looking
Information
This
presentation
includes
“snapshot”
information
about
PNC
used
by
way
of
illustration
and
is
not
intended
as
a
full
business
or
financial
review.
It
should not be viewed in isolation but rather in the context of all of the information made
available by PNC in its SEC filings. We
also
make
statements
in
this
presentation,
and
we
may
from
time
to
time
make
other
statements,
regarding
our
outlook
for
earnings,
revenues,
expenses,
capital
levels,
liquidity
levels,
asset
quality
and
other
matters
regarding
or
affecting
PNC
and
its
future
business
and
operations
that
are
forward-looking
statements
within
the
meaning
of
the
Private
Securities
Litigation
Reform
Act.
Forward-looking
statements
are
typically
identified
by
words
such
as
“believe,”
“plan,”
“expect,”
“anticipate,”
“see,”
“intend,”
“outlook,”
“project,”
“forecast,”
“estimate,”
“goal,”
“will,”
“should”
and
other
similar
words
and
expressions.
Forward-looking
statements
are
subject
to
numerous
assumptions,
risks
and
uncertainties,
which
change
over
time.
Forward-looking
statements
speak
only
as
of
the
date
made.
We
do
not
assume
any
duty
and
do
not
undertake
to
update
forward-looking
statements.
Actual
results
or
future
events
could
differ,
possibly
materially,
from
those
anticipated
in
forward-looking
statements,
as
well
as
from
historical performance.
Our forward-looking statements are subject to the following principal risks and
uncertainties. •Our businesses, financial results and balance sheet values are
affected by business and economic conditions, including the following:: o
Changes in interest rates and valuations in debt, equity and other financial markets.
o
Disruptions in the liquidity and other functioning of U.S. and global financial markets.
o
The
impact
on
financial
markets
and
the
economy
of
the
downgrade
by
Standard
&
Poor’s
of
U.S.
Treasury
obligations
and
other
U.S.
government-backed
debt,
as
well
as
issues
surrounding
the
level
of
U.S.
and
European
government
debt
and
concerns
regarding
the
credit
worthiness of certain sovereign governments in Europe.
o
Actions
by
Federal
Reserve,
U.S.
Treasury
and
other
government
agencies,
including
those
that
impact
money
supply
and
market
interest
rates.
o
Changes in customers’, suppliers’
and other counterparties’
performance and creditworthiness.
o
Slowing or failure of the current moderate economic recovery.
o
Continued
effects
of
aftermath
of
recessionary
conditions
and
uneven
spread
of
positive
impacts
of
recovery
on
the
economy
and
our
counterparties,
including
adverse
impacts
on
levels
of
unemployment,
loan
utilization
rates,
delinquencies,
defaults
and
counterparty
ability
to
meet credit and other obligations.
o
Changes
in
customer
preferences
and
behavior,
whether
due
to
changing
business
and
economic
conditions,
legislative
and
regulatory
initiatives, or other factors.
•Our
forward-looking
financial
statements
are
subject
to
the
risk
that
economic
and
financial
market
conditions
will
be
substantially
different
than
we
are
currently
expecting.
These
statements
are
based
on
our
current
view
that
the
modest
economic
expansion
will
persist
in
the
year
ahead
and
interest rates will remain very low.
Appendix |
 20
DRAFT
Cautionary Statement Regarding Forward-Looking
Information (continued)
Appendix
•Legal
and
regulatory
developments
could
have
an
impact
on
ability
to
operate
our
businesses,
financial
condition,
results
of
operations,
competitive
position,
reputation,
or
pursuit
of
attractive
acquisition
opportunities.
Reputational
impacts
could
affect
matters
such
as
business
generation
and
retention,
liquidity,
funding,
and
ability
to
attract
and
retain
management.
These
developments
could
include:
o
Changes
resulting
from
legislative
and
regulatory
reforms,
including
broad-based
restructuring
of
financial
industry
regulation
and
changes
to
laws
and
regulations
involving
tax,
pension,
bankruptcy,
consumer
protection,
and
other
industry
aspects,
and
changes
in
accounting
policies
and
principles.
We
will
be
impacted
by
extensive
reforms
provided
for
in
the
Dodd-Frank
Wall
Street
Reform
and
Consumer
Protection
Act
(the
“Dodd-Frank
Act”)
and
otherwise
growing
out
of
the
recent
financial
crisis,
the
precise
nature,
extent
and
timing
of
which,
and
their
impact
on
us, remains uncertain.
o
Changes
to
regulations
governing
bank
capital
and
liquidity
standards,
including
due
to
the
Dodd-Frank
Act
and
to
Basel
III
initiatives.
o
Unfavorable
resolution
of
legal
proceedings
or
other
claims
and
regulatory
and
other
governmental
investigations
or
other
inquiries.
In
addition
to
matters
relating
to
PNC’s
business
and
activities,
such
matters
may
include
proceedings,
claims,
investigations,
or
inquiries
relating
to
pre
acquisition
business
and
activities
of
acquired
companies,
such
as
National
City.
These
matters
may
result
in
monetary
judgments
or
settlements
or
other
remedies,
including
fines,
penalties,
restitution
or
alterations
in
our
business
practices,
and
in
additional
expenses
and
collateral costs, and may cause reputational harm to PNC.
o
Results
of
regulatory
examination
and
supervision
process,
including
our
failure
to
satisfy
requirements
of
agreements
with
governmental
agencies.
o
Impact
on
business
and
operating
results
of
any
costs
associated
with
obtaining
rights
in
intellectual
property
claimed
by
others
and
of
adequacy
of
our
intellectual
property
protection
in
general.
•Business
and
operating
results
are
affected
by
our
ability
to
identify
and
effectively
manage
risks
inherent
in
our
businesses,
including,
where
appropriate,
through
effective
use
of
third-party
insurance,
derivatives,
and
capital
management
techniques,
and
to
meet
evolving
regulatory
capital
standards.
In
particular,
our
results
currently
depend
on
our
ability
to
manage
elevated
levels
of
impaired
assets.
•Business
and
operating
results
also
include
impacts
relating
to
our
equity
interest
in
BlackRock,
Inc.
and
rely
to
a
significant
extent
on
information
provided
to
us
by
BlackRock.
Risks
and
uncertainties
that
could
affect
BlackRock
are
discussed
in
more
detail
by
BlackRock
in
SEC
filings.
•Our
planned
acquisition
of
RBC
Bank
(USA)
presents
us
with
risks
and
uncertainties
related
both
to
the
acquisition
transaction
itself
and
its
integration
into
PNC
after
closing,
including:
o
Closing
is
dependent
on,
among
other
things,
receipt
of
regulatory
and
other
applicable
approvals,
the
timing
of
which
cannot
be
predicted
with
precision
at
this
point
and
which
may
not
be
received
at
all.
The
impact
of
closing
on
PNC’s
financial
statements
will
be
affected
by
the
timing
of
the transaction.
o
The
transaction
(including
integration
of
RBC
Bank
(USA)’s
businesses)
may
be
substantially
more
expensive
to
complete
than
anticipated.
Anticipated
benefits,
including
cost
savings
and
strategic
gains,
may
be
significantly
harder
or
take
longer
to
achieve
than
expected
or
may
not
be achieved in their entirety as a result of unexpected factors or events.
o
Our
ability
to
achieve
anticipated
results
from
this
transaction
is
dependent
also
on
the
following
factors,
in
part
related
to
the
state
of
economic
and
financial
markets:
the
extent
of
credit
losses
in
the
acquired
loan
portfolios
and
the
extent
of
deposit
attrition.
Also,
litigation
and
governmental
investigations
that
may
be
filed
or
commenced,
as
a
result
of
this
transaction
or
otherwise,
could
impact
the
timing
or
realization
of anticipated benefits to PNC. |
 21
DRAFT
Cautionary Statement Regarding Forward-Looking
Information (continued)
Appendix
o
Integration
of
RBC
Bank
(USA)’s
business
and
operations
into
PNC,
which
will
include
conversion
of
RBC
Bank
(USA)’s
different
systems
and
procedures,
may
take
longer
than
anticipated
or
be
more
costly
than
anticipated
or
have
unanticipated
adverse
results
relating
to
RBC
Bank
(USA)’s
or
PNC’s
existing
businesses.
PNC’s
ability
to
integrate
RBC
Bank
(USA)
successfully
may
be
adversely
affected
by
the
fact
that
this
transaction will result in PNC entering several markets where PNC does not currently have any
meaningful retail presence. •In
addition
to
the
planned
RBC
Bank
(USA)
transaction,
we
grow
our
business
in
part
by
acquiring
from
time
to
time
other
financial
services
companies,
financial
services
assets
and
related
deposits.
These
other
acquisitions,
including
our
planned
acquisition
of
branches
and
related
deposits
in
metropolitan
Atlanta,
Georgia
from
Flagstar
Bank,
FSB,
often
present
risks
and
uncertainties
analogous
to
those
presented
by
the
RBC
Bank (USA) transaction, as well as, in some cases, with risks related to entering into new
lines of business. •Competition
can
have
an
impact
on
customer
acquisition,
growth
and
retention
and
on
credit
spreads
and
product
pricing,
which
can
affect
market
share,
deposits
and
revenues.
Industry
restructuring
in
the
current
environment
could
also
impact
our
business
and
financial
performance
through
changes
in
counterparty
creditworthiness
and
performance
and
in
competitive
and
regulatory
landscape.
Our
ability
to
anticipate
and
respond
to
technological changes can also impact our ability to respond to customer needs and meet
competitive demands. •Business
and
operating
results
can
also
be
affected
by
widespread
disasters,
dislocations,
terrorist
activities
or
international
hostilities
through
impacts on the economy and financial markets generally or on us or our counterparties
specifically. We
provide
greater
detail
regarding
some
of
these
factors
in
our
2010
Form
10-K
and
first
and
second
quarter
2011
Form
10-Qs,
including
Risk
Factors
and
Risk
Management
sections
of
those
reports,
and
our
subsequent
SEC
filings.
Our
forward-looking
statements
may
also
be
subject
to
other
risks
and
uncertainties,
including
those
we
may
discuss
elsewhere
in
this
presentation
or
in
SEC
filings,
accessible
on
the
SEC’s
website
at
www.sec.gov
and
on
our
corporate
website
at
www.pnc.com/secfilings.
We
have
included
these
web
addresses
as
inactive
textual
references
only.
Information on these websites is not part of this document.
Any
annualized,
proforma,
estimated,
third
party
or
consensus
numbers
in
this
presentation
are
used
for
illustrative
or
comparative
purposes
only
and
may
not
reflect
actual
results.
Any
consensus
earnings
estimates
are
calculated
based
on
the
earnings
projections
made
by
analysts
who
cover
that
company.
The
analysts’
opinions,
estimates
or
forecasts
(and
therefore
the
consensus
earnings
estimates)
are
theirs
alone,
are
not
those
of
PNC or its management, and may not reflect PNC’s or other company’s actual or
anticipated results. |
 22
DRAFT
Non-GAAP to GAAP Reconcilement
Appendix
As of or for the nine months ended
In millions
Sept. 30, 2011
Tier 1 common capital (1)
$23,410
Reported net income
2,578
Reported net income, if annualized
3,447
Return on tier 1 common capital
14.7%
(1) Estimated for Sept. 30, 2011.
PNC
believes
that
return
on
tier
1
common
capital
is
useful
as
a
tool
to
help
measure
and assess a company's use of common equity.
As of
In millions except per share data
Dec. 31, 2007
Sept. 30, 2011
% Change
Common shareholders' equity
$14,847
$32,583
Common shares outstanding
341
526
Book value per common share
$43.60
$61.92
42%
Goodwill and other intangible assets other than servicing rights
$8,853
$8,990
Common shareholders' equity less intangible assets
$5,994
$23,593
Common shares outstanding
341
526
Tangible book value per common share
$17.58
$44.85
155%
PNC
believes
that
tangible
book
value
per
common
share,
a
non-GAAP
measure,
is
useful
as
a
tool
to
help
evaluate
the
amount,
on
a
per
share
basis,
of
goodwill
and
certain
other
intangible
assets
included
in
book
value
per common share. |
 23
DRAFT
Non-GAAP to GAAP Reconcilement
Appendix
For the year ended
For the nine months ended
In millions except per share data
Dec. 31, 2007
September 30, 2011
% Change
Total revenue
$6,705
$10,777
Noninterest expense
4,296
6,386
Pretax
pre-provision earnings from continuing operations $2,409
$4,391
Pretax pre-provision earnings, annualized
$2,409
$5,871
Common shares outstanding
341
526
Annualized pretax pre-provision earnings per share
$7.06
$11.16
58%
PNC
believes
that
pretax,
pre-provision
earnings
from
continuing
operations,
a
non-GAAP
measure,
is
useful
as
a
tool
to
help evaluate the ability to provide for credit costs through operations.
|
 24
DRAFT
Peer Group of Banks
Appendix
The PNC Financial Services Group, Inc.
PNC
BB&T Corporation
BBT
Bank of America Corporation
BAC
Capital One Financial, Inc.
COF
Comerica Inc.
CMA
Fifth Third Bancorp
FITB
JPMorgan Chase
JPM
KeyCorp
KEY
M&T Bank
MTB
Regions Financial Corporation
RF
SunTrust Banks, Inc.
STI
U.S. Bancorp
USB
Wells Fargo & Co.
WFC
Ticker |