Attached files
| file | filename |
|---|---|
| 8-K - FORM 8-K - JONES LANG LASALLE INC | d251535d8k.htm |
| EX-99.1 - PRESS RELEASE - JONES LANG LASALLE INC | d251535dex991.htm |
 Supplemental Information
Third Quarter
Earnings Call
2011
Exhibit 99.2 |
 Market & Financial Overview |
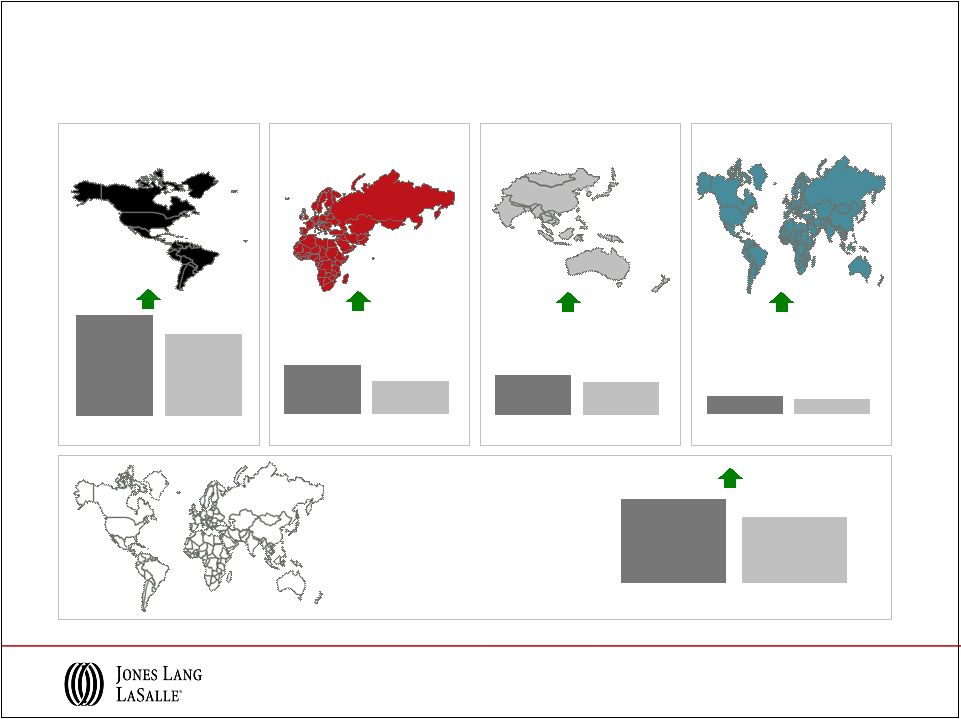
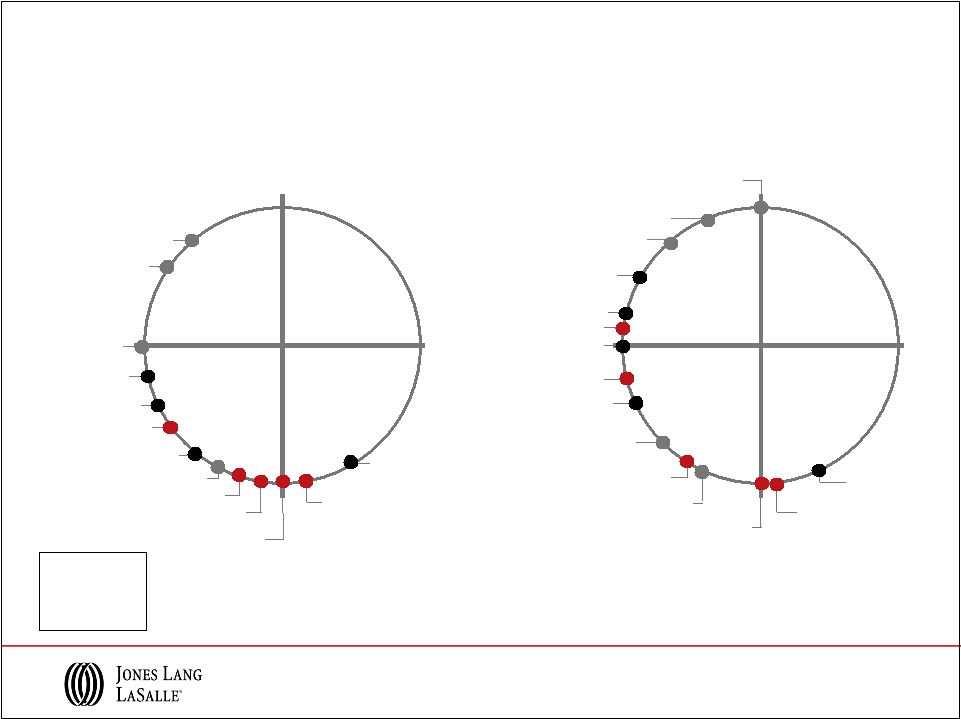
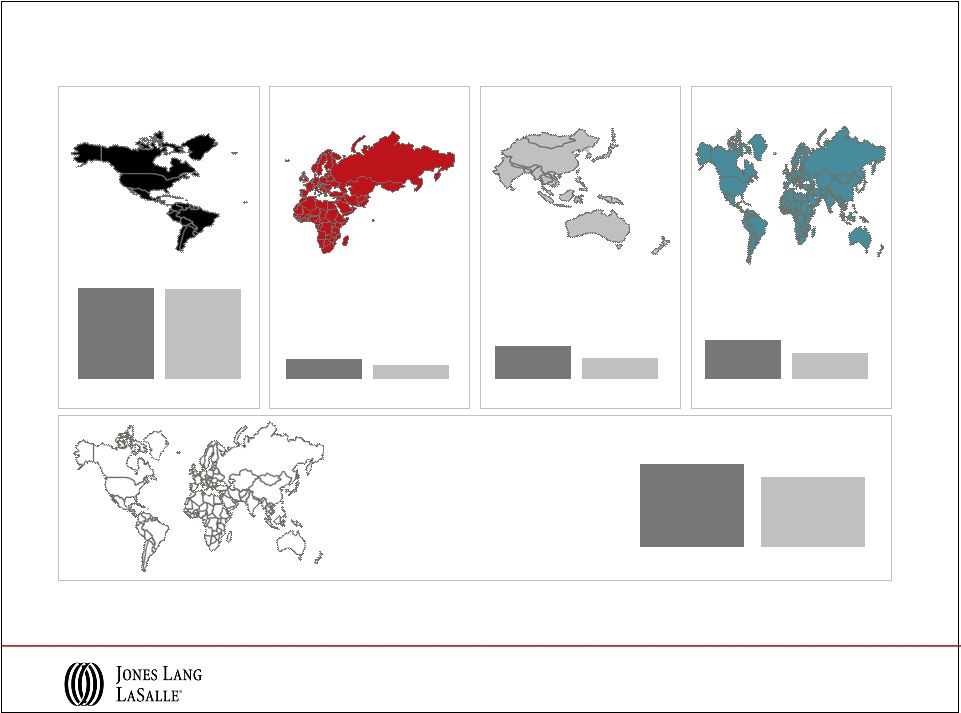
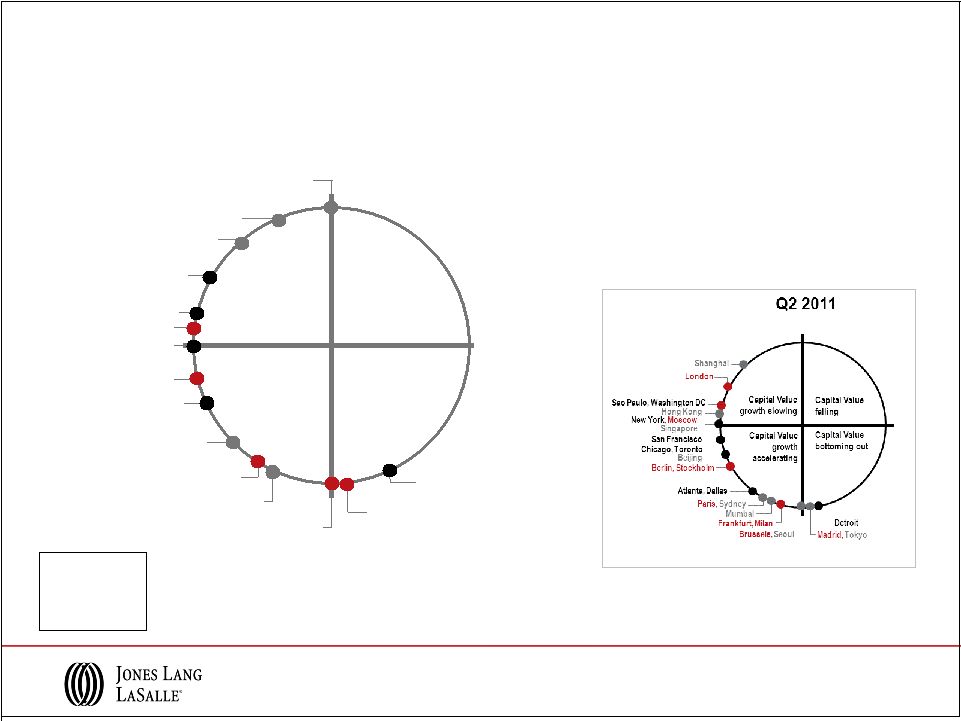 Capital Values
Capital Value
growth slowing
Capital Value
growth
accelerating
Capital Values
bottoming out
Capital Values
falling
Q3 2011
Hong Kong
Washington DC
London
Moscow, Paris
Chicago,
Stockholm
Atlanta, Dallas
Frankfurt, Milan
Brussels
Seoul
Madrid,
Tokyo Detroit
Berlin,
Toronto
San Francisco, Beijing
New York, Sao Paulo
Shanghai
Singapore
Sydney
Mumbai
Americas
EMEA
Asia Pacific
As of Q3 2011
The Jones Lang LaSalle Property Clocks
SM
3 |
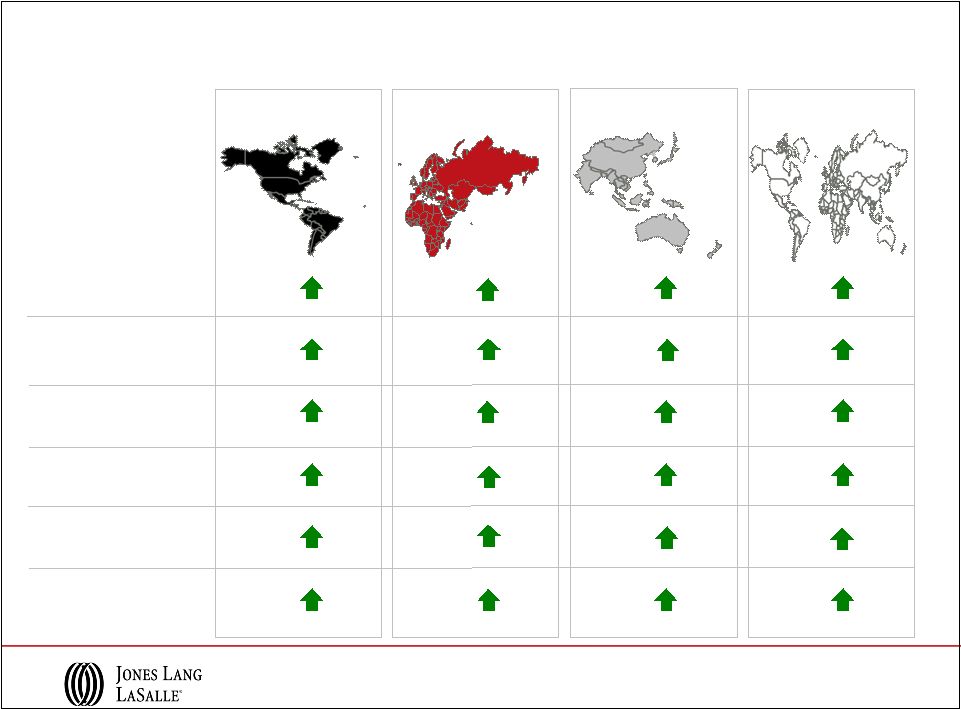
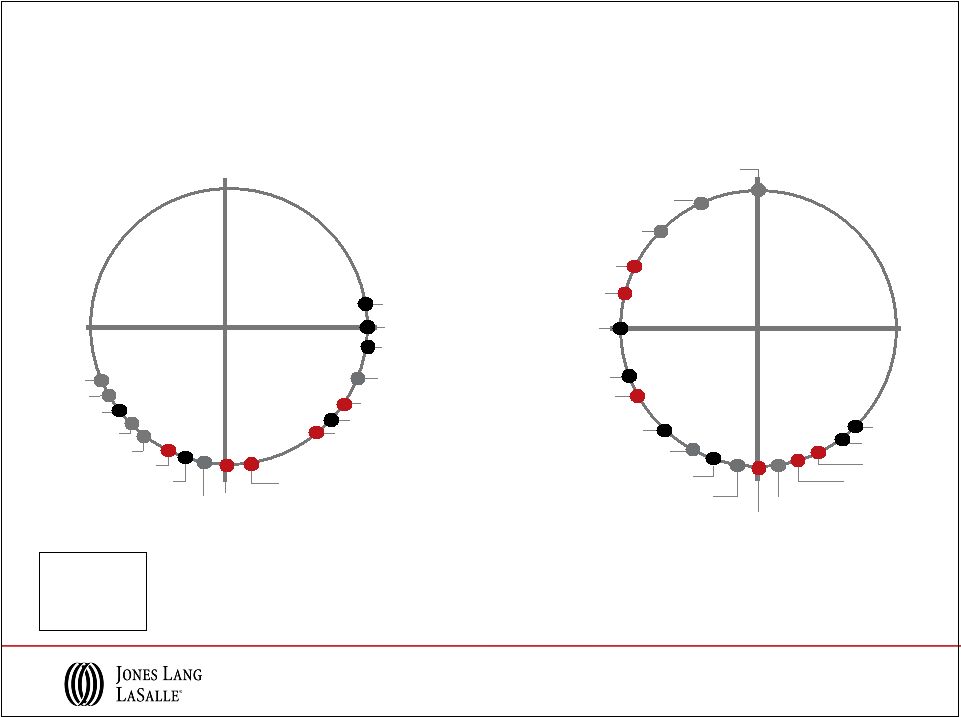
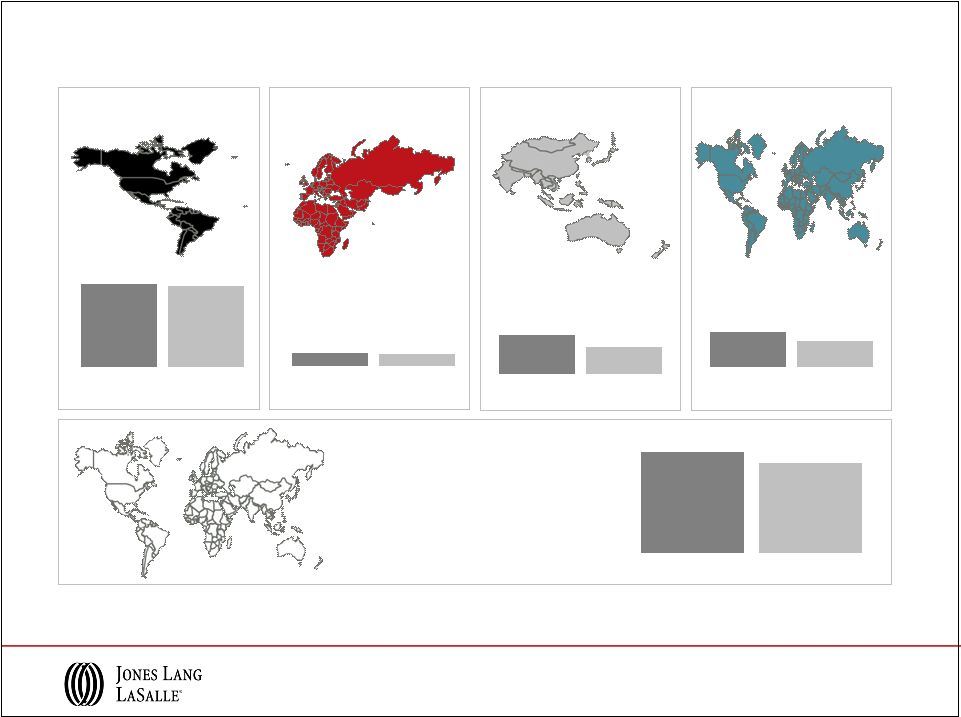
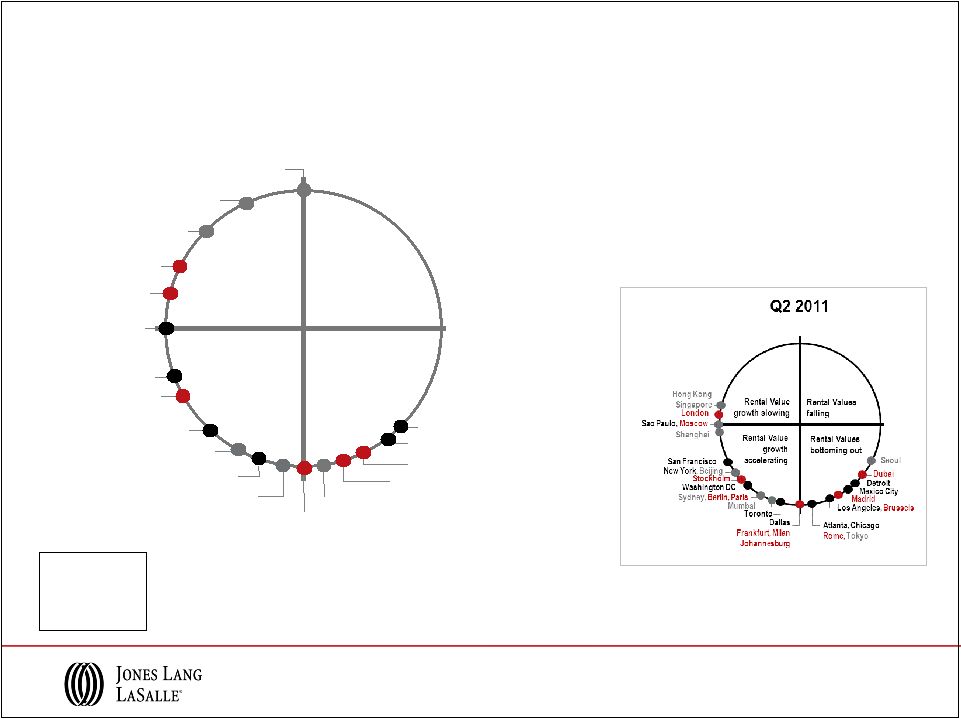 Leasing Market Fundamentals
Q3 2011
As of Q3 2011
The Jones Lang LaSalle Property Clocks
SM
Rental Value
growth slowing
Rental Value
growth
accelerating
Rental Values
bottoming out
Rental Values
falling
Detroit, Dubai
Seoul
San Francisco
New York
Washington DC, Toronto, Milan
Dallas,
Mumbai
Atlanta
Frankfurt
Johannesburg
Chicago
Rome
Tokyo
Los Angeles
Brussels
Madrid
Berlin,
Sydney
Stockholm
Sao Paulo, Paris
Beijing
London
Moscow
Mexico City
Hong Kong
Singapore
Shanghai
Americas
EMEA
Asia Pacific
4 |
 Q3 Selected Business Wins and Expansions
5
Americas
EMEA
Asia Pacific
–
HSBC
–
10M
sf
–
Principal
Financial
–
7M
sf
–
Red
Roof
Inns
Portfolio,
U.S.
-
$151M
–
One
Shell
Square,
New
Orleans
-
$102M
–
1700
Market,
Philadelphia
-
$144M/$123M
–
MetLife,
New
York
–
276K
sf
–
Morris,
Manning
&
Martin,
Atlanta
–
118K
sf
–
Nexen,
Dallas
–
191K
sf
–
HSBC –
4M sf
–
Rolls
Building,
London
-
£305M
–
Friederich
Carre,
Berlin
–
€53M
–
Magnolia
Shopping
Centre,
Poland
–
€220M
–
AXA, Brussels –
538K sf
–
MRSK,
Moscow
–
82K
sf
–
SNS
REEAL,
Amsterdam
–
70K
sf
–
HSBC –
6M sf
–
Pertamina,
Indonesia
–
2M
sf
–
Abacus,
Australia
–
$628M
–
SOHO
China,
Shanghai
–
$296M
–
Crowne
Plaza
Airport,
Singapore
–
$231M
–
AIG
Edison
Life,
Japan
–
2M
sf
–
Agile
Property
Holdings,
Guangzhou
–
130K
sf
–
Australia
Prop.
Growth
Fund
–
3M
sf |
 Financial Information |
 7
Q3 2011 Revenue Performance
Note: Equity earnings (losses) of $0.5M and ($2.0M) in 2011 and 2010, respectively,
are included in segment results, however, are excluded from Consolidated
totals. Americas
EMEA
Asia Pacific
$379.3
$309.1
2011
2010
Consolidated
$903.2
$708.4
2011
2010
($ in millions, % change in USD)
LIM
23%
46%
22%
21%
28%
$247.3
$169.3
2011
2010
$200.6
$165.0
2011
2010
$76.5
$63.0
2011
2010 |
 Asia
Pacific 8
Q3 2011 Real Estate Services Revenue
Americas
EMEA
Leasing
Capital Markets &
Hotels
Property & Facility
Management
Project &
Development Services
Advisory, Consulting
& Other
Total RES
Operating Revenue
$186.9
$36.4
$79.4
$46.1
$30.5
$379.3
22%
44%
27%
13%
9%
23%
$57.5
$59.3
$40.2
$46.3
$44.0
$247.3
20%
91%
23%
59%
54%
46%
$44.5
$21.3
$93.1
$21.7
$19.9
$200.5
26%
16%
23%
13%
19%
22%
$288.9
$117.0
$212.7
$114.1
$94.4
$827.1
23%
57%
25%
28%
29%
Total RES
Revenue
29%
Note: Segment and Consolidated Real Estate Services (“RES”) operating
revenue exclude Equity earnings (losses). ($ in millions; % change in USD )
|
 9
YTD 2011 Revenue Performance
Note: Equity earnings (losses) of $2.7M and ($10.9M) in 2011 and
2010, respectively, are included in segment results, however,
are excluded from Consolidated totals.
Americas
EMEA
Asia Pacific
LIM
$833.1
$1,015.8
2011
2010
Consolidated
$1,969.4
$2,436.4
2011
2010
24%
($ in millions; % change in USD )
$633.3
$491.4
2011
2010
$580.6
$455.3
2011
2010
$178.7
$209.5
2011
2010
22%
29%
28%
17% |
 Asia
Pacific 10
YTD 2011 Real Estate Services Revenue
($ in millions; % change in USD )
Americas
EMEA
Leasing
Capital Markets &
Hotels
Property & Facility
Management
Project &
Development Services
Advisory, Consulting
& Other
Total RES
Operating Revenue
$501.7
$87.9
$220.4
$124.1
$79.1
$1,013.2
22%
79%
21%
12%
(1%)
22%
$155.1
$126.0
$110.3
$130.9
$111.3
$633.6
16%
41%
8%
58%
33%
29%
$123.3
$72.8
$265.8
$60.0
$58.5
$580.4
27%
39%
24%
34%
25%
27%
$780.1
$286.7
$596.5
$315.0
$248.9
$2,227.2
22%
50%
19%
32%
18%
25%
Total RES
Revenue
Note: Segment and Consolidated Real Estate Services (“RES”) operating
revenue exclude Equity earnings (losses). |
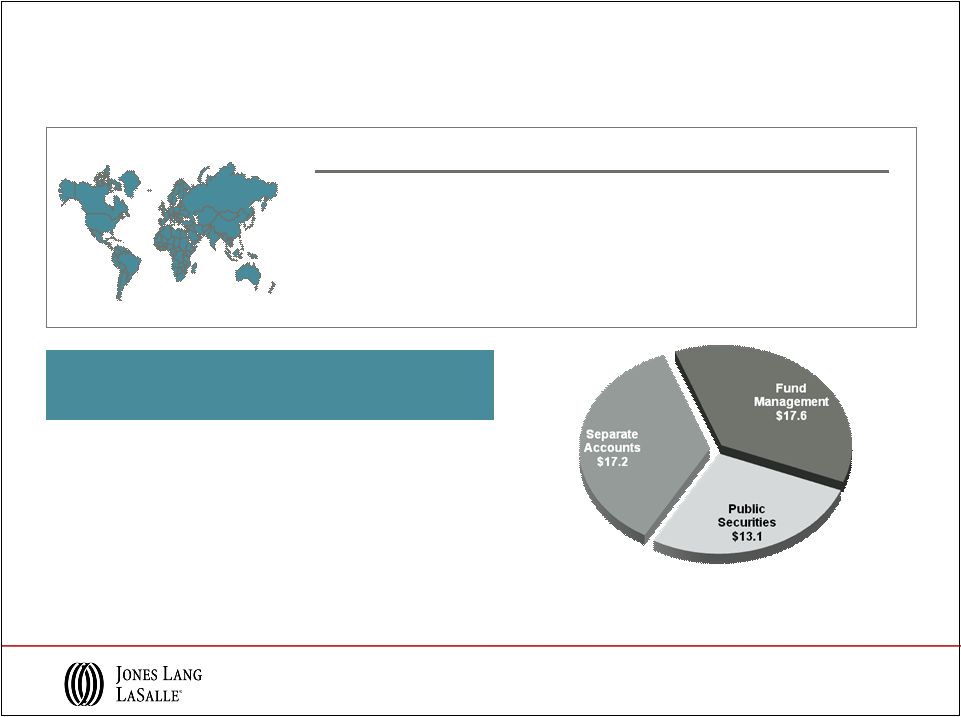 YTD Q3
2011 Highlights LaSalle Investment Management
Product
Assets Under
Management
($ in billions)
Average
Performance
Private Equity
U.K.
$12.0
Above benchmark
Continental Europe
$4.5
Return: >1x equity
North America
$10.1
Above benchmark
Asia Pacific
$8.2
Return: >1x equity
Public Securities
$13.1
Above benchmark
Total Q3 2011 AUM
$47.9 B
AUM by Fund type
Note: AUM data reported on a one-quarter lag
($ in billions)
•
Stable,
high
margin
advisory
fees
augmented
by
incentive
fees
in
Q3
2011
•
Nearly $5 billion of net new capital commitments raised YTD 2011
•
Trinity Funds Management acquisition added $700 million of assets under
management and increased credibility in Australia
11 |
 Solid Cash Flows and Balance Sheet Position
•
Steady quarterly improvement in Cash
from Operations
-
$16 million of restructuring charges
included in Q3 2011 Cash from Earnings
•
2011 acquisition activity supplements
organic growth:
-
King Sturge closed in Q2 2011
-
Second
deferred
Staubach
obligation
paid
in Q3 2011
-
Trinity Funds Management acquired in Q3
2011; $23 million of related co-investment
funded in Q3 2011
•
Investment grade ratings
Standard & Poor’s:
BBB-
(Outlook: Stable)
Moody’s Investor Services:
Baa2
(Outlook: Stable)
($ in millions)
YTD Q3 2011 Highlights
2011
Q1
Q2
Q3
Cash Flows
Cash from Earnings
$42
$81
$68
Working Capital
(239)
(20)
27
Cash from / (used in) Operations
($197)
$61
$95
Primary Uses
Capital Expenses
(17)
(19)
(20)
Acquisitions & Deferred Payment Obligations
(25)
(210)
(162)
Co-Investment
(2)
2
(47)
Dividends
-
(7)
-
Net Cash Outflows
($44)
($234)
($228)
Net Share Activity & Other Financing
(4)
(2)
(8)
Net Bank Debt (Borrowings) / Repayments
($245)
($175)
($141)
Balance Sheet
Cash
$101
$96
$86
Short Term Borrowings
42
45
54
Credit Facility
278
444
567
Net Bank Debt
$219
$393
$535
Deferred Business Obligations
293
439
292
Total Net Debt
$512
$832
$827
Net Interest Expense
$8.0
$9.6
$9.7
12 |
 Appendix |
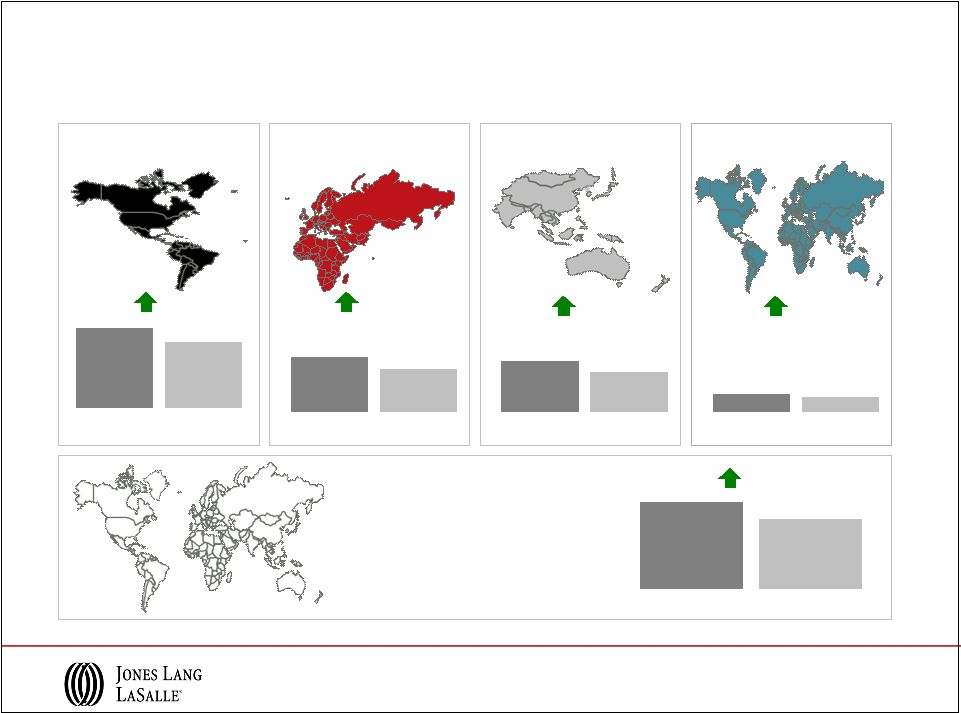
 Capital Values
Capital Value
growth slowing
Capital Value
growth
accelerating
Capital Values
bottoming out
Capital Values
falling
Q3 2010
London
Washington DC
Paris,
Seoul
Beijing
Capital Value
growth slowing
Capital Value
growth
accelerating
Capital Values
bottoming out
Capital Values
falling
Hong Kong
Detroit
Dallas
Brussels, Madrid
Shanghai
Milan,
Mumbai,
Sydney
New York, Sao Paulo
Chicago, San Francisco
Toronto,
Singapore
Berlin, Stockholm, Tokyo
Q3 2011
Hong Kong
Washington DC
London
Moscow, Paris
Chicago,
Stockholm
Atlanta, Dallas
Frankfurt, Milan
Brussels
Seoul
Madrid ,
Tokyo Moscow
Atlanta,
Frankfurt
Detroit
Berlin,
Toronto
San Francisco, Beijing
New York, Sao Paulo
Shanghai
Singapore
Sydney
Mumbai
Americas
EMEA
Asia Pacific
As of Q3 2011
The Jones Lang LaSalle Property Clocks
SM
14 |
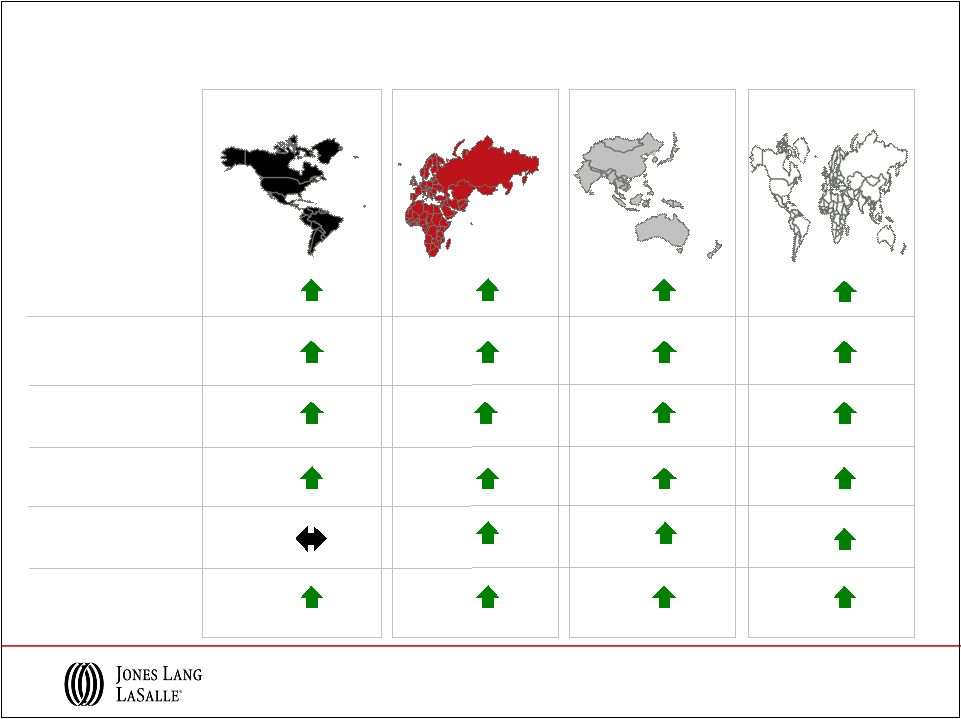
 Leasing Market Fundamentals
Q3 2011
As of Q3 2011
The Jones Lang LaSalle Property Clocks
SM
Rental Value
growth slowing
Rental Value
growth
accelerating
Rental Values
bottoming out
Rental Values
falling
Paris, Stockholm
Mumbai, Sydney, Tokyo
Hong Kong
London,
Shanghai Milan, Johannesburg
Chicago
Madrid,
Seoul
Rental Value
growth slowing
Rental Values
falling
Rental Value
growth
accelerating
Rental Values
bottoming out
Detroit
Los Angeles
San Francisco
Berlin
Moscow
Q3 2010
Mexico City
Singapore
New York,
Brussels, Frankfurt
Atlanta, Dallas, Toronto, Rome
Dubai
Washington DC
Sao Paulo
Beijing
Detroit,
Dubai
Seoul
San Francisco
New York
Washington DC, Toronto, Milan
Dallas,
Mumbai
Atlanta
Frankfurt
Johannesburg
Chicago
Rome
Tokyo
Los Angeles
Brussels
Madrid
Berlin,
Sydney
Stockholm
Sao Paulo,
Paris
Beijing
London
Moscow
Mexico City
Hong Kong
Singapore
Shanghai
Americas
EMEA
Asia Pacific
15 |
 16
Q3 2011 Adjusted EBITDA* Performance
Americas
EMEA
Asia Pacific
LIM
$46.5
$46.0
2011
2010
Consolidated
$93.7
$78.7
2011
2010
* Refer to slide 18 for Reconciliation of GAAP Net Income to adjusted EBITDA for the
three months ended September 30, 2011, and 2010, for details relative to these adjusted
EBITDA calculations. Segment EBITDA is calculated by adding the segment’s
Depreciation and amortization to its reported Operating income, which excludes Restructuring and
acquisition charges. Consolidated adjusted EBITDA is the sum of the EBITDA of the four
segments less net income attributable to non-controlling interests and dividends on
unvested common stock.
($ in millions)
$10.4
$7.4
2011
2010
$17.0
$11.0
2011
2010
$19.8
$13.6
2011
2010 |
 17
YTD 2011 Adjusted EBITDA* Performance
Americas
EMEA
Asia Pacific
LIM
$107.1
$105.2
2011
2010
Consolidated
$216.0
$193.7
2011
2010
* Refer to slide 18 for Reconciliation of GAAP Net Income to adjusted EBITDA for the
nine months ended September 30, 2011, and 2010, for details relative to these adjusted
EBITDA calculations. Segment EBITDA is calculated by adding the segment’s
Depreciation and amortization to its reported Operating income, which excludes Restructuring and
acquisition charges. Consolidated adjusted EBITDA is the sum of the EBITDA of the four
segments less net income attributable to non-controlling interest and, dividends on
unvested common stock.
($ in millions)
$12.7
$14.3
2011
2010
$50.2
$33.7
2011
2010
$45.8
$33.0
2011
2010 |
 18
($ in millions)
Reconciliation of GAAP Net Income to Adjusted EBITDA
Three Months Ended
September 30,
Nine Months Ended
September 30,
2011
2010
2011
2010
Net income attributable to common
shareholders
$33.9
$37.1
$79.2
$69.1
Add:
Interest expense, net of interest income
9.7
11.5
27.2
35.7
Provision for income taxes
11.3
26.9
20.8
Depreciation and amortization
22.8
17.7
60.5
53.0
EBITDA
$ 77.7
$ 77.4
$ 193.8
$ 178.6
Restructuring and acquisition charges
16.0
0.4
22.2
5.5
Non-cash co-investment charges
-
0.9
-
9.6
Adjusted EBITDA
$ 93.7
$ 78.7
$ 216.0
$ 193.7
11.1 |
 19
($ in millions)
Reconciliation of GAAP Net Income to Adjusted Net Income
Three Months Ended
September 30,
Nine Months Ended
September 30,
2011
2010
2011
2010
GAAP Net income attributable to common
shareholders
$ 33.9
$ 37.1
$ 79.2
$ 69.1
Shares (in 000s)
44,355
44,089
44,377
44,064
GAAP earnings per share
$ 0.76
$ 0.84
$ 1.79
$ 1.57
GAAP Net income attributable to common
shareholders
$ 33.9
$ 37.1
$ 79.2
$ 69.1
Restructuring and acquisition charges, net
12.0
0.3
16.6
4.2
Intangible amortization, net
3.7
-
5.0
-
Non-cash co-investment charges, net
-
0.7
-
7.4
Adjusted net income
$ 49.6
$ 38.1
$ 100.8
$ 80.7
Shares (in 000s)
44,355
44,089
44,377
44,064
Adjusted earnings per share
$ 1.12
$ 0.86
$ 2.27
$ 1.83 |