Attached files
| file | filename |
|---|---|
| 8-K - GLU MOBILE INC. 8-K - GLU MOBILE INC | a50055354.htm |
| EX-99.01 - EXHIBIT 99.01 - GLU MOBILE INC | a50055354_ex9901.htm |
Exhibit 99.02

Glu Mobile November 2011 Update
Safe-Harbor Statement This presentation contains "forward-looking" statements including those regarding expected growth in smartphone and tablet penetration, mobile broadband connections and app downloads, our expectations for global gaming revenues in 2011 and 2012, the file sizes of our expected 2012 title roadmap, the expected launch of Glu.cn in early, 2012, our guidance for the fourth quarter of 2011 and our target operating model, the anticipated benefits of our acquisitions of Blammo and Griptonite, our expectation that these acquisitions will approximately double our internal studio capacity, our expectation that our smartphone revenues will increase by approximately 90% in the second half of 2012 compared with the second half of 2011, and our expectation that we will begin generating freemium revenues from Griptonite by the second quarter of 2012. These forward-looking statements are subject to material risks and uncertainties that could cause actual results to differ materially from those in the forward-looking statements. Investors should consider important risk factors, which include: the risk that Glu will be unable to successfully integrate both acquired companies and its employees and achieve expected synergies, the risk that Glu will have difficulty retaining key employees of the acquired companies; the risk that consumer demand for smartphones, tablets and next-generation platforms does not grow as significantly as we anticipate or that we will be next unable to capitalize on any such growth; the risk that we do not realize a sufficient return on our investment with respect to our efforts to develop social, freemium games for smartphones and tablets, the risk that our development expenses for games for smartphones are greater than we anticipate; the risk that our recently and newly launched games are less popular than anticipated; the risk that our newly released games will be of a quality less than desired by reviewers and consumers; the risk that the mobile games market, particularly with respect to social, freemium gaming, is smaller than anticipated; and other risks detailed under the caption "Risk Factors" in our Form 10-Q filed with the Securities and Exchange Commission on August 15, 2011 and our other SEC filings. You can locate these reports through our website at http://www.glu.com/investors. These "forward-looking" statements are based on estimates and information available to us on November 3, 2011 and we are under no obligation, and expressly disclaim any obligation to update or alter our forward-looking statements whether as a result of new information Page 2 obligation, forward information, future events or otherwise. © Glu Mobile Inc. – Proprietary
Financial Measures Use of Non-GAAP Glu uses in this presentation certain non-GAAP measures of financial performance. The presentation of these non-GAAP financial measures is not intended to be considered in isolation from, as a substitute for, or superior to, the financial information prepared and presented in accordance with GAAP, and may be different from non-GAAP financial measures used by other companies. In addition, these non-GAAP measures have limitations in that they do not reflect all of the GAAP amounts associated with Glu's results of operations as determined in accordance with GAAP. The non-GAAP financial measures used by Glu include non-GAAP revenues, non-GAAP smartphone revenues, non-GAAP freemium revenues, non-GAAP gross margins, non-GAAP operating margin, non-GAAP loss, non-GAAP loss EPS and EBITDA. These non-GAAP financial measures exclude the following items from Glu's unaudited consolidated statements of operations: •Change in deferred revenues and costs of revenues; •Amortization of in-process development contracts; •Amortization of intangible assets; •Stock-based compensation expense; •Restructuring charges; •Change in fair value of Blammo earnout; •Transitional costs; and •Foreign currency exchange gains and losses primarily related to the revaluation of assets and liabilities. Glu believes that these non-GAAP financial measures, when taken together with the corresponding GAAP financial measures, provide meaningful supplemental information regarding Glu's performance by excluding certain items that may not be indicative of Glu's core business, operating results or future outlook. Glu's management uses, and believes that investors benefit from referring to, these non-GAAP financial measures in assessing Glu's operating results, as well as when planning, forecasting and analyzing future periods. These non-GAAP financial measures also facilitate comparisons of Glu's performance to prior periods. For a reconciliation of these non-GAAP financial measures to their most directly comparable GAAP financial measures, please refer to the tables attached to Glu’s earnings press release for the quarter ended September 30, 2011, which is available on our website at http://www.glu.com/investors.

Agenda • Who is Glu • Growth Opportunity • Business model • Upcoming product launches • Financials & Guidance Page 4
Who is Glu?
Gaming Company of Tomorrow Intersection of Two Rising Tides: 1) Growth in gaming on mobile devices 2) Growth in freemium & social gaming © Glu Mobile Inc. – Proprietary Page 6

Experienced Niccolo de Masi, Chief Executive Officer and President • Former CEO of Hands-On Mobile Monstermob Gro p Management • Former CEO of Group • Cambridge University (M.A. and Msci degrees) Eric R. Ludwig, Chief Financial Officer and EVP g, • Former CFO of Instill Corporation • Former Controller of Camstar Systems • Price Waterhouse L.L.P. • Santa Clara University B S (B.S. in Commerce) and CPA (inactive) Kal Iyer, SVP, Research and Development • Former VP Tech Services of Glu Mobile • Mobile architecture and infrastructure at Pumatech • B.S. in Mathematics from Jabalpur University, India. Flanders SVP Sales & Marketing Adam Flanders, SVP, • Formerly at THQ Wireless, Ernst & Young LLP and Fidelity Investments • B.S. in Finance from Bentley University, Waltham MA Page 7 © Glu Mobile Inc. – Proprietary
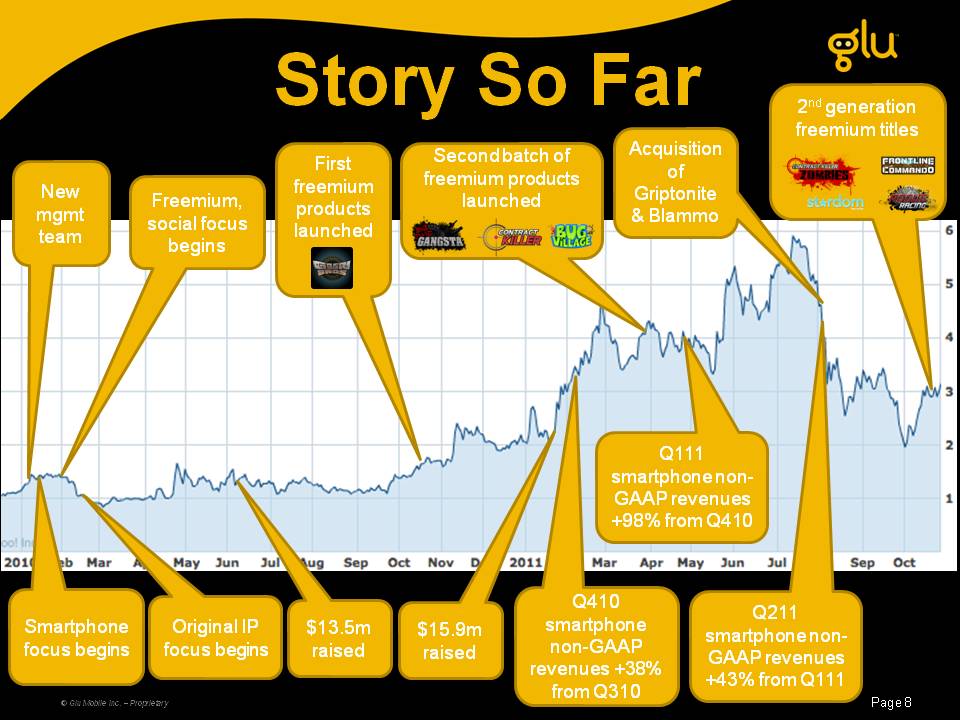
Story So Far 2nd ti New Freemium, First freemium products Second batch of freemium products Acquisition Of Griptonite generation freemium titles mgmt team social focus begins launched launched & Blammo Q111 smartphone non-GAAP revenues % f Q Q410 +98% from Q410 Q211 © Glu Mobile Inc. – Proprietary Page 8 Smartphone focus begins $13.5m raised $15.9m raised Original IP focus begins smartphone non-GAAP revenues +38% from Q310 smartphone non-GAAP revenues +43% from Q111 Growth

Growth Opportunity
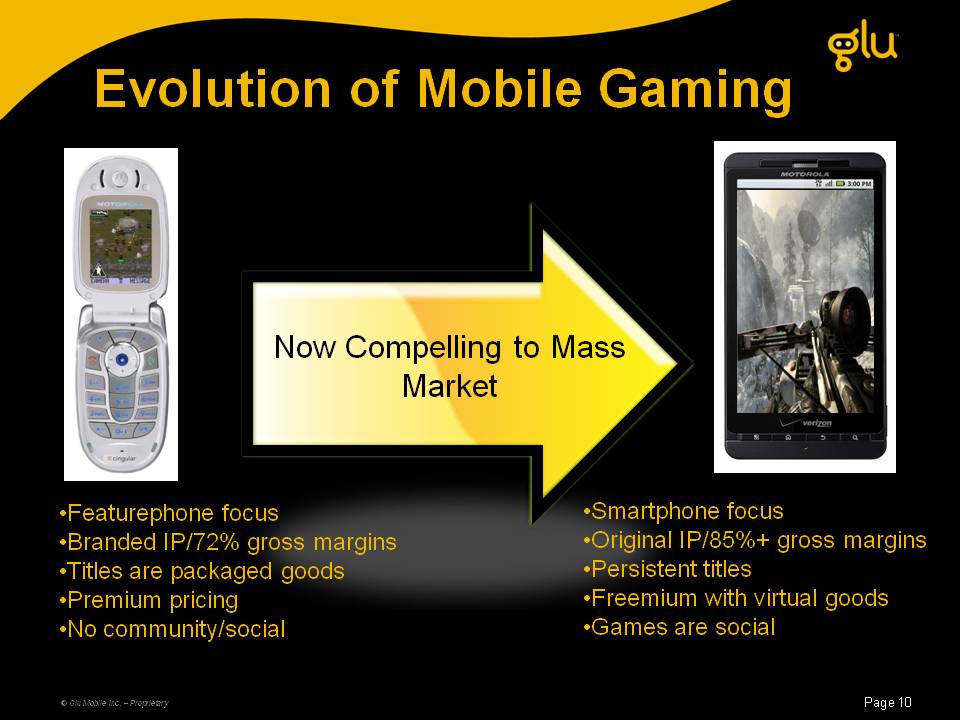
Evolution Now Compelling to Mass Market •Featurephone focus ••Branded IP/72% gross margins •Titles are packaged goods •Premium pricing Smartphone focus •Original IP/85%+ gross margins •Persistent titles •Freemium with virtual goods G •No community/social •Games are social Page 10 © Glu Mobile Inc. – Proprietary
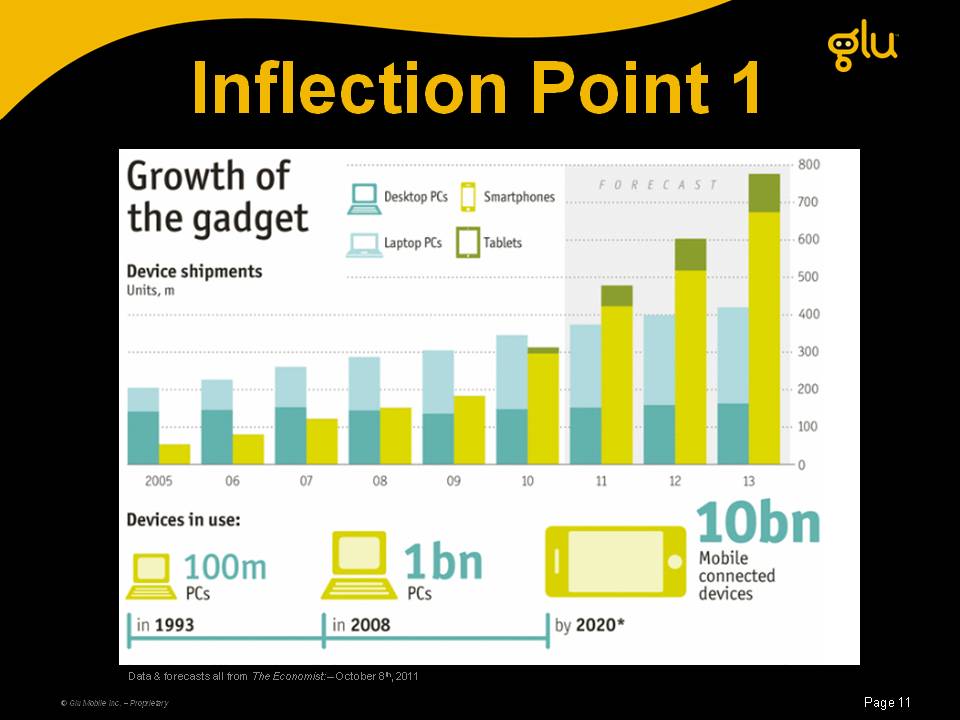
Inflection Point 1 © Glu Mobile Inc. – Proprietary Page 11 Data & forecasts all from The Economist: – October 8th, 2011 Growth of the gadget Device shipments
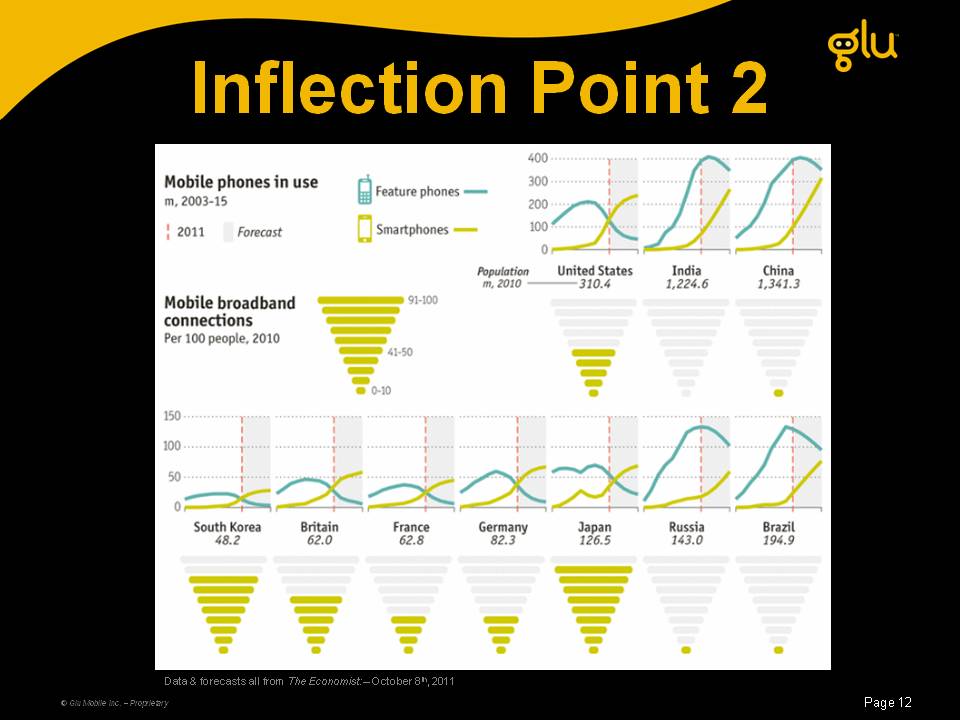
Inflection Point 2 © Glu Mobile Inc. – Proprietary Page 12 Data & forecasts all from The Economist: – October 8th, 2011
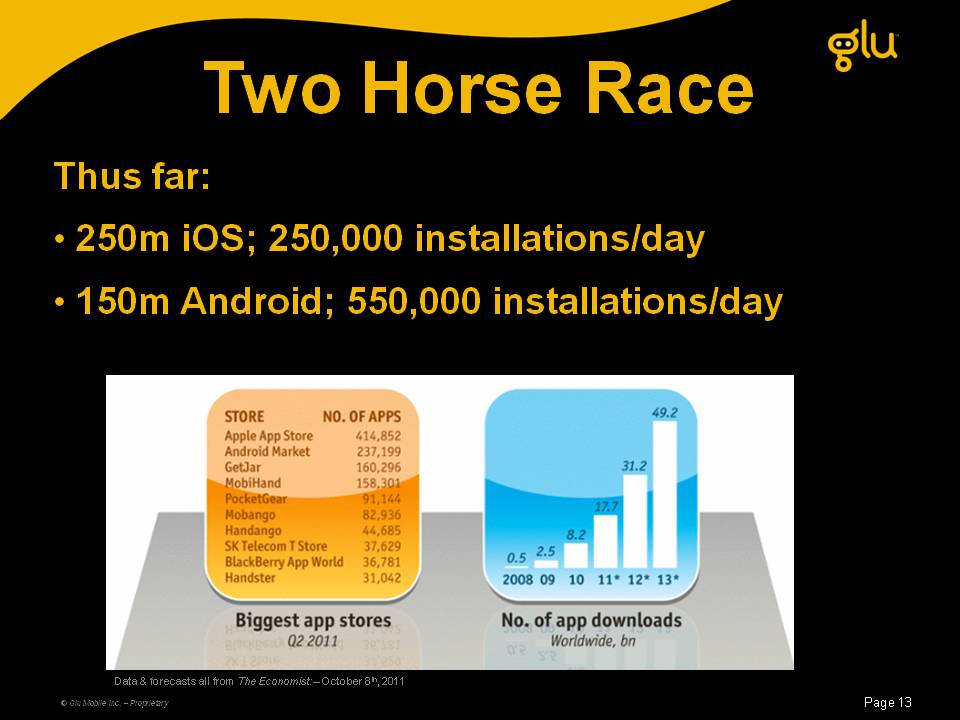
Two Horse Race Thus far: • 250m iOS; 250,000 installations/day • Android; 550 000 installations/day 150m 550,000 Page 13 © Glu Mobile Inc. – Proprietary Data & forecasts all from The Economist: – October 8th, 2011
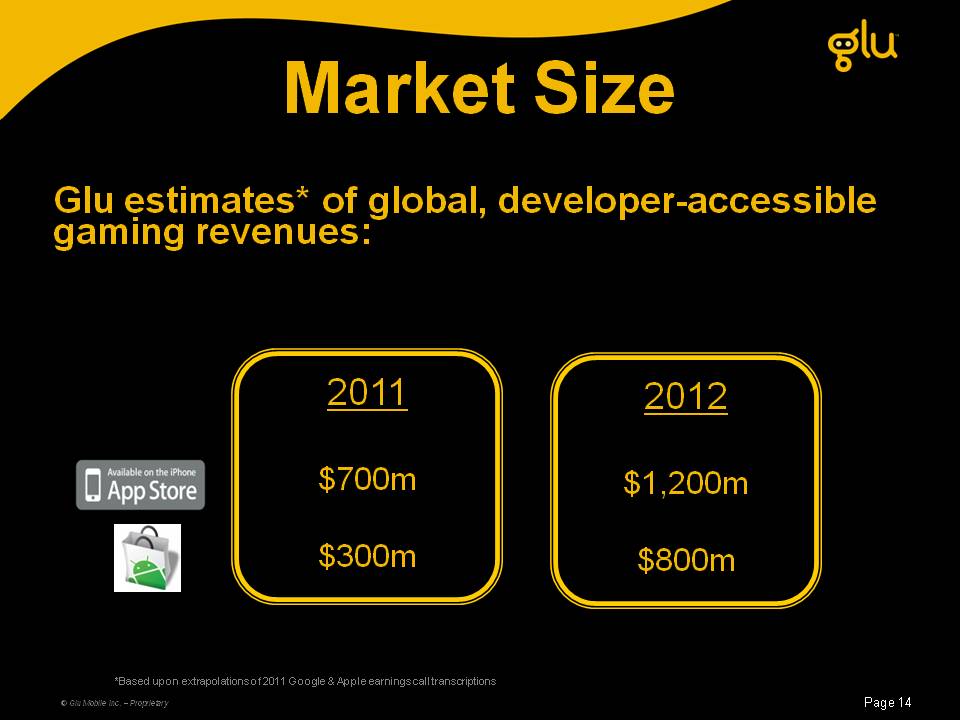
Market Size Glu estimates* of global developer-accessible estimates global, developer gaming revenues: 2011 2012 $700m $1,200m $300m $800m Page 14 © Glu Mobile Inc. – Proprietary *Based upon extrapolations of 2011 Google & Apple earnings call transcriptions

Business Model
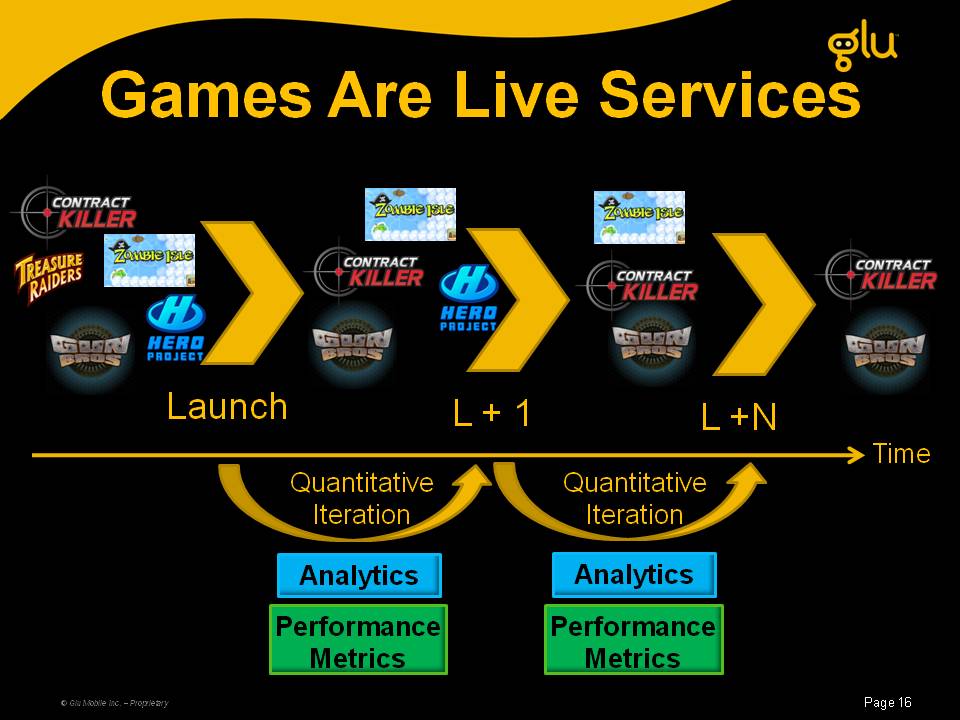
Games Are Live Services Launch L L + 1 +N Time Quantitative Iteration Quantitative Iteration Analytics Analytics © Glu Mobile Inc. – Proprietary Performance Metrics Performance Metrics Page 16
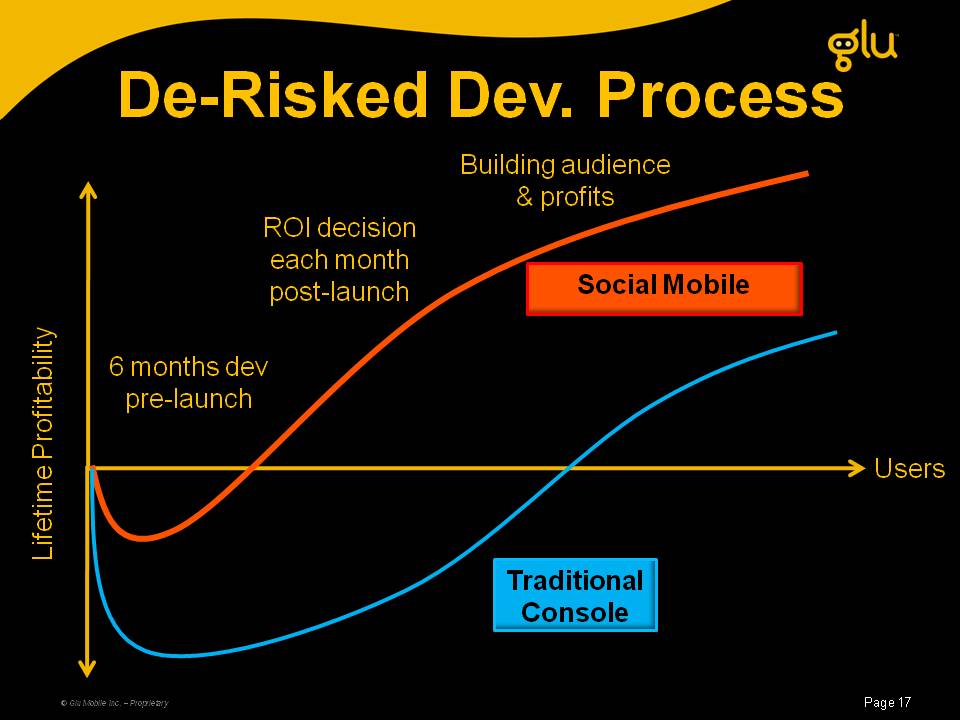
De-Risked Dev Dev. Process Building audience & profits Social Mobile ROI decision each month post-launch Fitability 6 months dev pre-launch Users time Prof p Lifet Traditional Console © Glu Mobile Inc. – Proprietary Page 17
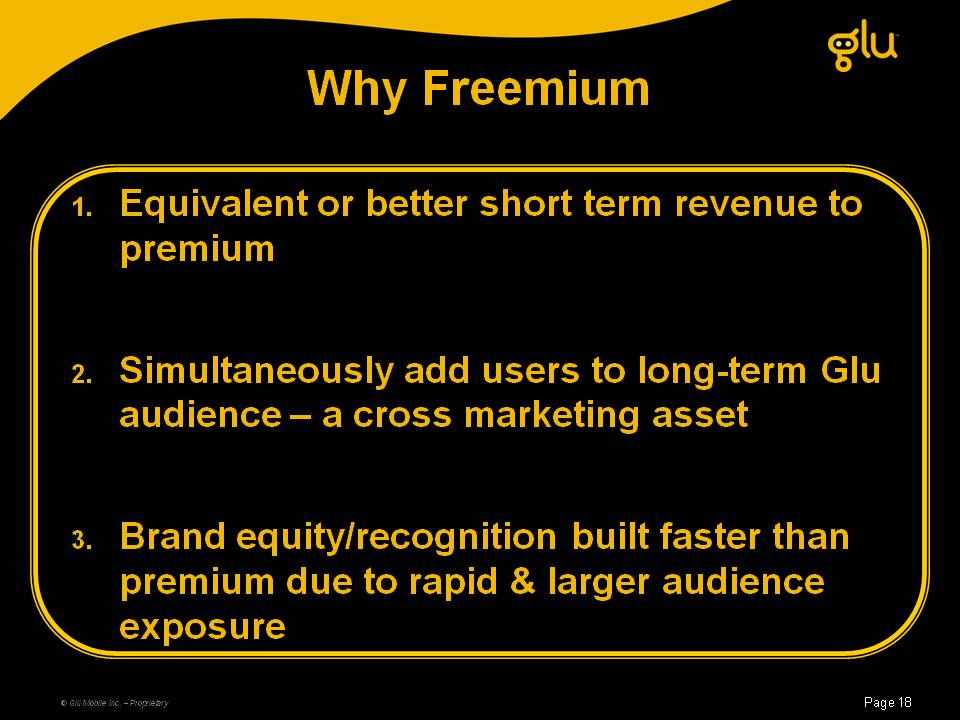
Why Freemium 1 Equivalent or better short term revenue to 1. Premium 2. Simultaneously add users to long-term Glu audience a – cross marketing asset 3. Brand equity/recognition built faster than premium due to rapid & larger audience © Glu Mobile Inc. – Proprietary Page 18 exposure
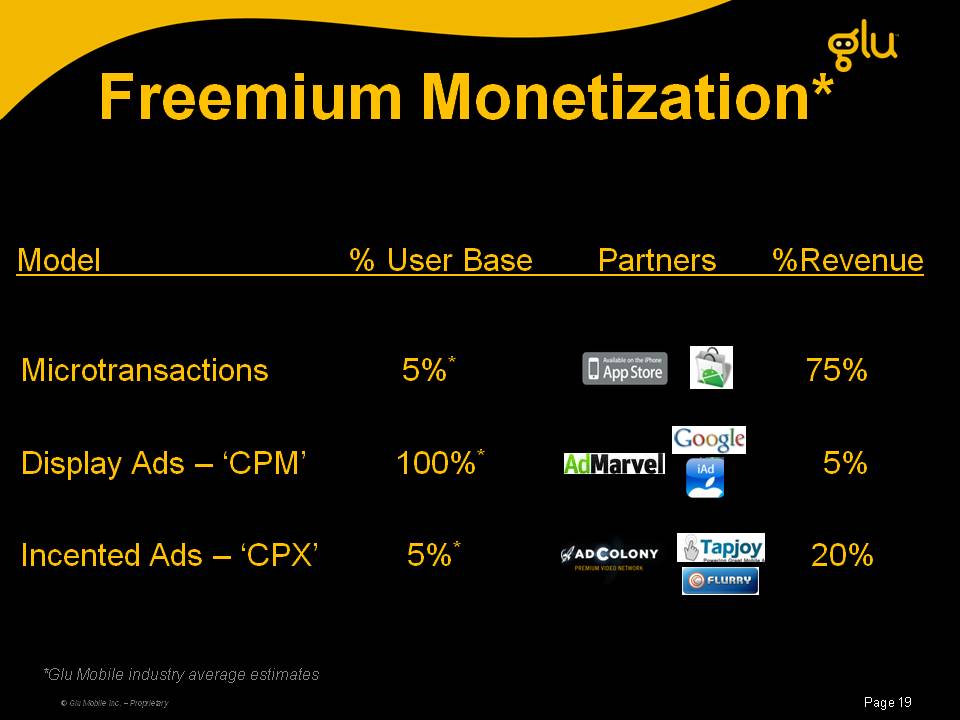
Freemium Monetization* Monetization Model % User Base Partners %Revenue Microtransactions 5%* 75% Display Ads – ‘CPM’ 100%* 5% Incented Ads – ‘CPX’ 5%* 20% Page 19 *Glu Mobile industry average estimates © Glu Mobile Inc. – Proprietary
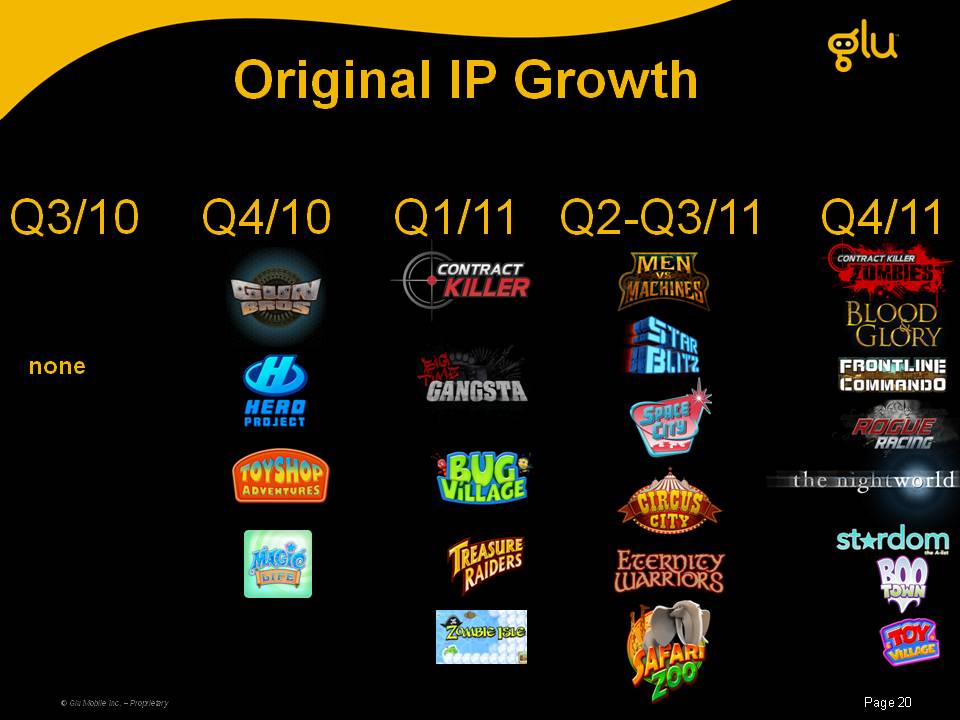
Original IP Growth Q3/10 Q4/10 Q1/11 Q2 Q3/11 Q2-Q4/11 none © Glu Mobile Inc. – Proprietary Page 20
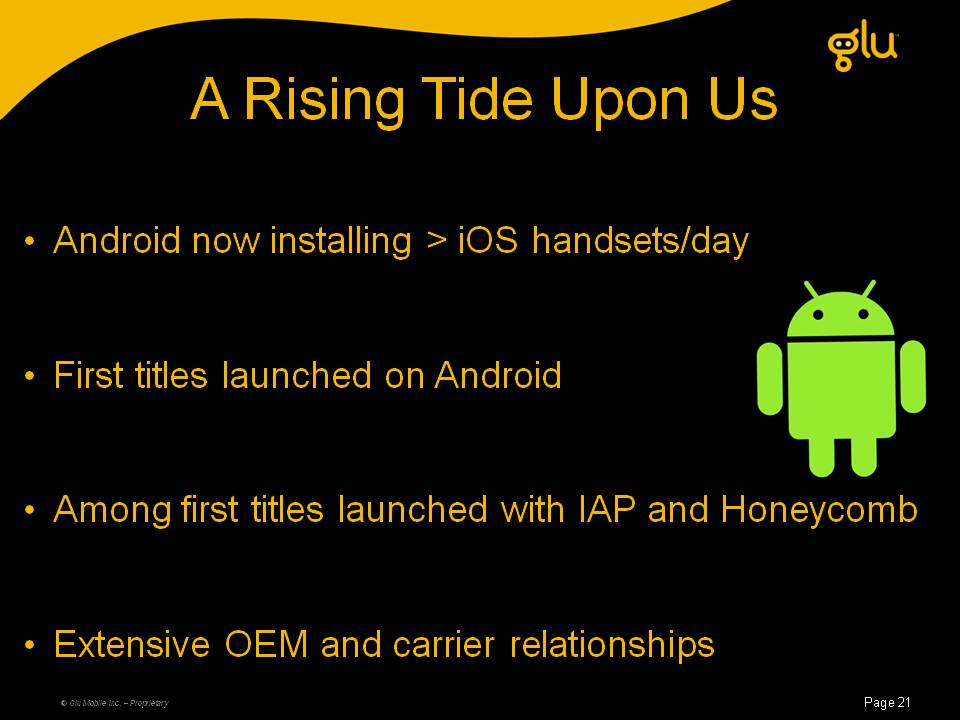
A Rising Tide Upon Us • Android now installing > iOS handsets/day • First titles launched on Android • Among first titles IAP and launched with Honeycomb © Glu Mobile Inc. – Proprietary Page 21 • Extensive OEM and carrier relationships
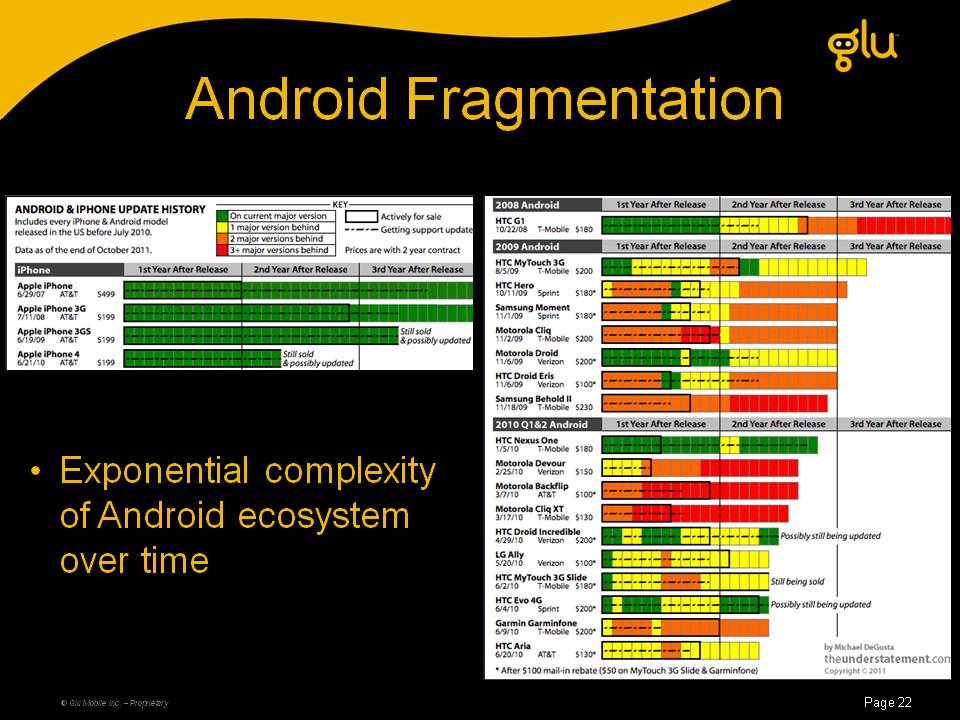
Android Fragmentation • Exponential complexity of Android ecosystem over time © Glu Mobile Inc. – Proprietary Page 22
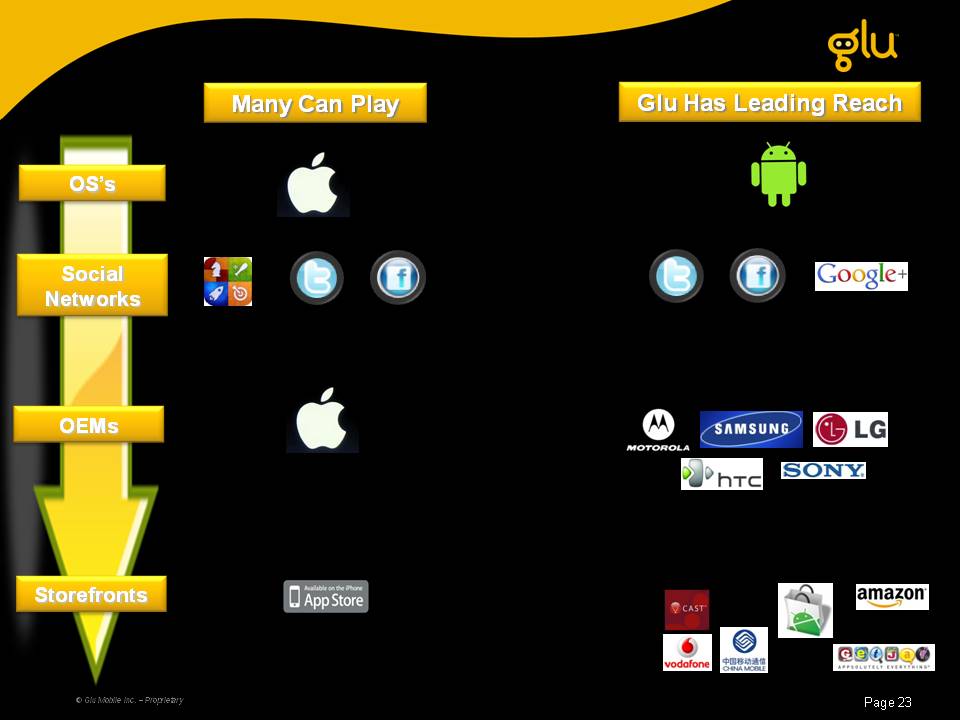
Many Glu Has Leading Reach Can Play OS’s Social Networks OEMs Storefronts Page 23 © Glu Mobile Inc. – Proprietary
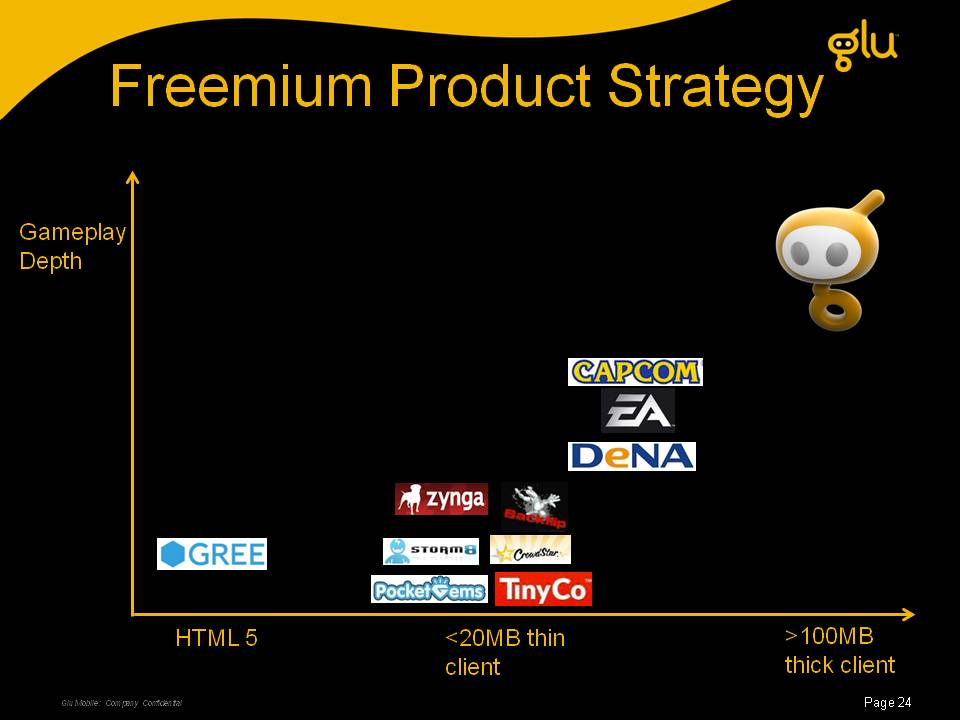
Freemium Product Strategy Gameplay Depth Glu Mobile: Company Confidential Page 24 HTML 5 <20MB thin Client >100MB thick client
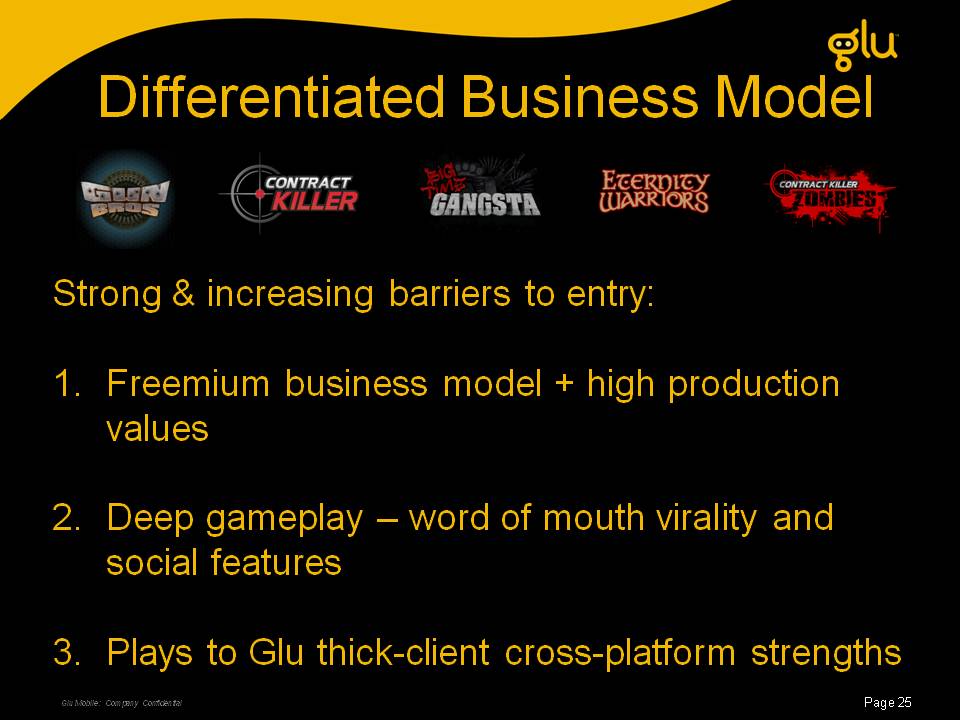
Differentiated Business Model Strong & increasing barriers to entry: 1. Freemium business model + high production Values 2 Deep gameplay word of mouth virality and 2. – social features Glu Mobile: Company Confidential Page 25 3. Plays to Glu thick-client cross-platform strengths
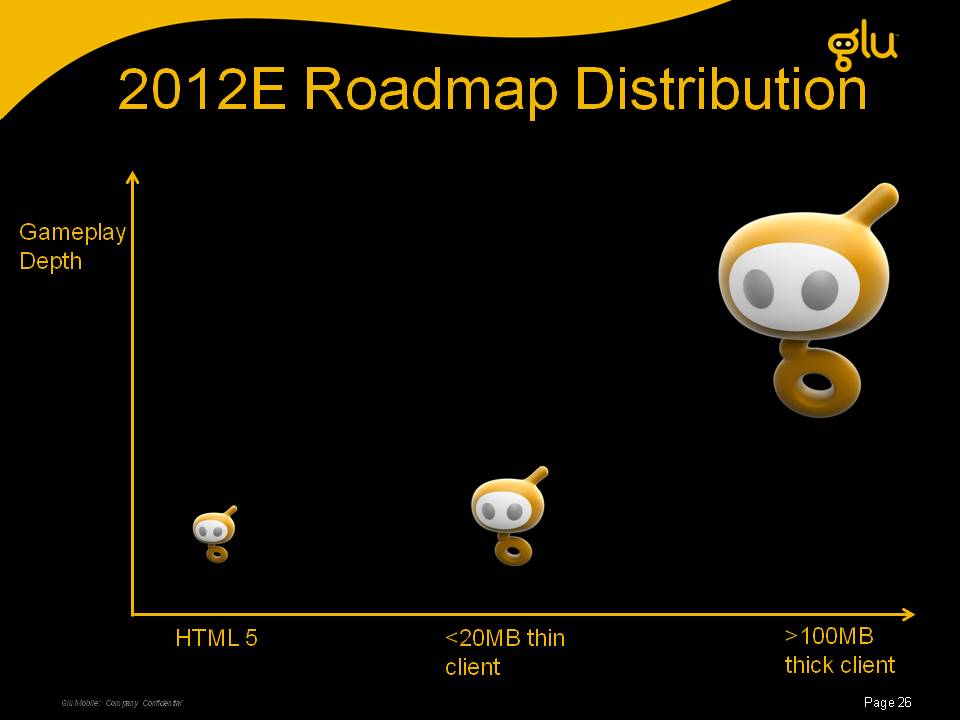
2012E Roadmap Distribution Gameplay Depth Glu Mobile: Company Confidential Page 26 HTML 5 <20MB thin Client >100MB thick client
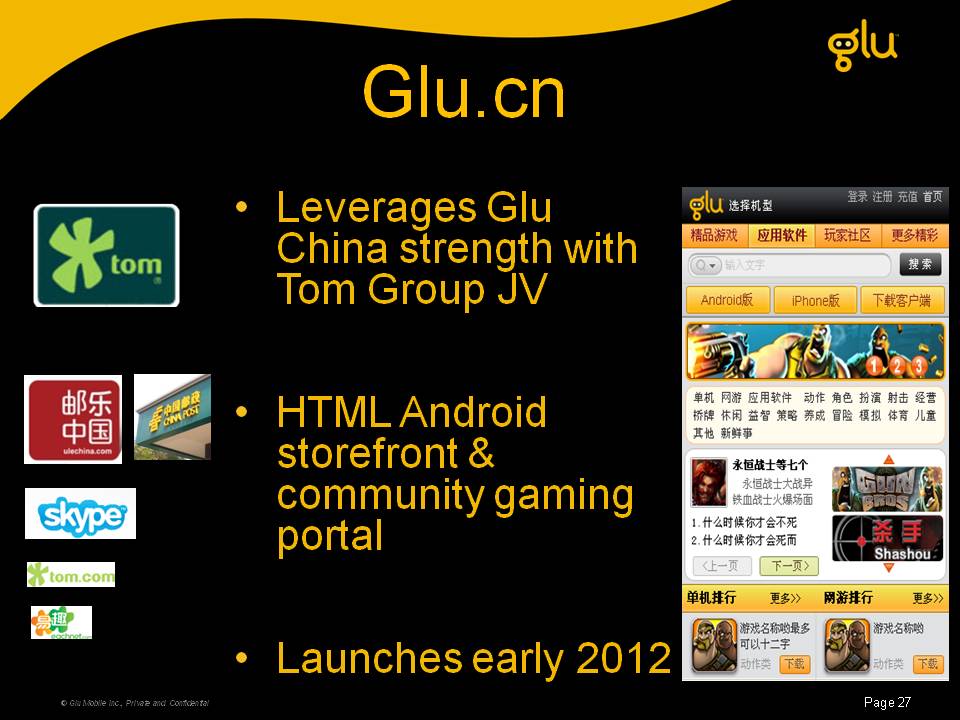
Glu Glu.cn • Leverages Glu China strength with Tom Group JV p • HTML Android storefront & community gaming portal © Glu Mobile Inc., Private and Confidential Page 27

Q4 Line Up © Glu Mobile Inc. – Proprietary

Financials
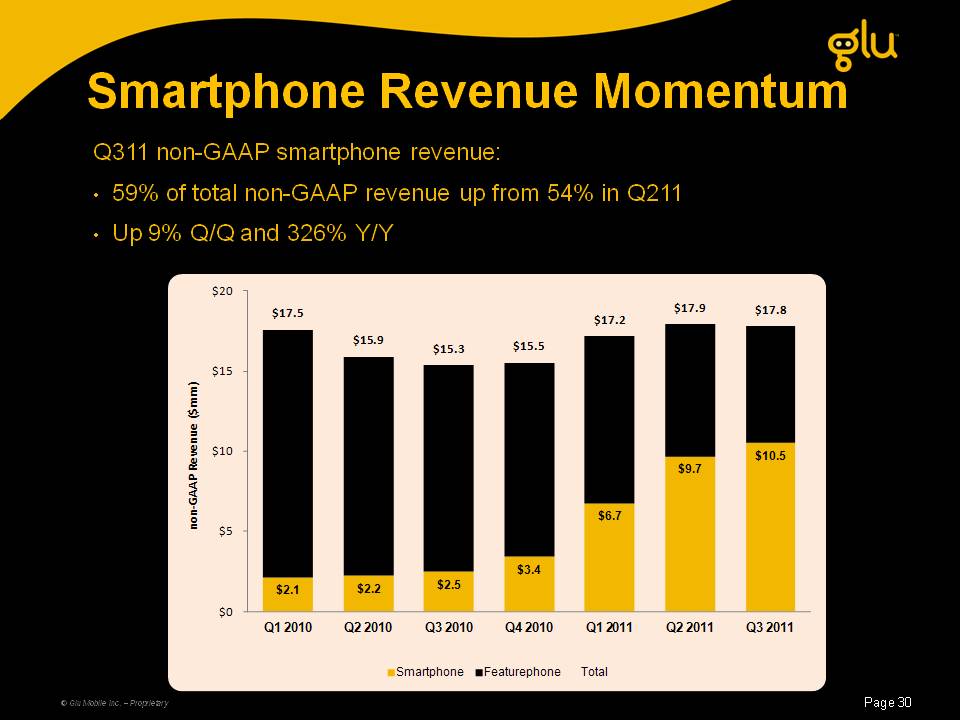
Smartphone Revenue Momentum Q311 non-GAAP smartphone revenue: • 59% of total non-GAAP revenue up from 54% in Q211 • Up 9% Q/Q and 326% Y/Y $ $17 9 $17 8 $20 17.5 $15.9 $15.3 $15.5 $17.2 17.9 17.8 $15 $mm) $6 7 $9.7 $10.5 $10 n‐GAAP Revenue ($ $2.1 $2.2 $2.5 $3.4 6.7 $ 0 $5 non Page 30 © Glu Mobile Inc. – Proprietary (in millions of dollars) Q1 2010 Q2 2010 Q3 2010 Q4 2010 Q1 2011 Q2 2011 Q3 2011 Smartphone Featurephone Total
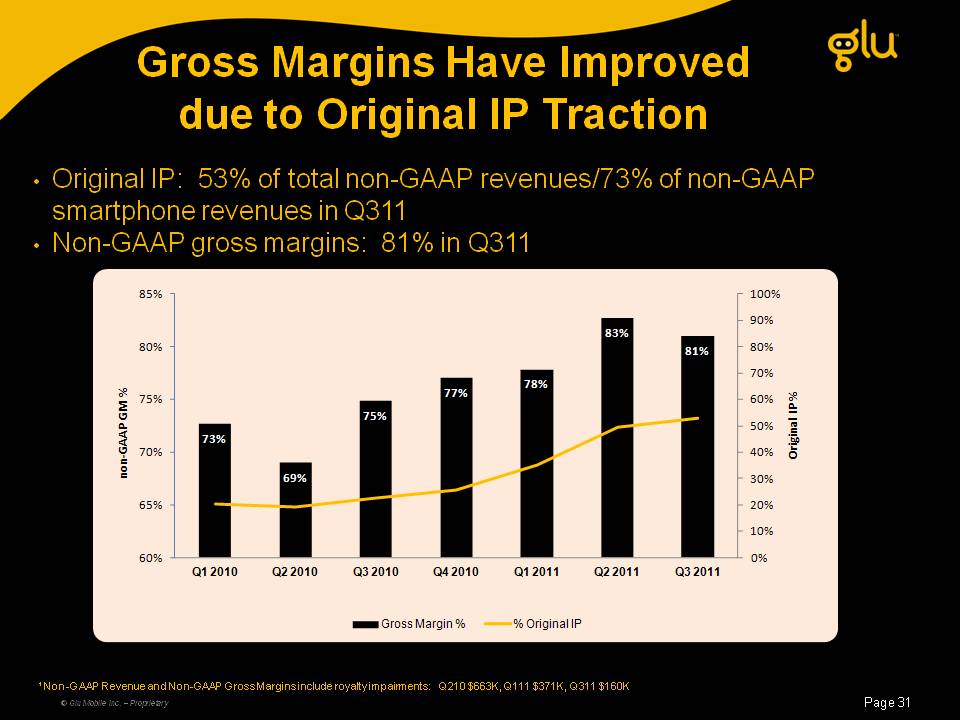
Gross Margins Have Improved due to Original IP Traction • Original IP: 53% of total non-GAAP revenues/73% of non-GAAP smartphone revenues in Q311 • Non-GAAP gross margins: 81% in Q311 100% 85% 77% 78% 83% 81% 60% 70% 80% 90% 75% 80% P % M % 73% 69% 75% 20% 30% 40% 50% 65% 70% Original I non‐GAAP G 0% 10% 60% Q1 2010 Q2 2010 Q3 2010 Q4 2010 Q1 2011 Q2 2011 Q3 2011 Page 31 ¹ Non-GAAP Revenue and Non-GAAP Gross Margins include royalty impairments: Q210 $663K, Q111 $371K, Q311 $160K © Glu Mobile Inc. – Proprietary Gross Margin % % Original IP
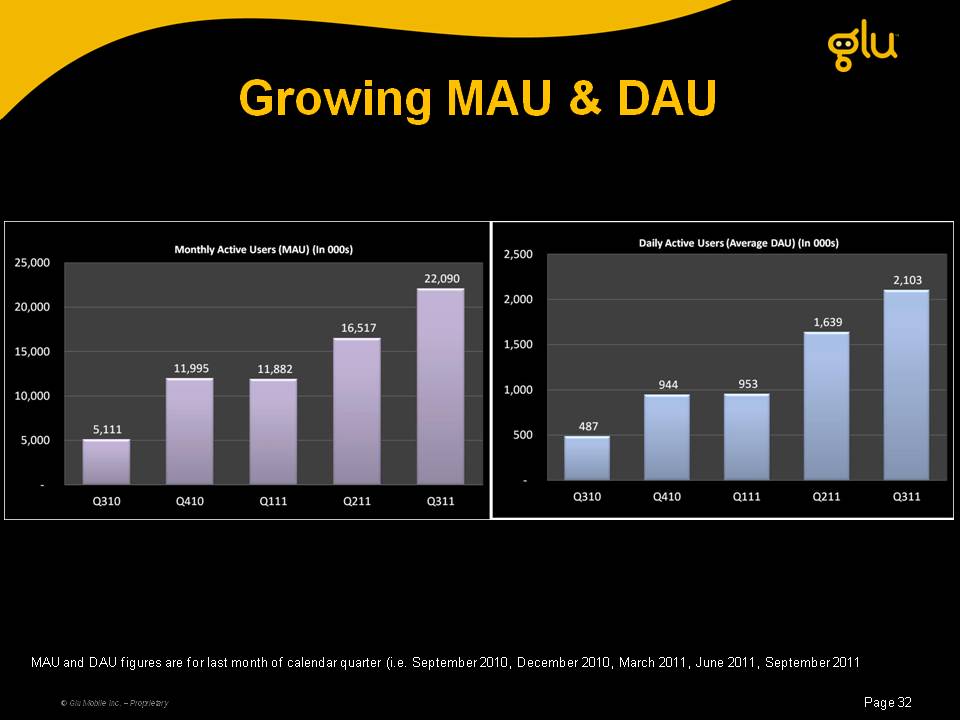
Growing MAU & DAU MAU and DAU figures for Q410 are averages for December 2010 and for Q111 are averages for January 2011. Page 32 © Glu Mobile Inc. – Proprietary MAU and DAU figures are for last month of calendar quarter (i.e. September 2010, December 2010, March 2011, June 2011, September 2011
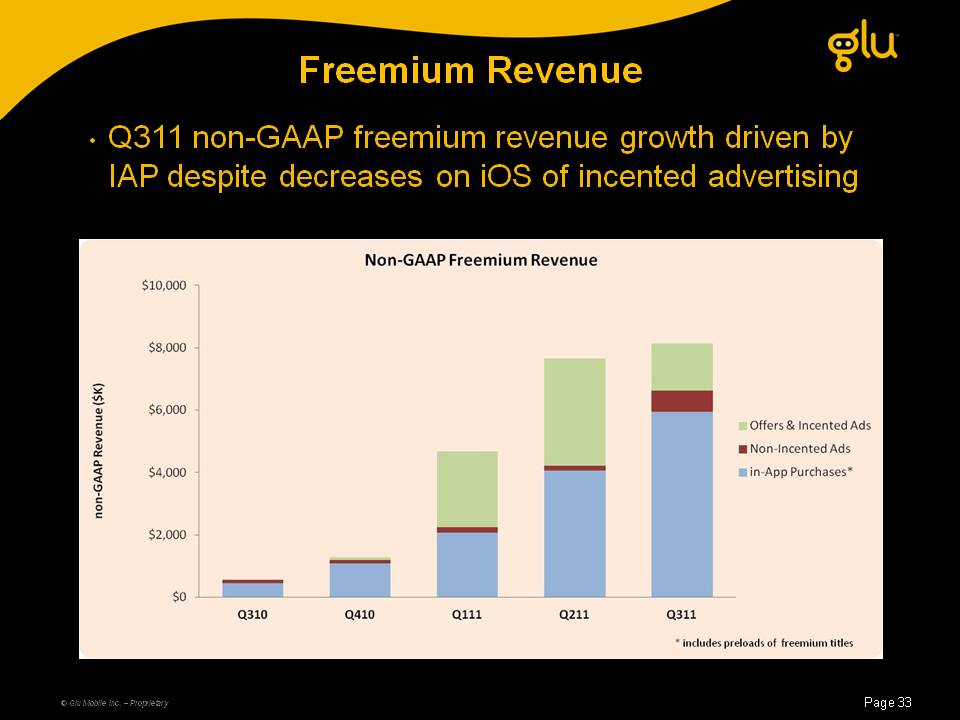
Freemium Revenue • Q311 non-GAAP freemium revenue growth driven by IAP despite decreases on iOS of incented advertising (in thousands of dollars) Page 33 *Includes preloads of freemium titles $10,000 $8,000 $6,000 $4,000 $2,000 $0 Q310 Q410 Q111 Q211 Q311 Offers & Incented Ads Non-Incented Ads in-App Purchases*

Q411 Guidance and Long Term Model
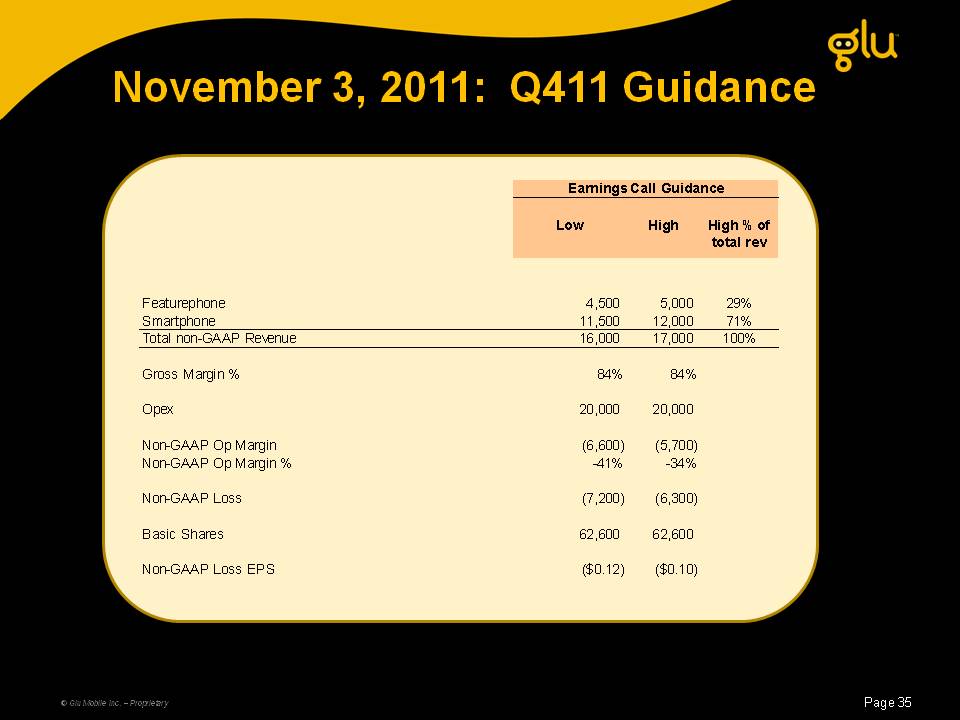
November 2011: Q411 Guidance Earnings Call Guidance Low High High % of total rev Featurephone 4,500 5,000 29% Smartphone 11,500 12,000 71% Total non-GAAP Revenue 16,000 17,000 100% Gross Margin % 84% 84% Opex 20 000 20 000 20,000 20,000 Non-GAAP Op Margin (6,600) (5,700) Non-GAAP Op Margin % -41% -34% Non-GAAP Loss (7,200) (6,300) Basic Shares 62,600 62,600 Non-GAAP Loss EPS ($0.12) ($0.10) Page 35 © Glu Mobile Inc. – Proprietary
Recent Acquisitions • Griptonite approximately doubles Glu’s internal capacity • Blammo brings casual social gaming DNA • Glu + Grip + Blammo = expect at least 90% growth of smartphone revenues 2H11 to 2H12 © Glu Mobile Inc. – Proprietary Page 36
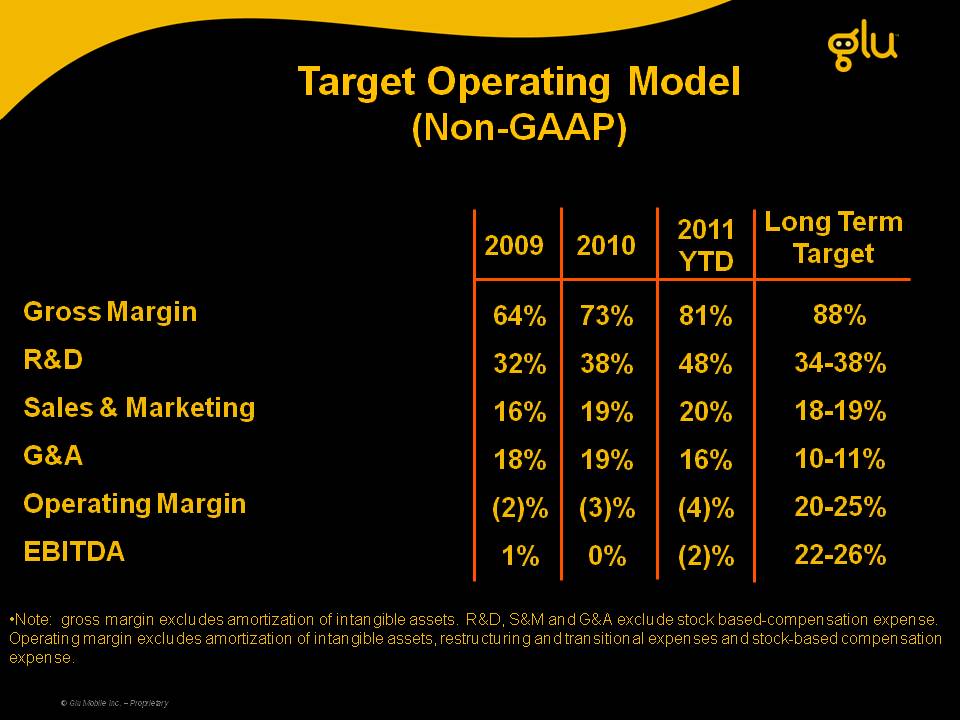
Target Operating Model (Non-GAAP) Gross 88% Long Term Target 73% 2010 81% 2011 YTD 64% 2009 Margin R&D Sales & Marketing 34-38% 18 19% 38% 19% 48% 20% 32% 16% G&A Operating Margin 18-10-11% 20-25% 19% (3)% 16% (4)% 18% (2)% EBITDA 20 22-26% Note: gross excludes of intangible assets R&D S&M and stock based expense 0% (2)% 1% •margin amortization assets. D, G&A exclude based-compensation expense. Operating margin excludes amortization of intangible assets, restructuring and transitional expenses and stock-based compensation expense. © Glu Mobile Inc. – Proprietary
Glu Mobile: Investment Overview • Leading freemium, social mobile gaming company • Original IP titles driving gross margin improvements • Acquired two companies to approximately double development capacity
Appendix: Q2 Acquisitions
Why Acquired • Social in Q2/11? Social, mobile gaming space consolidating at accelerating rate • Glu proven fiscally conservative, balance sheet strength and believed time to forward spend is now • More leverage on bottom line due to scalability of sales, marketing + G&A costs © Glu Mobile Inc. – Proprietary Page 40

BLAMM! Page 41
Blammo Games: Overview Social, freemium gaming team with proven track record built: record. Former studio team who • Smurfs’ Village • Zombie Café • Lil’ Pirates Glu already had relationship for 2 products (Dec/Jan & Apr/12) Added proven casual, freemium DNA
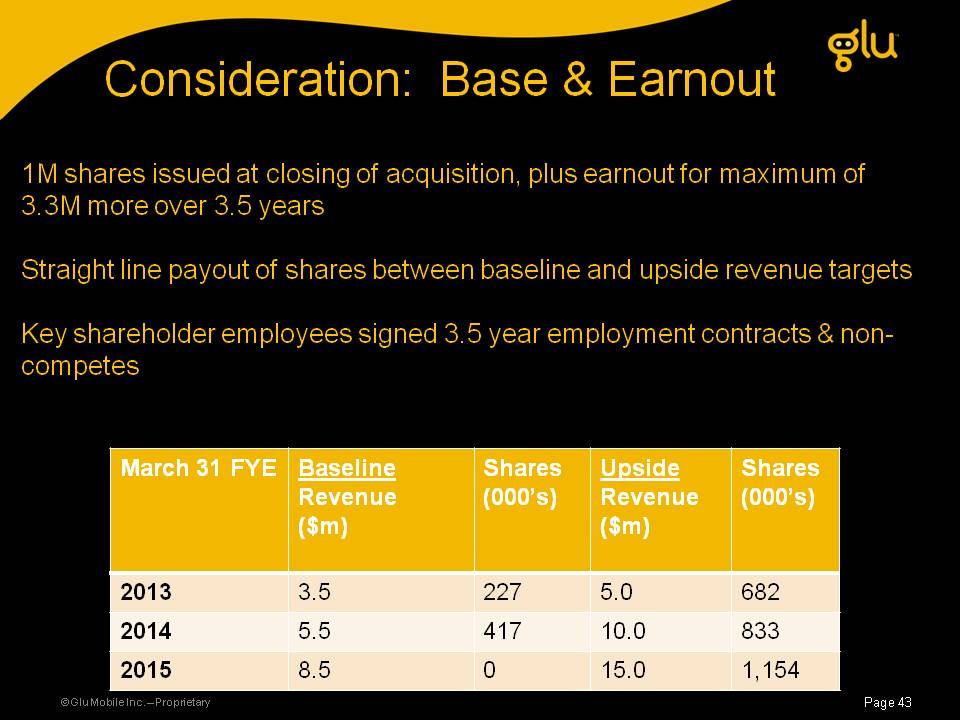
Consideration: Base & Earnout 1M shares issued at closing of acquisition, plus earnout for maximum of 3 3M 3 5 3.3M more over 3.5 years Straight line payout of shares between baseline and upside revenue targets Key shareholder employees signed 3.5 year employment contracts & noncompetes March 31 FYE Baseline Revenue Shares (000’s) Upside Revenue Shares (000’s) ($m) ($m) 2013 3.5 227 5.0 682 © Glu Mobile Inc. – Proprietary Page 43 2014 5.5 417 10.0 833 2015 8.5 0 15.0 1,154
GRIPTONITE Games Page 44
Overview • Handheld work for hire studio in Kirkland Washington – deep Seattle talent pool • Acquired $10M+ positive balance sheet supports repurposing to freemium/social • Acquired 11 teams with first freemium products expected launch Q212 to • Strong and stable mgmt team © Glu Mobile Inc. – Proprietary
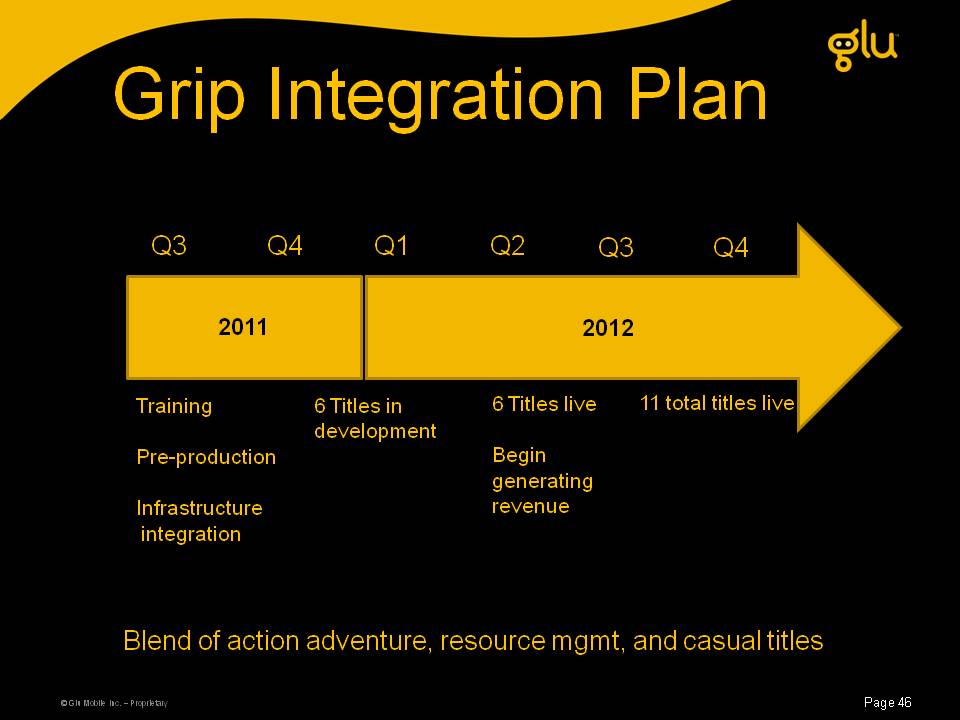
Grip Integration Plan Q3 Q4 Q3 Q4 Q1 Q2 2012 2011 Training 6 6 Titles live 11 total titles live Pre-production Infrastructure Titles in development Begin generating revenue integration © Glu Mobile Inc. – Proprietary Page 46 Blend of action adventure, resource mgmt, and casual titles