Attached files
| file | filename |
|---|---|
| 8-K - FORM 8-K - VALLEY NATIONAL BANCORP | d249270d8k.htm |
 Investor
Presentation EXHIBIT 99.1 |
 2
Forward Looking Statements
The
foregoing
contains
forward-looking
statements
within
the
meaning
of
the
Private
Securities
Litigation
Reform
Act
of
1995.
Such
statements
are
not
historical
facts
and
include
expressions
about
management’s
confidence
and
strategies
and
management’s
expectations
about
new
and
existing
programs
and
products,
acquisitions,
relationships,
opportunities,
taxation,
technology,
market
conditions
and
economic
expectations.
These
statements
may
be
identified
by
such
forward-looking
terminology
as
“should,”
“expect,”
“believe,”
“view,”
“opportunity,”
“allow,”
“continues,”
“reflects,”
“typically,”
“usually,”
“anticipate,”
or
similar
statements
or
variations
of
such
terms.
Such
forward-looking
statements
involve
certain
risks
and
uncertainties.
Actual
results
may
differ
materially
from
such
forward-looking
statements.
Factors
that
may
cause
actual
results
to
differ
materially
from
those
contemplated
by
such
forward-
looking
statements
include,
but
are
not
limited
to:
a
continued
weakness
or
unexpected
decline
in
the
U.S.
economy,
in
particular
in
New
Jersey
and
the
New
York
Metropolitan
area;
other-than-temporary
impairment
charges
on
our
investment
securities;
higher
than
expected
increases
in
our
allowance
for
loan
losses;
higher
than
expected
increases
in
loan
losses
or
in
the
level
of
nonperforming
loans;
unexpected
changes
in
interest
rates;
higher
than
expected
tax
rates,
including
increases
resulting
from
changes
in
tax
laws,
regulations
and
case
law;
a
continued
or
unexpected
decline
in
real
estate
values
within
our
market
areas;
declines
in
value
in
our
investment
portfolio;
charges
against
earnings
related
to
the
change
in
fair
value
of
our
junior
subordinated
debentures;
higher
than
expected
FDIC
insurance
assessments;
the
failure
of
other
financial
institutions
with
whom
we
have
trading,
clearing,
counterparty
and
other
financial
relationships;
lack
of
liquidity
to
fund
our
various
cash
obligations;
unanticipated
reduction
in
our
deposit
base;
potential
acquisitions
that
may
disrupt
our
business;
government
intervention
in
the
U.S.
financial
system
and
the
effects
of
and
changes
in
trade
and
monetary
and
fiscal
policies
and
laws,
including
the
interest
rate
policies
of
the
Federal
Reserve;
legislative
and
regulatory
actions
(including
the
impact
of
the
Dodd-Frank
Wall
Street
Reform
and
Consumer
Protection
Act
and
related
regulations)
subject
us
to
additional
regulatory
oversight
which
may
result
in
increased
compliance
costs
and/or
require
us
to
change
our
business
model;
changes
in
accounting
policies
or
accounting
standards;
our
inability
to
promptly
adapt
to
technological
changes;
our
internal
controls
and
procedures
may
not
be
adequate
to
prevent
losses;
claims
and
litigation
pertaining
to
fiduciary
responsibility,
environmental
laws
and
other
matters;
the
possibility
that
the
expected
benefits
of
acquisitions
will
not
be
fully
realized,
including
lower
than
expected
cash
flows
from
covered
loan
pools
acquired
in
FDIC-assisted
transactions;
failure
to
obtain
shareholder
approval
for
the
merger
of
State
Bancorp
with
Valley
or
to
satisfy
other
conditions
to
the
merger
on
the
proposed
terms
and
within
the
proposed
timeframe
including,
without
limitation,
the
purchase
from
the
United
States
Department
of
the
Treasury
of
each
share
of
State
Bancorp’s
Series
A
Preferred
Stock
issued
under
the
Treasury’s
Capital
Purchase
Program;
and
other
unexpected
material
adverse
changes
in
our
operations
or
earnings.
A
detailed
discussion
of
factors
that
could
affect
our
results
is
included
in
our
SEC
filings,
including
the
“Risk
Factors”
section
of
our
Annual
Report
on
Form
10-
K
for
the
year
ended
December
31,
2010
and
our
Quarterly
Report
on
Form
10-Q
for
the
quarterly
period
ended
June
30,
2011
and
our
Form
10-Q/A
for
such
period.
We
undertake
no
duty
to
update
any
forward-looking
statement
to
conform
the
statement
to
actual
results
or
changes
in
our
expectations.
Although
we
believe
that
the
expectations
reflected
in
the
forward-looking
statements
are
reasonable,
we
cannot
guarantee
future
results,
levels
of
activity,
performance
or
achievements. |
 3
Additional Information and Where to Find it
This
communication
does
not
constitute
an
offer
to
sell
or
the
solicitation
of
an
offer
to
buy
any
securities
or
a
solicitation
of
any
vote
or
approval.
In
connection
with
the
proposed
merger,
Valley
intends
to
file
a
proxy
statement/prospectus
with
the
Securities
and
Exchange
Commission.
INVESTORS
AND
SECURITY
HOLDERS
ARE
ADVISED
TO
READ
THE
PROXY
STATEMENT/PROSPECTUS
WHEN
IT
BECOMES
AVAILABLE,
BECAUSE
IT
WILL
CONTAIN
IMPORTANT
INFORMATION.
Investors
and
security
holders
may
obtain
a
free
copy
of
the
registration
statement
(when
available)
and
other
documents
filed
by
Valley
with
the
Commission
at
the
Commission’s
web
site
at
www.sec.gov.
These
documents
may
be
accessed
and
downloaded
for
free
at
Valley’s
web
site
at
http://www.valleynationalbank.com/filings.html
or
by
directing
a
request
to
Dianne
M.
Grenz,
First
Senior
Vice
President, Valley National Bancorp, at 1455 Valley Road, Wayne, New Jersey 07470, telephone
(973) 305-3380. Participants in the Solicitation
This
communication
is
not
a
solicitation
of
a
proxy
from
any
security
holder
of
State
Bancorp.
However,
Valley,
State
Bancorp,
their
respective
directors
and
executive
officers
and
other
persons
may
be
deemed
to
be
participants
in
the
solicitation
of
proxies
from
State
Bancorp’s
shareholders
in
respect
of
the
proposed
transaction.
Information
regarding
the
directors
and
executive
officers
of
Valley
may
be
found
in
its
definitive
proxy
statement
relating
to
its
2011
Annual
Meeting
of
Shareholders,
which
was
filed
with
the
Commission
on
March
11,
2011
and
can
be
obtained
free
of
charge
from
Valley’s
website.
Information
regarding
the
directors
and
executive
officers
of
State
Bancorp
may
be
found
in
its
definitive
proxy
statement
relating
to
its
2011
Annual
Meeting
of
Shareholders,
which
was
filed
with
the
Commission
on
March
25,
2011
and
can
be
obtained
free
of
charge
from
State
Bancorp’s
website.
Other
information
regarding
the
participants
in
the
proxy
solicitation
and
a
description
of
their
direct
and
indirect
interests,
by
security
holdings
or
otherwise,
will
be
contained
in
the
proxy
statement/prospectus and other relevant materials to be filed with the SEC when they become
available. |
 Historical
Financial Data (1) (Dollars in millions, except for share data)
9/30/2011
14,231
$
108.8
$
$0.64
1.02
%
11.07
%
$0.52
5/11 -
5%
Stock Dividend
2010
14,144
131.2
0.78
0.93
10.32
0.69
5/10 -
5%
Stock Dividend
2009
14,284
116.1
0.61
0.81
8.64
0.69
5/09 -
5%
Stock Dividend
2008
14,718
93.6
0.61
0.69
8.74
0.69
5/08 -
5%
Stock Dividend
2007
12,749
153.2
1.05
1.25
16.43
0.69
5/07 -
5%
Stock Dividend
2006
12,395
163.7
1.10
1.33
17.24
0.67
5/06 -
5%
Stock Dividend
2005
12,436
163.4
1.12
1.39
19.17
0.65
5/05 -
5%
Stock Dividend
2004
10,763
154.4
1.11
1.51
22.77
0.63
5/04 -
5%
Stock Dividend
2003
9,873
153.4
1.10
1.63
24.21
0.60
5/03 -
5%
Stock Dividend
2002
9,148
154.6
1.06
1.78
23.59
0.57
5/02 -
5:4
Stock Split
2001
8,590
135.2
0.89
1.68
19.70
0.54
5/01 -
5%
Stock Dividend
2000
6,426
106.8
0.86
1.72
20.28
0.50
5/00 -
5%
Stock Dividend
1999
6,360
106.3
0.81
1.75
18.35
0.48
5/99 -
5%
Stock Dividend
1998
5,541
97.3
0.78
1.82
18.47
0.43
5/98 -
5:4
Stock Split
1997
5,091
85.0
0.71
1.67
18.88
0.38
5/97 -
5%
Stock Dividend
1996
4,687
67.5
0.62
1.47
17.23
0.34
5/96 -
5%
Stock Dividend
1995
4,586
62.6
0.57
1.40
16.60
0.32
5/95 -
5%
Stock Dividend
1994
3,744
59.0
0.63
1.60
20.03
0.30
5/94 -
10%
Stock Dividend
1993
3,605
56.4
0.61
1.62
21.42
0.24
4/93 -
5:4
Stock Split
1992
3,357
43.4
0.48
1.36
19.17
0.21
4/92 -
3:2
Stock Split
1991
3,055
31.7
0.35
1.29
15.40
0.20
Period End
Total Assets
Net Income
(2)
Common Stock Splits and Dividends
Diluted
Earnings Per
Common
Share
Return on
Average
Assets
Return on
Average
Equity
Cash Dividends
Declared Per
Common Share
4
Shareholder Returns
(1) All per share amounts have been adjusted retroactively for stock
splits and stock dividends during the periods presented. (2) Net income
includes other-than-temporary impairment charges on investment securities totaling $517 thousand, $2.9 million, $4.0 million,
$49.9 million, and $10.4 million, net of tax benefit, for the period ended
September 30, 2011, December 31, 2010, 2009, 2008, and 2007, respectively. |
 Valley
National Bank Today About Valley
Regional Bank Holding Company
Approximately $14.2 Billion in
Assets
Headquartered in Wayne, New
Jersey
40
th
Largest United States
Chartered
Commercial Bank
One of the Largest Chartered
Commercial Banks
Headquartered in
New Jersey
Operates 197 Branches in 135
Communities Serving 14 counties
throughout Northern and Central
New Jersey, Manhattan, Brooklyn
and Queens
Traded on the NYSE (VLY)
Significant Attributes
Consistent Shareholder Returns
Focus on Credit Quality
Conservative Strategies
Affluent and Heavily Populated
Footprint
Strong Customer Service
Experienced Senior and Executive
Management
5 |
 6
Management Approach
Large percentage of retail ownership
Long-term investment approach
Focus on cash and stock dividends
Large insider ownership, family members, retired
employees and retired directors
Market Cap of $2.2 Billion
Approximately 275 institutional holders
Source: Bloomberg as of 10/27/2011
Large Bank that Operates and Feels Like a Small Closely Held Company
|
 7
Valley’s 3Q 2011 Highlights
Net Income
3Q net income available to common shareholders was $35.4 million
($0.21 Diluted EPS)
Loan Growth
Total non-covered loans increased by $35.1 million linked quarter, or 1.5%
on an annualized basis, to $9.3
billion
Residential Mortgage: 4.7% annualized growth linked quarter
Commercial Real Estate: 4.4% annualized growth linked quarter
Commercial & Industrial: 1.6% annualized growth linked quarter
Consumer Loans: (6.6%) annualized decline linked quarter
Credit Quality
Total 30+ day delinquencies were 1.73% of entire loan portfolio
Total non-accrual loans were 1.12% of total loans
Out of approximately 23,000 residential mortgages and home equity loans, only 269 loans were
past due 30 days
or more at September 30, 2011.
Net charge-offs were $4.8 million or 0.21% of average total non-covered loans during
3Q 2011 on an annualized basis compared with $6.2 million or 0.27% during 2Q
2011. Capital
Strong capital ratios
Merger Agreement with State Bancorp, Inc.
Received regulatory approval from the OCC and FRB NY
Closing anticipated for 12/31/2011 effective 1/1/2012 subject to
shareholder approval |
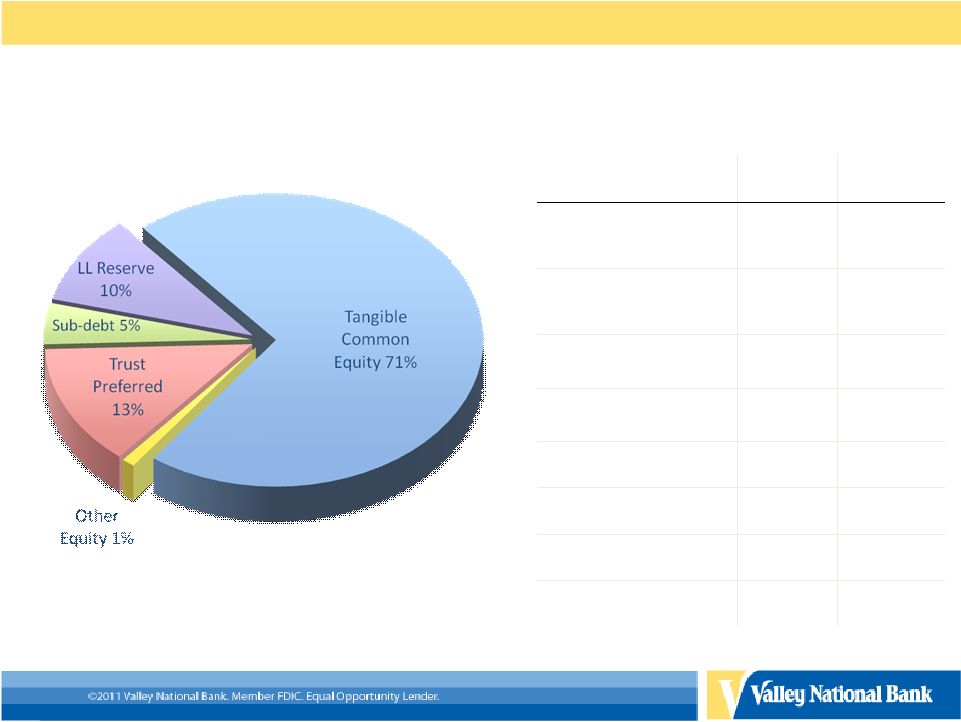 8
Equity Composition / Ratios*
Total Tier II Equity = $1.3 Billion
As of 09/30/11
Significant unrealized gain on facilities, referenced in slide 9,
not incorporated in capital ratios reflected above.
*Non-GAAP reconciliations shown on slide 29-30.
Capital Ratios
As of
09/30/2011
“Well
Capitalized”
Tangible Common Equity /
Tangible Assets
6.96%
N/A
Tangible Common Equity /
Risk-Weighted Assets
9.29%
N/A
Tier I Common Ratio
9.13%
N/A
Tier I
10.82%
6.00%
Tier II
12.65%
10.00%
Leverage
8.10%
5.00%
Book Value
$7.69
N/A
Tangible Book Value
$5.69
N/A |
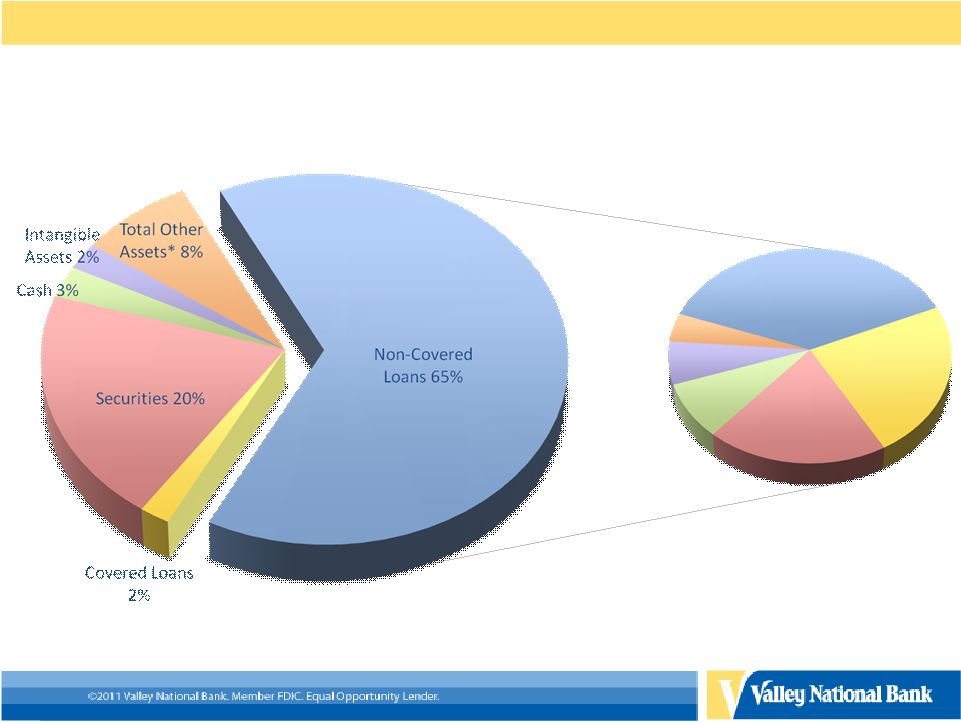 9
Asset and Loan Composition
Total Assets = $14.2 Billion
As of 09/30/2011
Non-Covered Loans (Gross) = $9.3 Billion
*Other Assets includes bank owned branch locations carried at a
cost estimated by management to be significantly less than the
current market value.
Construction
Loans
4%
Commercial
Real Estate
38%
Residential
Mortgages
23%
Commercial
Loans
20%
Auto Loans
8%
Other
Consumer
7% |
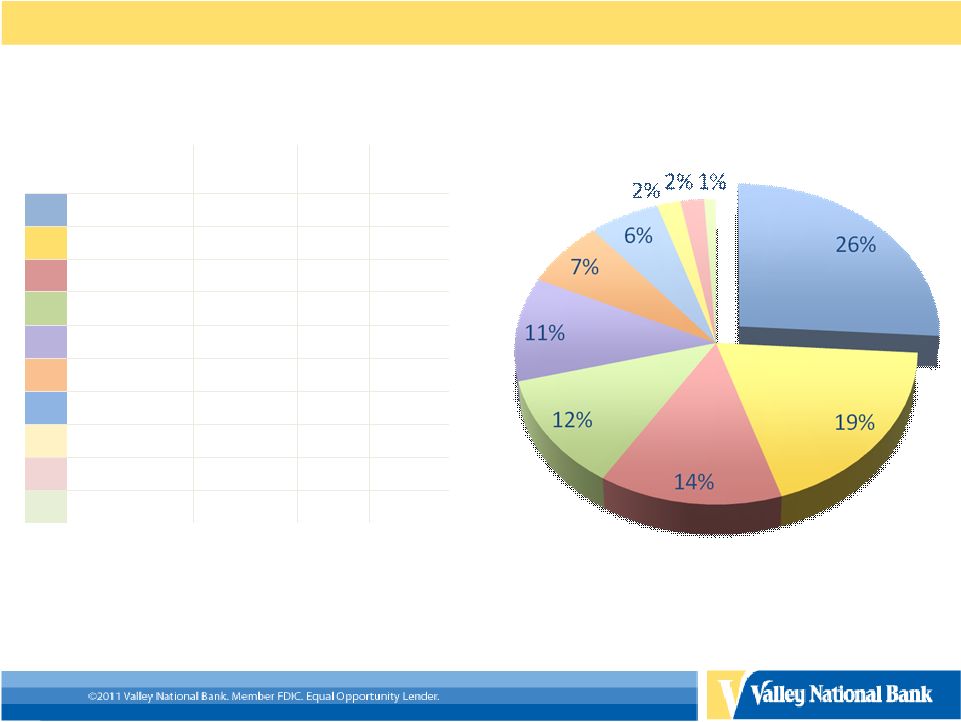 10
Total Commercial Real Estate -
$3.4 Billion
(Non-Covered Loans)
As of 08/31/11
Primary Property
Type
$ Amount
(Millions)
% of
Total
Average
LTV
Retail
895
26%
50%
Industrial
642
19%
52%
Apartments
469
14%
41%
Office
420
12%
53%
Mixed Use
370
11%
45%
Healthcare
236
7%
61%
Specialty
212
6%
50%
Residential
84
2%
49%
Land Loans
64
2%
67%
Other
32
1%
40%
Diversified Commercial Real Estate Portfolio
-Average LTV based on current balances and most recent appraised value
-The total CRE loan balance is based on Valley’s internal loan hierarchy
structure and does not reflect loan classifications reported in Valley’s SEC
and bank regulatory reports.
-The chart above does not include $359 Million in Construction loans.
|
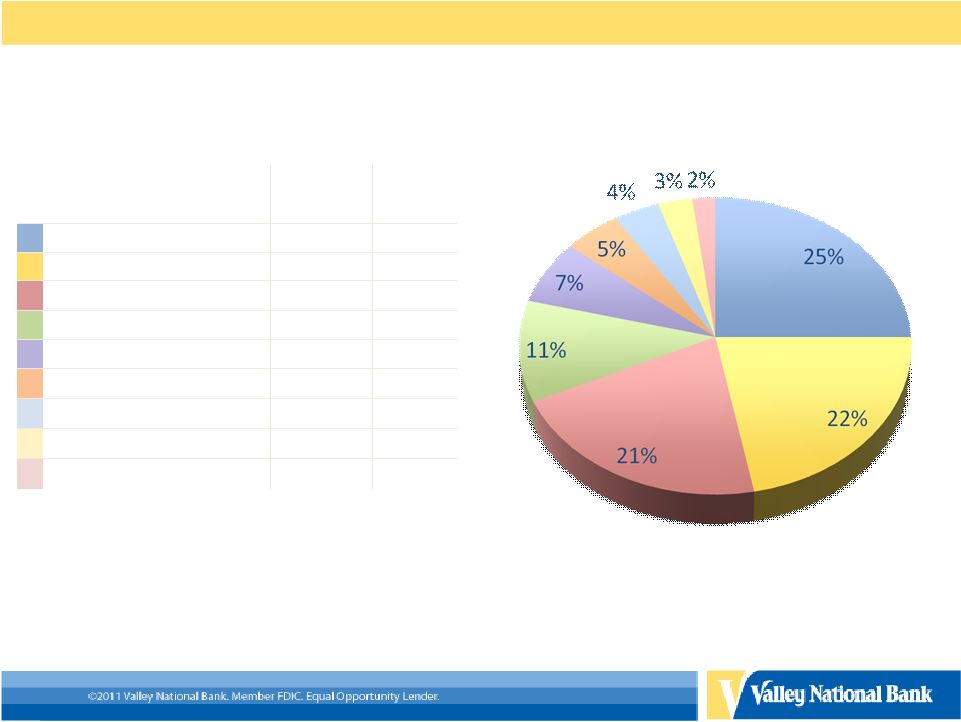 11
Total Retail Property Types -
$895 Million
(Non-Covered Loans)
Retail Property Type
% of
Total
Average
LTV
Multi-Tenanted -
Anchor
25%
52%
Single Tenant
22%
51%
Multi-Tenanted -
No Anchor
21%
53%
Auto Dealership
11%
49%
Private & Public Clubs
7%
33%
Food Establishments
5%
54%
Entertainment Facilities
4%
45%
Private Education Facilities
3%
49%
Auto Servicing
2%
51%
Retail Composition of Commercial Real Estate
-Average LTV based on current balances and most recent appraised value
-The chart above does not include construction loans.
As of 08/31/11 |
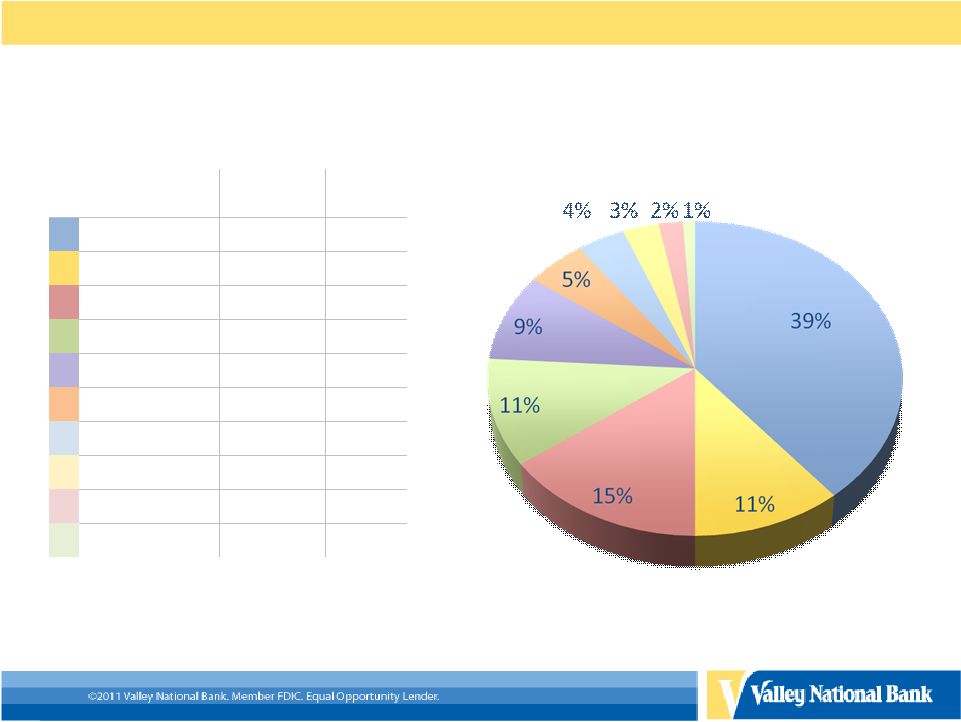 12
Construction Loan Composition
Total (Non-Covered) Construction Loans -
$359 Million
Primary Property Type
$ Amount
(Millions)
% of
Total
Residential
140
39%
Retail
40
11%
Land Loans
53
15%
Mixed Use
39
11%
Apartments
33
9%
Other
18
5%
Industrial
14
4%
Specialty
9
3%
Office
8
2%
Healthcare
5
1%
-Construction loan balance is based on Valley’s internal loan hierarchy
structure and does not reflect loan classifications reported in Valley’s SEC
and bank regulatory reports.
As of 08/31/11 |
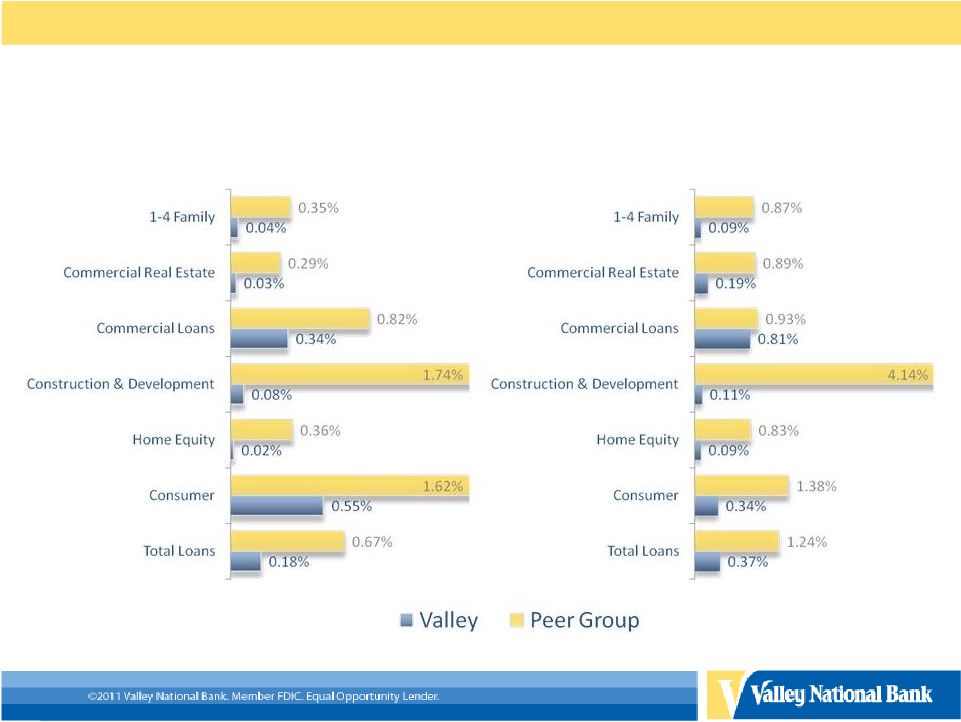 13
Net Charge-offs to Average Loans
Source -
SNL Financial As of 10/27/11
Peer group consists of banks with total assets between $3 billion and $50 billion.
2003 -
2010
2011 YTD |
 14
Investment Portfolio
2011
Investment Types
2007
42%
GSE MBS (GNMA)
3%
15%
GSE MBS (FNMA/FHLMC)
49%
12%
Trust Preferred
12%
12%
State, County & Municipals
7%
7%
Other
7%
5%
US Treasury
0%
4%
Corporate Debt
17%
3%
Private Label MBS
5%
$2.9 Billion
Investment Portfolio
$3.1 Billion
As of 09/30/11 and 12/31/07
Duration of MBS Securities
2.00 Years
2.64 Years |
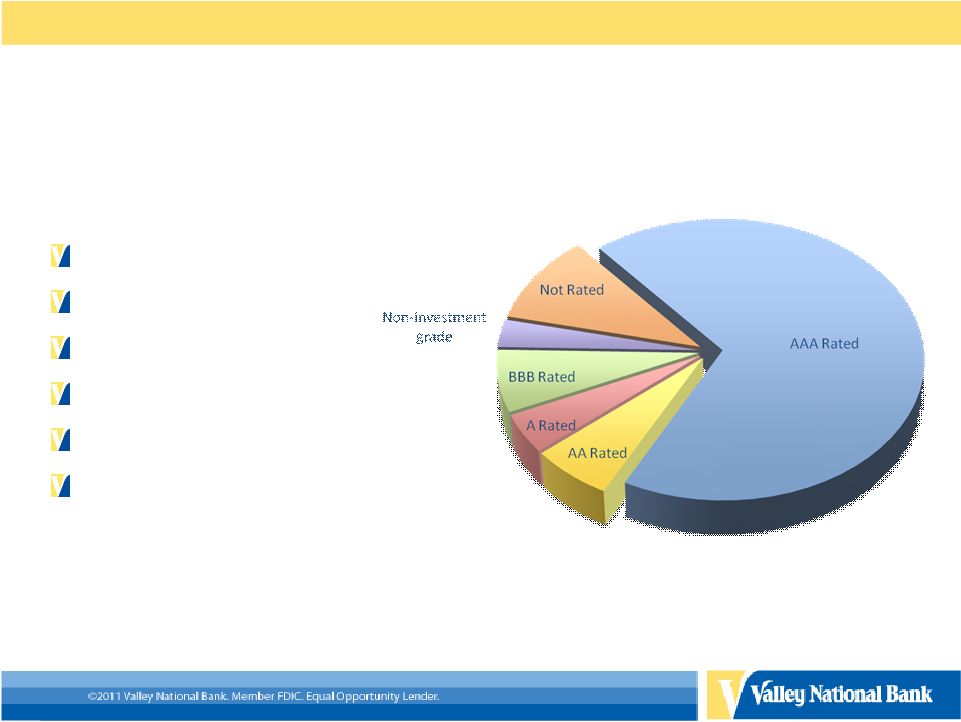 15
Securities by Investment Grade
AAA Rated 69%
AA Rated 6%
A Rated 5%
BBB Rated 7%
Non Investment Grade 3%
Not Rated 10%
As of 09/30/2011 |
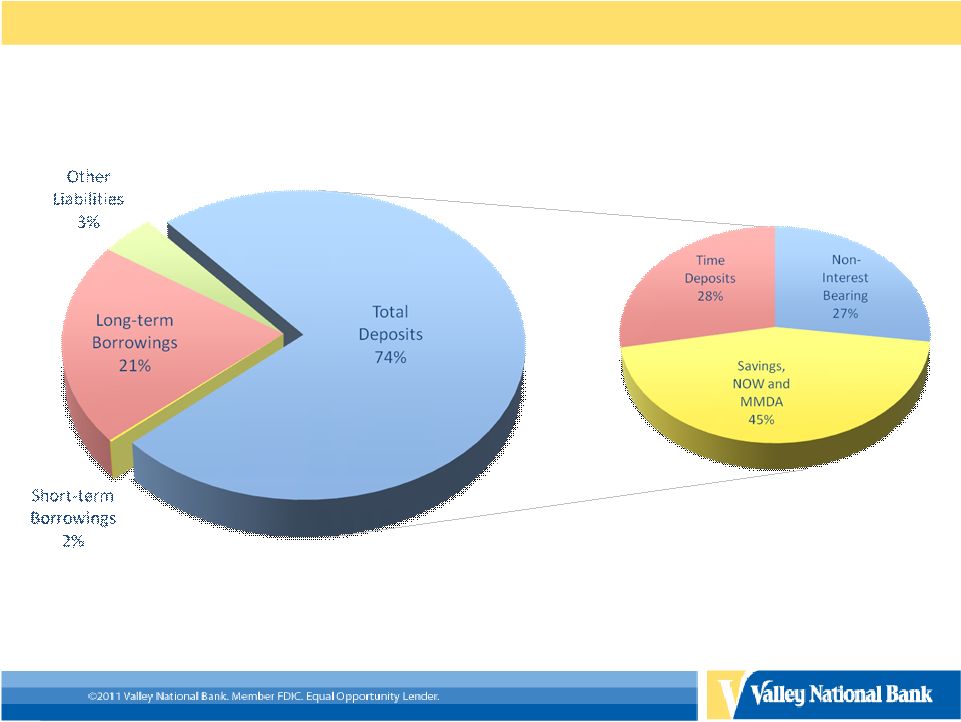 16
Deposits and Borrowings Composition
Total Liabilities = $12.9 Billion
As of 09/30/2011
Total Deposits = $9.6 Billion |
 Merger
Overview 17 |
 Strategic
Rationale for Transaction •
Powerful Super Community Bank Franchise
–
Strategic eastward geographic extension into a contiguous market
for
Valley
–
Strong middle market commercial lender which matches up with
Valley’s historic strengths
–
Significant core deposit funding franchise
–
Utilizes strong management team with extensive Long Island expertise
–
Clean balance sheet
•
Shared Vision of Banking
–
Relationship bank
–
Conservative management culture
•
Financially Advantageous
–
Commitment to strong capital
–
Accretive to income within one year
18 |
     Summary of Key
Terms at Acquisition Price & Structure
Structure
•100% common stock consideration;
fixed 1 for 1 exchange ratio* Transaction Value
•~$222 million
TARP
•Preferred to be repaid &
warrants retired or converted to Valley instruments
Taxable / Non Taxable
•Non-taxable merger transaction
Pricing Multiples**
Price / Tangible Book
•1.85x
Price / 2012 Estimated
EPS
•17.9x (Does not include projected
cost saves, estimated to be 25%)
Price / Deposits
•16.6%
Core Deposit Premium
•8.6%
Assumptions
Loan Mark
•~2.30%
(in addition to ALLL balance as of 3/31/11 of $27.6 million)
Cost Saves
•~25% of 2010 of non-interest expense
Merger –Related Charges
•~$14 million after
tax Closing & Other
Due Diligence
•81% of loan portfolio reviewed by
Valley’s experienced staff
Approvals
•Subject to customary
regulatory and State shareholder approval Management Transitions
•VLY inherits strong seasoned
management team Expected Closing
•4Q 2011
*Adjusted to reflect the 5% stock dividend declared by Valley on
4/13/11
**Calculations based on Valley’s 10 day average closing share price
(4/14/11 – 4/28/11)
19 |
 Valley’s
Eastward Expansion •
New York City
–
Acquired Merchants Bank in 2001 (7 branches)
–
Opened 7 De Novo locations
–
Acquired 2 locations with LibertyPointe and Park Avenue acquisitions
•
Brooklyn and Queens
–
Opened 13 De Novo locations since 2007
–
Acquired deposits and lending relationships from LibertyPointe and Park Avenue
acquisitions
•
Long Island
–
Due diligence on Valley’s expansion into Long Island commenced in 2008
•
Continuation of Valley’s eastward franchise expansion, Long Island phase restrained
between 2008 and 2010 due to economic uncertainty and lack of strong acquisition
candidate(s) –
Significant opportunities to fill in franchise
•
Opportunity to grow via De Novo branching
•
Still receptive to grow via acquisition
20 |
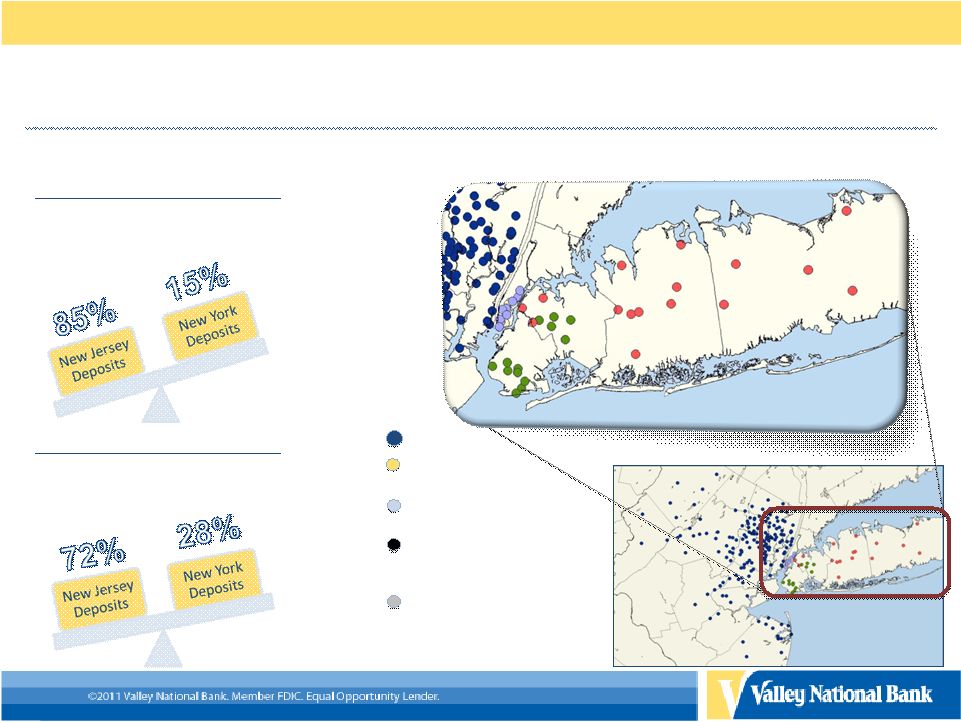       Strategic
Fit Valley’s New York Expansion Continues
2011 Total NY Relationships
•$2.9 billion in NY
deposits •$2.1 billion in
NY loans** * *Pro-forma deposits include State Bancorp;
pro-forma loans are inclusive of VLY C&I and State Bancorp 2001+ De
Novo Branches Manhattan -
9
2007+ Brooklyn/Queens
Brooklyn –
8
Queens -
5
State Bank Branches
Queens –
3
Nassau –
8
Suffolk –
5
Manhattan -
1
VLY NJ Branches -
169
2001 Merchant’s Branches
Manhattan -
7
2001 Total NY Relationships
•$950 million in NY deposits
•$473 million in NY
loans* * NY loans include C&I loans only
21 |
       Demographic
Overview •
Familiar & Strong Demographics
–
High net worth marketplace
–
Population density
–
Large average deposits per branch
–
Significant number of businesses within marketplace
Region
Households
(HH) (2010)
HH per Sq
Mile
Avg. Income
per HH
Avg. Deposits
per Branch
Total
Businesses
NJ Core Market*
1,171,909
1,104
$96,097
$58.4 million
156,071
Brooklyn/Queens/NYC
2,474,719
12,203
$79,390
$239.6 million
291,176
Long Island
956,874
798
$113,739
$71.8 million
127,289
* Core Market Includes Passaic, Morris, Hudson, Essex and Bergen
Counties
22 |
 Future
Opportunities •
Ability to lever Valley’s capital to grow Long Island Franchise
–
Opportunity to fill in Nassau and Suffolk county geography
•
Consumer Lending
–
Opportunity to introduce new products (State Bancorp does
not actively pursue consumer lending relationships)
•
Valley’s residential mortgage products
•
Valley’s consumer lending (auto & home equity) products
•
Commercial Lending
–
Opportunity to expand relationships
•
Larger lending limit
23 |
     Pro-Forma
Impact Financial Highlights
Valley
03/31/2011
State Bank
03/31/2011
Pro-Forma*
Assets ($ Billion)
$14.4
$1.6
$16.0
Loans ($ Billion)
$9.4
$1.1
$10.5
Deposits ($ Billion)
$9.7
$1.3
$11.0
Branches
198
17
215
Tangible Common Equity /
Tangible Assets
6.88%
7.60%
6.68%
Tangible Book Value /
Share
(1)
$5.68
$7.12
$5.57
* Pro-Forma assets, loans and deposits have not been adjusted to reflect
purchase accounting adjustments. (1) Adjusted to reflect Valley’s 5%
stock dividend declared on April 13, 2011 24 |
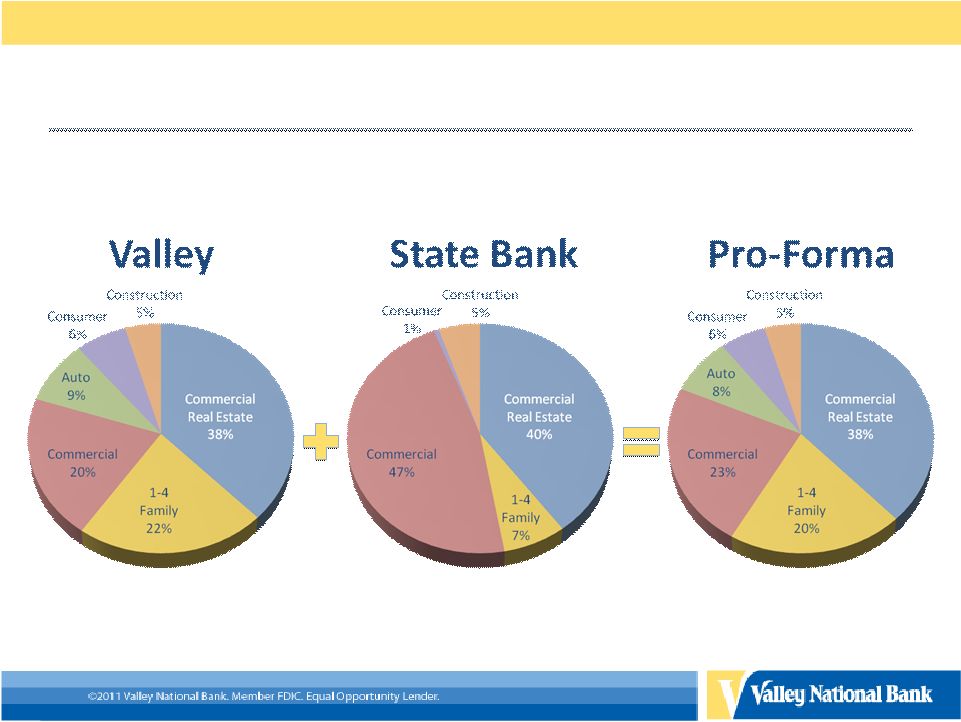 3/31/2011
Loan Mix Pro-Forma Impact
25 |
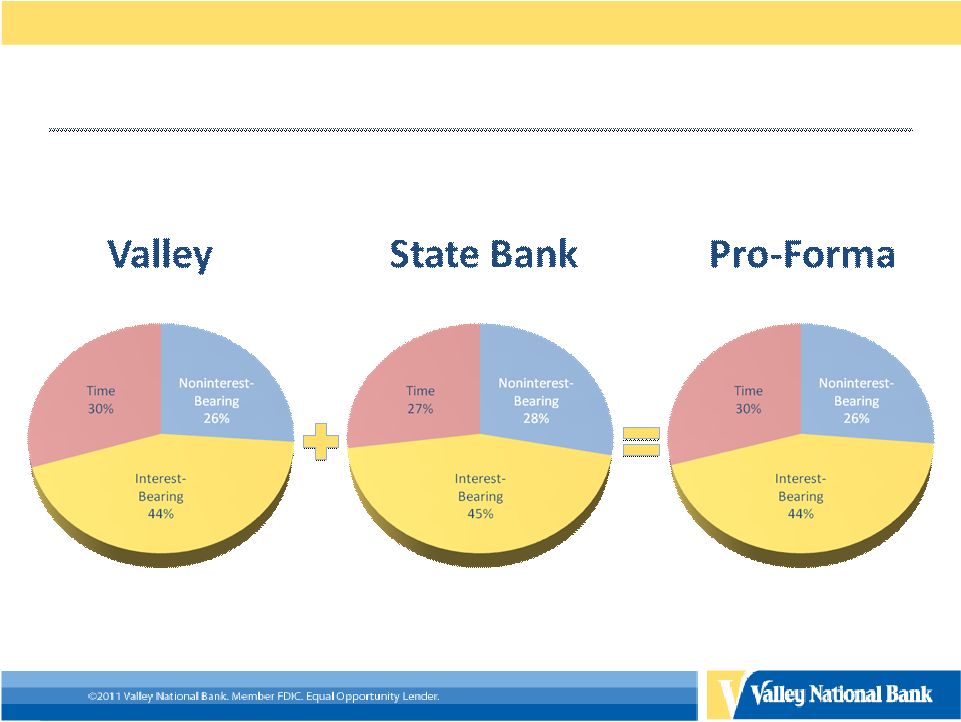 3/31/2011
Deposit Mix Pro-Forma Impact
26 |
      Acquisition
History •
Customer Friendly
•
Employee Friendly
•
Seamless Transitions
•
Quick Conversions
Year
Recent Bank Acquisitions
Total Assets
Branches
Data Processing
Conversion
Period (Days)
2011
State Bank of Long Island (Jericho, NY)
$1,580 million
17
2010
The Park Avenue Bank (Manhattan, NY)
$480 million
5
91
2010
LibertyPointe Bank (Manhattan, NY)
$200 million
3
86
2008
Greater Community Bank (Totowa, NJ)
$976 million
16
40
2005
NorCrown Bank (Livingston, NJ)
$622 million
15
50
2005
Shrewsbury State Bank (Shrewsbury, NJ)
$425 million
12
51
2001
Merchants Bank of New York (Manhattan, NY)
$1,369 million
7
103
27 |
 28
For More Information
Log onto our web site: www.valleynationalbank.com
E-mail requests to: dgrenz@valleynationalbank.com
Call Shareholder Relations at: (973) 305-3380
Write to: Valley National Bank
1455 Valley Road
Wayne, New Jersey 07470
Attn: Dianne M. Grenz, First Senior Vice President
Director of Marketing, Shareholder & Public Relations
Log onto our website above or www.sec.gov to obtain free copies of
documents filed by Valley with the SEC |
 Total
Equity $1,307,102
Total Assets
$14,231,155
Less: Net unrealized gains on securities
available for sale
(7,164)
Less: Goodwill & Other Intangible Assets
(339,850)
Plus: Accumulated net gains (losses) on cash
flow hedges, net of tax
11,811
Total Tangible Assets (TA)
$13,891,305
Plus: Pension liability adjustment, net of tax
17,522
Total Equity
$1,307,102
Less: Goodwill
(317,962)
Less: Goodwill & Other Intangible Assets
(339,850)
Less: Disallowed deferred tax asset
(48,129)
Total Tangible Common Equity (TCE)
$967,252
Less: Disallowed other intangible assets
(12,506)
Tier I Common Capital
$950,674
Ratios
Plus: Trust preferred securities
176,313
TCE / TA
6.96%
Total Tier I Capital
$1,126,987
TCE / RWA
9.29%
Plus: Qualifying allowance for credit losses
$130,039
Plus: Qualifying sub debt
60,000
Tier I (Total Tier I / RWA)
10.82%
Total Tier II Capital
$1,317,026
Tier II (Total Tier II / RWA)
12.65%
Risk Weighted Assets (RWA)
$10,412,788
Tier I Common Capital Ratio
(Tier 1 common /RWA)
9.13%
29
09/30/2011
Non-GAAP Disclosure Reconciliations
($ in Thousands) |
  30
09/30/2011
Non-GAAP Disclosure Reconciliations
($ in Thousands)
Common Shares Outstanding
170,025,364
Shareholders’ Equity
$1,307,102
Less: Goodwill and Other
Intangible Assets
(339,850)
Tangible Shareholders’ Equity
$967,252
Tangible Book Value
$5.69 |