Attached files
| file | filename |
|---|---|
| 8-K - FORM 8-K - Tesla, Inc. | d249698d8k.htm |
Exhibit 99.1
|
|
Tesla Motors, Inc. – Third Quarter 2011 Shareholder Letter
• Start of Model S deliveries on track for no later than July 2012 |

November 2, 2011
Dear Fellow Shareholders,
We are pleased to report another quarter of strong performance. Total revenues in the third quarter were $58 million, up 85% from Q3 of last year. Automotive sales grew by almost 11% from last quarter due to solid Roadster demand and powertrain component sales. Total gross margin was 30%, our fifth consecutive quarter of achieving 30% or higher gross margin.
The highlight of the quarter was our Model S Beta reveal. We opened the doors of our Fremont factory during the weekend of October 1st to thousands of reservation holders, media and investors. Participants rode in Model S Beta vehicles and toured the Tesla Factory. They witnessed firsthand the progress we have made in developing the Model S and our manufacturing facility.
The Model S development program remains on schedule for first customer deliveries of the Model S no later than July 2012. In addition, we continue to have confidence in our long term target gross margin of 25% for Model S upon realizing the manufacturing efficiencies associated with an annualized sales run rate of 20,000 units.
Our non-GAAP net loss of $0.55 per share this quarter, or $0.63 per share on a GAAP basis, reflects our continued investments in R&D and corporate infrastructure to support the launch of Model S. As we have discussed since our IPO, net losses will obviously continue until we reach volume sales of the Model S in 2013.
We are excited about the many bargains available for used tooling and equipment, some of which are located quite near to our Fremont factory. We believe in purchasing used tooling and equipment for pennies on the dollar and buying low cost desks from IKEA, rather than spending large sums of money on architectural and interior design.
Strong Roadster Demand & Margin
| We continue to experience strong demand for the Roadster. During the quarter, we delivered 184 Roadsters, up 22% from the same quarter last year. We sold more Roadsters in the United States than we have in any quarter over the past two years. Total deliveries worldwide now exceed 2,000.
We also generated over $28 million in Roadster-related revenue in this quarter, up 56% from the same quarter last year, and slightly higher than |
|
the prior quarter, due to higher volume, higher average selling prices, slightly lower lease mix and solid service revenue. Automotive gross margin rose to 24%, primarily due to higher average selling prices, additional service revenue and ongoing cost control on the Roadster.
The only slightly negative aspect of Roadster sales was ongoing disproportionately lower sales in the UK due to the continuing adverse impact on the Roadster via reruns of “Top Gear”, the UK’s leading car show. As a result, we had an excess inventory of right hand drive versions of the Roadster and continue to incur additional costs to correct the consumer misperception.
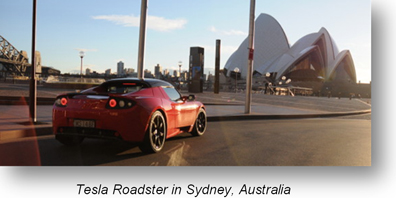
Our Roadster owners have now driven their cars 16 million electrically powered miles, the equivalent of traveling to the moon and back over 30 times. As the world’s longest running electric vehicle program, the Roadster has helped us understand real world consumer behavior related to electric vehicles, service requirements and overall vehicle performance. This experience will pay great dividends when we bring the Model S to market.
Showcasing Model S Development and Factory Preparation
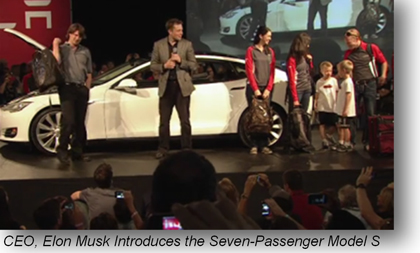
| During the weekend of October 1st, we welcomed almost 3,000 Model S reservation holders, journalists and investors to our Tesla Factory.
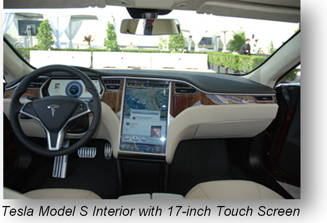
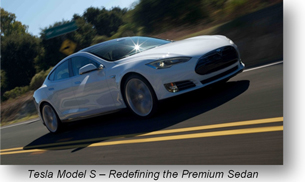
The highlight of the event was the test rides in the Model S Beta vehicles. Guests were able to experience the acceleration and handling of the car, and see the features of the 17-inch touchscreen. The Model S also showcased the two rear facing child seats and plenty of storage space under the hood. The response has been positive—including from the automotive press. Please check out the review from MotorTrend, in particular. |
|
We announced two significant improvements to the Model S at the event. First, we intend to make a performance version of the Model S available at the start of production. We anticipate that this option will enable the Model S to accelerate from 0 to 60 in about 4.4 seconds, faster than a standard Porsche 911 Carrera! Second, we announced an aerodynamic wheel option that is intended to extend the range of the Model S up to almost 320 miles. This range is almost four times more than any other fully electric vehicle on the market (except, of course, the Tesla Roadster). We also released a more detailed set of Model S features.
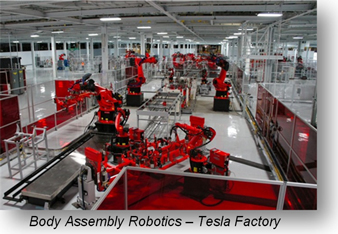
| Guests were also able to view the progress being made in getting the Tesla Factory ready to manufacture the Model S. Roughly 90% of the factory equipment and robots needed to manufacture the Model S have now been installed. This includes installations in the stamping, plastics, paint, body and final assembly shops, which were operational in dry-cycle mode. Customers were also able | ||
|
|
to see several of the Model S Beta bodies wind their way through final assembly on automated guided vehicles and overhead conveyors.
The public display of the Model S Beta vehicles was tangible evidence that our Beta build continues on schedule. During the Beta phase, cars will be produced using increasing maturity of production parts and manufacturing processes. We plan to | |
produce about 50 Beta vehicles in this phase for more testing, validation, systems integration and marketing efforts. After the Beta phase, we plan to begin building Release Candidate cars during the first half of 2012. During that phase of the program, we intend to fine-tune production and assembly processes to build high quality cars for sales to our customers.
Our confidence in the progress of both the Model S Beta phase and the Tesla Factory permits us to be more specific in our timing guidance for first customer deliveries. We are on plan to deliver the first Model S vehicles to customers no later than July 2012.
We also recently finalized a long term supply contract with Panasonic for cells used in the Model S, which gives us increased visibility into our variable costs. As a result, we continue to have confidence in our long term target gross margin of 25% for Model S upon realizing the manufacturing efficiencies associated with an annualized sales run rate of 20,000 units.
|
Retail Footprint & Reservations Growing
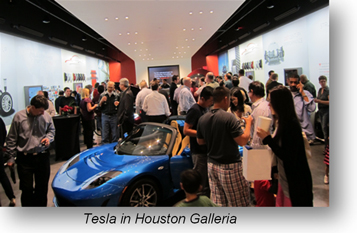
We are continuing to expand our company-owned retail |
Our goals with the new store concept are to engage, excite and inform future electric vehicle buyers. The response to this new strategy continues to surpass our expectations — over 170,000 people have visited our two new stores in San Jose, California and Denver, Colorado during the third quarter alone.
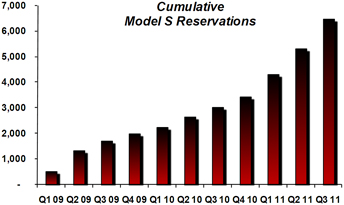
Reservations growth for Model S continued to accelerate, as we added about 1,150 net new reservations during the quarter. This brings our total count to about 6,500 reservations as of the end of September. It is likely that the anticipation of the Model S Beta reveal stimulated an increase in reservations; however, we are continuing to see strong ongoing interest as we begin to display the Model S at some of our stores. These reservations require a minimum $5,000, refundable deposit.
Model X Advanced Engineering on Plan
We are excited about how the design and functionality of the Model X is beginning to mature. Our vision for the Model X is a vehicle that combines the functionality of a minivan with a design as cool as an SUV. We remain on plan for an exclusive showing later this year.
Since we are leveraging the Model S architecture and powertrain for Model X, we continue to anticipate that Model X can be brought to production quickly for first customer deliveries in late 2013, with volumes ramping to 10,000—15,000 units per year beginning in 2014, and at prices comparable to Model S. Importantly, much of the equipment we are currently installing at the Tesla Factory for the Model S will also be used for the Model X.
Solid Powertrain Execution
|
|
We continued to execute well on our existing powertrain contracts
We continue to make good progress on the development of the |
Overall, the RAV4 EV development program remains on schedule and should be completed by early 2012, as planned. Thereafter, we plan to begin shipping complete powertrain systems for the RAV4 EV to Toyota, under a multi-year contract of approximately $100 million.
We are also pleased to announce the receipt of a letter of intent from Daimler for a full powertrain program for a vehicle in the Mercedes line. Details of this deal remain confidential, but will be announced in the coming months.
Strong Financial Performance & Improved Outlook
Given the strong demand we continue to see for Tesla Roadsters and solid execution in our powertrain activities, we now project that full year revenues will be between $195 and $200 million, up from our prior guidance of $180 to $190 million. Total gross margin this quarter was 30%, down only slightly from Q2 due to lower mix and margin contribution from development services revenue. As we have mentioned in the past, timing differences between
recognition of revenue and the underlying costs of development services can cause the gross margin of our development contracts to vary from quarter to quarter.
Our operating expenses continue to reflect our investments in new vehicle development and the build-out of our infrastructure. Our total operating expenses were $82 million on a GAAP basis and $74 million on a non-GAAP basis, which excludes stock-based compensation expense. A full reconciliation between the non-GAAP and GAAP information is included at the end of this Shareholder Letter.
Selling, general and administrative expenses also rose from last quarter driven by higher store-related and marketing activities, including the opening of new stores and hiring of support staff. We expect our operating expenses to rise slightly as we continue to prepare the Tesla Factory for production, refine the Model S, continue the advanced engineering work on Model X, and add more stores.
Capital expenditures were about $69 million this quarter as we continued to build out the Tesla Factory and invest in tooling for Model S. We now expect our capital expenditures for 2011 to be at the lower end of our previous guidance of between $220 and $245 million. This is despite continued controlled expenditure on certain projects that we believe best serve the company by remaining confidential at this time.
In total, our non-GAAP net loss for the quarter was almost $57 million, or $0.55 per share, reflecting 104.1 million weighted common shares outstanding. The increase from 97.8 million weighted common shares outstanding last quarter reflects an entire quarter of the incremental 8.1 million shares issued in our follow-on offering and concurrent private placements in June. We therefore expect that our share count will remain relatively stable at this level.
We will provide guidance for 2012 in our Shareholder Letter for Q4 2011 results. This outlook will include some commentary about the first and second halves of 2012, given the impact of the start of deliveries of Model S in the middle of the year.
Sufficient Capital Resources for Model S and Model X
At the end of the third quarter we had cash resources on our balance sheet of $334 million, higher than last quarter’s balance of $331 million. During the quarter, we drew down almost $91 million from our DoE loan facility. Our projects continue to be on track with the DoE per the terms of the loan agreement, and our relationship with the DoE remains strong.
Combining our $334 million of cash on hand, with the additional $240 million we have left to draw on our loan facility with the DoE, we now have approximately $574 million in available capital resources. We believe that these funds will be sufficient to develop and deliver Model S and Model X, based on our current plans.
In Closing
We are continuing to hire outstanding people and are pleased with the progress our growing team continues to make throughout our business. We remain focused on delighting our customers by delivering vehicles and powertrains that are truly exceptional.
Thank you for your interest in Tesla Motors.
Sincerely,

|

| |
| Elon Musk, Chairman, Product Architect and CEO | Deepak Ahuja, Chief Financial Officer |
Webcast Information
Tesla will provide a live webcast of its third quarter 2011 financial results conference call beginning at 2:30 p.m. PDT on November 2, 2011 at ir.teslamotors.com. This webcast will also be available for replay for approximately two weeks thereafter.
Forward-Looking Statements
Certain statements in this shareholder letter, including statements relating to the progress Tesla is making with respect to the development, testing, performance, attributes, schedule of development and launch, and volume expectations of Model S; the schedule, development, volume expectations and pricing of, and the ability of Tesla to leverage the Model S platform for, Model X; the ability to achieve revenue, gross margin and spending targets; the ability of Tesla to produce vehicles at the Tesla Factory in Fremont, California as well as the plans and schedule for the Tesla Factory and the equipment there; the schedules related to, and the financial results expected from,Tesla’s development programs with Daimler and Toyota; our ability to execute multiple product development programs simultaneously; the sufficiency of current available funds to develop Model S and Model X; and the ability of Tesla to execute on its new interactive retail strategy and future store opening plans are “forward-looking statements” that are subject to risks and uncertainties. These forward-looking statements are based on management’s current expectations, and as a result of certain risks and uncertainties actual results may differ materially from those projected. The following important factors, without limitation, could cause actual results to differ materially from those in the forward-looking statements: Tesla’s future success depends on its ability to design and achieve market acceptance of new vehicle models, specifically Model S and Model X; the risk of delays in the design, manufacture, launch and financing of Model S, including the build-out of its planned Model S manufacturing facility; the risk of a decline in revenues prior to the launch of Model S; consumers’ willingness to adopt electric vehicles and electric cars in particular; Tesla’s ability to fully draw down on its facility from the U.S. Department of Energy; risks associated with the ability to achieve the expected financial results from the production of powertrain systems for the Toyota RAV4 EV; risks associated with sales and anticipated delivery schedule of the Tesla Roadster; competition in the automotive market generally and the alternative fuel vehicle market in particular; Tesla’s ability to establish, maintain and strengthen the Tesla brand; the unavailability, reduction or elimination of governmental and economic incentives for electric vehicles; Tesla’s ability to establish, maintain and strengthen its relationships with strategic partners such as Daimler, Toyota and Panasonic; and Tesla’s ability to execute on its plans for its new interactive retail strategy and for new store openings. More information on potential factors that could affect the Company’s financial results is included from time to time in Tesla’s Securities and Exchange Commission filings and reports, including the risks identified under the section captioned “Risk Factors” in its quarterly report on Form 10-Q filed on August 12, 2011 and its registration statement on Form S-1 filed on June 2, 2011. Tesla disclaims any obligation to update information contained in these forward-looking statements whether as a result of new information, future events, or otherwise.
Non-GAAP Financial Information
Consolidated financial information has been presented in accordance with GAAP as well as on a non-GAAP basis. On a non-GAAP basis, financial measures exclude non-cash items such as stock-based compensation as well as the change in fair value related to Tesla’s warrant liability. Management believes that it is useful to supplement its GAAP financial statements with this non-GAAP information because management uses such information internally for its operating, budgeting and financial planning purposes. These non-GAAP financial measures also facilitate management’s internal comparisons to Tesla’s historical performance as well as comparisons to the operating results of other companies. In addition, Tesla believes these non-GAAP financial measures are useful to investors because they allow for greater transparency into the indicators used by management as a basis for its financial and operational decision making. Non-GAAP information is not prepared under a comprehensive set of accounting rules and therefore, should only be read in conjunction with financial information reported under U.S. GAAP when understanding Tesla’s operating performance. A reconciliation between GAAP and non-GAAP financial information is provided below.
| Investor Relations Contact: | Press Contact: | |||
| Jeff Evanson | Khobi Brooklyn | |||
| 650-681-5050 | Tesla Motors | |||
| ir@teslamotors.com | kbrooklyn@teslamotors.com |
For additional information, please visit ir.teslamotors.com.
Tesla Motors, Inc.
Condensed Consolidated Statements of Operations
(Unaudited)
(In thousands, except per share data)
| Three Months Ended | Nine Months Ended | |||||||||||||||||||
| Sept 30, 2011 |
June 30, 2011 |
Sept 30, 2010 |
Sept 30, 2011 |
Sept 30, 2010 |
||||||||||||||||
| Revenues |
||||||||||||||||||||
| Automotive sales |
$ | 43,235 | $ | 39,028 | $ | 23,350 | $ | 115,891 | $ | 67,906 | ||||||||||
| Development services |
14,431 | 19,143 | 7,891 | 48,976 | 12,552 | |||||||||||||||
|
|
|
|
|
|
|
|
|
|
|
|||||||||||
| Total revenues |
57,666 | 58,171 | 31,241 | 164,867 | 80,458 | |||||||||||||||
|
|
|
|
|
|
|
|
|
|
|
|||||||||||
| Cost of revenues |
||||||||||||||||||||
| Automotive sales |
32,752 | 30,528 | 19,457 | 90,241 | 56,581 | |||||||||||||||
| Development services |
7,690 | 9,135 | 2,488 | 20,866 | 4,467 | |||||||||||||||
|
|
|
|
|
|
|
|
|
|
|
|||||||||||
| Total cost of revenues (1) |
40,442 | 39,663 | 21,945 | 111,107 | 61,048 | |||||||||||||||
|
|
|
|
|
|
|
|
|
|
|
|||||||||||
| Gross profit |
17,224 | 18,508 | 9,296 | 53,760 | 19,410 | |||||||||||||||
| Operating expenses |
||||||||||||||||||||
| Research and development (1) |
54,083 | 52,531 | 26,698 | 147,776 | 55,379 | |||||||||||||||
| Selling, general and administrative (1) |
27,618 | 24,716 | 20,432 | 76,545 | 59,224 | |||||||||||||||
|
|
|
|
|
|
|
|
|
|
|
|||||||||||
| Total operating expenses |
81,701 | 77,247 | 47,130 | 224,321 | 114,603 | |||||||||||||||
|
|
|
|
|
|
|
|
|
|
|
|||||||||||
| Loss from operations |
(64,477 | ) | (58,739 | ) | (37,834 | ) | (170,561 | ) | (95,193 | ) | ||||||||||
| Interest income |
80 | 46 | 100 | 166 | 195 | |||||||||||||||
| Interest expense |
— | — | (298 | ) | — | (992 | ) | |||||||||||||
| Other income (expense), net |
(594 | ) | (71 | ) | 3,180 | (2,150 | ) | (6,770 | ) | |||||||||||
|
|
|
|
|
|
|
|
|
|
|
|||||||||||
| Loss before income taxes |
(64,991 | ) | (58,764 | ) | (34,852 | ) | (172,545 | ) | (102,760 | ) | ||||||||||
| Provision for income taxes |
87 | 139 | 83 | 377 | 210 | |||||||||||||||
|
|
|
|
|
|
|
|
|
|
|
|||||||||||
| Net loss |
$ | (65,078 | ) | $ | (58,903 | ) | $ | (34,935 | ) | $ | (172,922 | ) | $ | (102,970 | ) | |||||
|
|
|
|
|
|
|
|
|
|
|
|||||||||||
| Net loss per common share, basic and diluted (2)(3)(4) |
$ | (0.63 | ) | $ | (0.60 | ) | $ | (0.38 | ) | $ | (1.75 | ) | $ | (2.86 | ) | |||||
|
|
|
|
|
|
|
|
|
|
|
|||||||||||
| Shares used in per share calculation, basic anddiluted (2)(3)(4) |
104,077 | 97,757 | 92,271 | 99,040 | 36,052 | |||||||||||||||
|
|
|
|
|
|
|
|
|
|
|
|||||||||||
| Notes:
|
||||||||||||||||||||
| (1) Includes stock-based compensation expense of the following for the periods presented: |
|
|||||||||||||||||||
| Cost of revenues |
$ | 171 | $ | 181 | $ | 72 | $ | 506 | $ | 150 | ||||||||||
| Research and development |
3,588 | 3,018 | 1,256 | 8,904 | 2,088 | |||||||||||||||
| Selling, general and administrative |
4,127 | 3,727 | 2,483 | 11,327 | 11,075 | |||||||||||||||
|
|
|
|
|
|
|
|
|
|
|
|||||||||||
| Total stock-based compensation expense |
$ | 7,886 | $ | 6,926 | $ | 3,811 | $ | 20,737 | $ | 13,313 | ||||||||||
|
|
|
|
|
|
|
|
|
|
|
|||||||||||
| (2) | On July 2, 2010, the Company completed its initial public offering (IPO), pursuant to which the Company sold 11,880,600 shares of common stock. Concurrent with the closing of the IPO, the Company issued 2,941,176 shares of common stock to Toyota Motor Corporation in a private placement. |
| Upon the completion of the IPO, all convertible preferred stock automatically converted into 70,226,844 shares of common stock. Additionally, 445,047 shares of common stock were issued upon the net exercise of all outstanding warrants, excluding the Department of Energy warrant. |
| (3) | On November 2, 2010, the Company sold 1,418,573 shares of common stock to Panasonic Corporation in a private placement. |
| (4) | On June 8, 2011, the Company completed its follow-on public offering, pursuant to which the Company sold 6,095,000 shares of common stock. Concurrent with the closing of the offering, the Company issued 1,416,000 shares of common stock to Elon Musk and 637,475 shares of common stock to an affiliate of Daimler AG in a private placement. |
Tesla Motors, Inc.
Condensed Consolidated Balance Sheets
(Unaudited)
(In thousands)
| September 30, 2011 |
December 31, 2010 |
|||||||
| Assets |
||||||||
| Cash and cash equivalents |
$ | 213,328 | $ | 99,558 | ||||
| Restricted cash—current |
55,305 | 73,597 | ||||||
| Short-term marketable securities |
65,060 | — | ||||||
| Accounts receivable |
18,250 | 6,710 | ||||||
| Inventory |
49,216 | 45,182 | ||||||
| Prepaid expenses and other current assets |
10,962 | 10,839 | ||||||
| Operating lease vehicles, net |
11,672 | 7,963 | ||||||
| Property and equipment, net |
248,122 | 114,636 | ||||||
| Restricted cash—noncurrent |
5,754 | 4,867 | ||||||
| Other assets |
22,581 | 22,730 | ||||||
|
|
|
|
|
|||||
| Total assets |
$ | 700,250 | $ | 386,082 | ||||
|
|
|
|
|
|||||
| Liabilities and Stockholders’ Equity |
||||||||
| Accounts payable and accrued liabilities |
$ | 86,312 | $ | 49,896 | ||||
| Deferred revenue |
5,802 | 7,418 | ||||||
| Reservation payments |
65,215 | 30,755 | ||||||
| Common stock w arrant liability |
8,189 | 6,088 | ||||||
| Capital lease obligations |
1,049 | 775 | ||||||
| Long-term debt |
225,000 | 71,828 | ||||||
| Other long-term liabilities |
14,565 | 12,274 | ||||||
|
|
|
|
|
|||||
| Total liabilities |
406,132 | 179,034 | ||||||
| Stockholders’ equity |
294,118 | 207,048 | ||||||
|
|
|
|
|
|||||
| Total liabilities and stockholders’ equity |
$ | 700,250 | $ | 386,082 | ||||
|
|
|
|
|
|||||
Tesla Motors, Inc.
Supplemental Consolidated Financial Information
(Unaudited)
(In thousands)
| Three Months Ended | Nine Months Ended | |||||||||||||||||||
| Sept 30, 2011 |
June 30, 2011 |
Sept 30, 2010 |
Sept 30, 2011 |
Sept 30, 2010 |
||||||||||||||||
| Selected Cash Flow Information |
||||||||||||||||||||
| Cash flow s used in operating activities |
$ | 21,491 | $ | 22,488 | $ | 45,957 | $ | 87,276 | $ | 93,533 | ||||||||||
| Cash flow s used in investing activities |
178,170 | 23,122 | 154,679 | 191,181 | 171,747 | |||||||||||||||
| Cash flow s provided by financing activities |
93,609 | 264,335 | 249,895 | 392,227 | 292,216 | |||||||||||||||
| Other Selected Financial Information |
||||||||||||||||||||
| Capital expenditures |
$ | 68,844 | $ | 54,314 | $ | 10,768 | $ | 143,634 | $ | 23,055 | ||||||||||
| Capital expenditures related to initial acquisitionof Fremont facility and assets |
— | — | 55,710 | — | 58,710 | |||||||||||||||
|
|
|
|
|
|
|
|
|
|
|
|||||||||||
| Total capital expenditures |
$ | 68,844 | $ | 54,314 | $ | 66,478 | $ | 143,634 | $ | 81,765 | ||||||||||
|
|
|
|
|
|
|
|
|
|
|
|||||||||||
| Depreciation and amortization |
$ | 4,280 | $ | 4,317 | $ | 3,109 | $ | 12,115 | $ | 7,733 | ||||||||||
| Sept 30, 2011 |
June 30, 2011 |
|||||||
| Cash and Investments |
||||||||
| Cash and cash equivalents |
$ | 213,328 | $ | 319,380 | ||||
| Restricted cash—current |
55,305 | 11,251 | ||||||
| Short-term marketable securities |
65,060 | — | ||||||
| Restricted cash—noncurrent |
5,754 | 5,433 | ||||||
Tesla Motors, Inc.
Reconciliation of GAAP to Non-GAAP Financial Information
(Unaudited)
(In thousands, except per share data)
| Three Months Ended | Nine Months Ended | |||||||||||||||||||
| Sept 30, 2011 |
June 30, 2011 |
Sept 30, 2010 |
Sept 30, 2011 |
Sept 30, 2010 |
||||||||||||||||
| Research and development expenses (GAAP) |
$ | 54,083 | $ | 52,531 | $ | 26,698 | $ | 147,776 | $ | 55,379 | ||||||||||
| Stock-based compensation expense |
(3,588 | ) | (3,018 | ) | (1,256 | ) | (8,904 | ) | (2,088 | ) | ||||||||||
|
|
|
|
|
|
|
|
|
|
|
|||||||||||
| Research and development expenses (Non-GAAP) |
$ | 50,495 | $ | 49,513 | $ | 25,442 | $ | 138,872 | $ | 53,291 | ||||||||||
|
|
|
|
|
|
|
|
|
|
|
|||||||||||
| Selling, general and administrative expenses (GAAP) |
$ | 27,618 | $ | 24,716 | $ | 20,432 | $ | 76,545 | $ | 59,224 | ||||||||||
| Stock-based compensation expense |
(4,127 | ) | (3,727 | ) | (2,483 | ) | (11,327 | ) | (11,075 | ) | ||||||||||
|
|
|
|
|
|
|
|
|
|
|
|||||||||||
| Selling, general and administrative expenses (Non-GAAP) |
$ | 23,491 | $ | 20,989 | $ | 17,949 | $ | 65,218 | $ | 48,149 | ||||||||||
|
|
|
|
|
|
|
|
|
|
|
|||||||||||
| Net loss (GAAP) |
$ | (65,078 | ) | $ | (58,903 | ) | $ | (34,935 | ) | $ | (172,922 | ) | $ | (102,970 | ) | |||||
| Stock-based compensation expense |
7,886 | 6,926 | 3,811 | 20,737 | 13,313 | |||||||||||||||
| Change in fair value of warrant liabilities |
340 | 340 | (3,071 | ) | 2,101 | 5,610 | ||||||||||||||
|
|
|
|
|
|
|
|
|
|
|
|||||||||||
| Net loss (Non-GAAP) |
$ | (56,852 | ) | $ | (51,637 | ) | $ | (34,195 | ) | $ | (150,084 | ) | $ | (84,047 | ) | |||||
|
|
|
|
|
|
|
|
|
|
|
|||||||||||
| Net loss per common share, basic and diluted (GAAP) |
$ | (0.63 | ) | $ | (0.60 | ) | $ | (0.38 | ) | $ | (1.75 | ) | $ | (2.86 | ) | |||||
| Stock-based compensation expense |
0.08 | 0.07 | 0.04 | 0.21 | 0.37 | |||||||||||||||
| Change in fair value of warrant liabilities |
0.00 | 0.00 | (0.03 | ) | 0.02 | 0.15 | ||||||||||||||
|
|
|
|
|
|
|
|
|
|
|
|||||||||||
| Net loss per common share, basic and diluted (Non-GAAP) |
$ | (0.55 | ) | $ | (0.53 | ) | $ | (0.37 | ) | $ | (1.52 | ) | $ | (2.34 | ) | |||||
|
|
|
|
|
|
|
|
|
|
|
|||||||||||
| Shares used in per share calculation,basic and diluted (GAAP and Non-GAAP) |
104,077 | 97,757 | 92,271 | 99,040 | 36,052 | |||||||||||||||
|
|
|
|
|
|
|
|
|
|
|
|||||||||||
Non-GAAP Financial Information
Consolidated financial information has been presented in accordance w ith GAAP as w ell as on a non-GAAP basis. On a non-GAAP basis, financial measures exclude non-cash items such as stock-based compensation as w ell as the change in fair value related to Tesla’s w arrant liabilities. Management believes that it is useful to supplement its GAAP financial statements with this non-GAAP information because management uses such information internally for its operating, budgeting and financial planning purposes. These non-GAAP financial measures also facilitate management’s internal comparisons to Tesla’s historical performance as w ell as comparisons to the operating results of other companies. Non-GAAP information is not prepared under a comprehensive set of accounting rules and therefore, should only be read in conjunction with financial information reported under U.S. GAAP w hen understanding Tesla’s operating performance. A reconciliation between GAAP and non-GAAP financial information is provided above.