Attached files
| file | filename |
|---|---|
| 8-K - FORM 8-K - NEVADA POWER CO | b88799e8vk.htm |
| EX-99.1 - EX-99.1 PRESS RELEASE DATED NOVEMBER 2, 2011 - NEVADA POWER CO | b88799exv99w1.htm |
Exhibit 99.2

| Third Quarter 2011 Earnings Call Supplemental Slides DRAFT 4 November 2, 2011 |

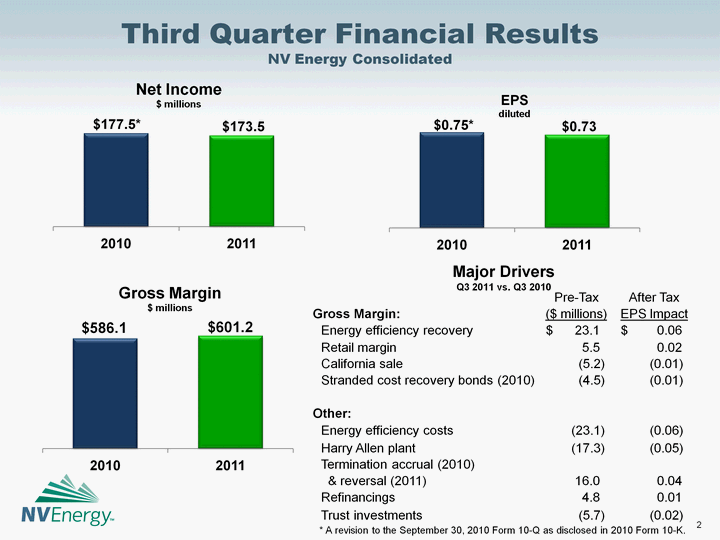
| Third Quarter Financial Results NV Energy Consolidated Major Drivers Q3 2011 vs. Q3 2010 * A revision to the September 30, 2010 Form 10-Q as disclosed in 2010 Form 10-K. Pre-Tax After Tax Gross Margin: ($ millions) EPS Impact Energy efficiency recovery $ 23.1 $ 0.06 Retail margin 5.5 0.02 California sale (5.2) (0.01) Stranded cost recovery bonds (2010) (4.5) (0.01) Other: Energy efficiency costs (23.1) (0.06) Harry Allen plant (17.3) (0.05) Termination accrual (2010) & reversal (2011) 16.0 0.04 Refinancings 4.8 0.01 Trust investments (5.7) (0.02) |

| Gross Margin NV Energy Consolidated $ millions $ millions $ millions $ millions |

| Operating and Maintenance Expense NV Energy Consolidated $ millions $ millions $ millions $ millions |

| Customer and Usage Trends NV Energy South Customer growth has not changed significantly since the second quarter 2011. The trend in low-use customer accounts is favorable. |

| Customer and Usage Trends NV Energy North Customer growth has not changed significantly since the second quarter 2011. The trend in low-use customer accounts is favorable. |

| Update on Major Projects Harry Allen NV Energize ON-Line Cost: $704 million* 484 MW natural gas combined cycle plant located in Southern Nevada In service as of May 4, 2011 Estimated cost: $556 million* NVE's ownership: approximately $139 million* Provides access to renewable energy resources throughout Nevada Connects Northern and Southern service areas Joint dispatch and ability to share resources Positions Nevada and NVE as renewable energy exporters in the future Estimated cost: $300 million* $139 million American Recovery & Reinvestment Act grant Approximately 516,000 smart meters installed 1.45 million smart meters expected to be installed by 2012 * Includes AFUDC |

| Nevada Economy Shows Signs of Stabilization Southern Nevada Northern Nevada Nevada Unemployment Rate Source: Center for Business and Economic Research, LVCVA, DETR July 2011 taxable sales increased 1.7% compared to last year Construction employment increased 2.0% as of August 2011, compared to August 2010 Gaming revenue decreased for the month of August by 9.5% compared to last year Washoe County residential permits have decreased, while commercial permits have increased in August 2011 compared to a year ago Hotel/motel occupancy increased 2.1% for August compared to last year Visitor volume increased 2.1% for August compared to last year Taxable sales increased 2.6% for the month of July compared to last year Gaming revenue decreased for the month of August by 6.7% compared to last year Construction employment decreased 10.0% as of August 2011, compared to August 2010 Southern Nevada residential permits have decreased, while commercial permits have increased in August 2011 compared to a year ago |
