Attached files
| file | filename |
|---|---|
| 8-K - FORM 8-K - FIRST NIAGARA FINANCIAL GROUP INC | c24044e8vk.htm |
Exhibit 99.1
| Stifel Nicolaus Investor Conference November 2, 2011 John R. Koelmel President and Chief Executive Officer Gregory W. Norwood Chief Financial Officer |
| Safe Harbor Statement This presentation contains forward-looking information for First Niagara Financial Group, Inc. Such information constitutes forward-looking statements (within the meaning of the Private Securities Litigation Reform Act of 1995) which involve significant risks and uncertainties. Actual results may differ materially from the results discussed in these forward-looking statements. |
| Building a Differentiated Brand and Franchise Today's Realities Industry challenges are many, varied and continuing In response, we are driving our regional commercial bank model even more effectively and efficiently Winning With Talent Building a deep, scalable bench from top tier organizations Continuing to play offense - focus on taking share of wallet and market Strong organic loan and core deposit growth Footprint provides able opportunity to gain market share HSBC Update Conversion and integration processes on track Continue to assess financing options DOJ divestiture process advances |
| Responding to Today's Realities Market/interest rate conditions will be challenging for the foreseeable future Low rates and "Operation Twist" will challenge the industry Slow economic growth challenges businesses and consumers alike Near-term NIM pressure to continue as long as current rate environment persists Clear focus on deposits and multi-product commercial customers Positive long-term growth prospects for First Niagara Focus on taking market share - commercial and retail Continue to diversify product set and increase customer touch points Our focus - Don't get distracted; keep our eye on the customer; continue to run the business for the long term |
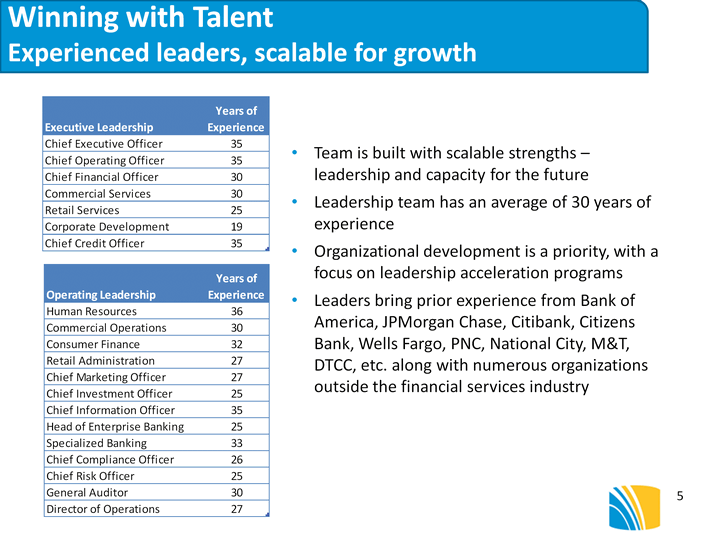
| Winning with Talent Experienced leaders, scalable for growth Team is built with scalable strengths - leadership and capacity for the future Leadership team has an average of 30 years of experience Organizational development is a priority, with a focus on leadership acceleration programs Leaders bring prior experience from Bank of America, JPMorgan Chase, Citibank, Citizens Bank, Wells Fargo, PNC, National City, M&T, DTCC, etc. along with numerous organizations outside the financial services industry |
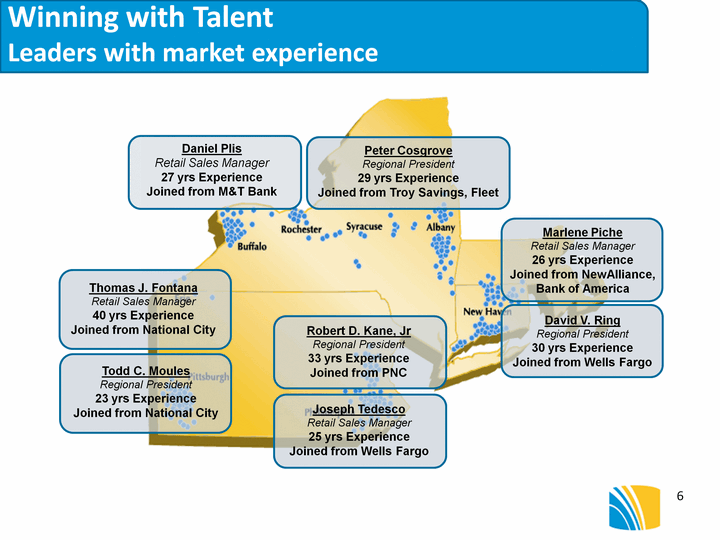
| Winning with Talent Leaders with market experience Daniel Plis Retail Sales Manager 27 yrs Experience Joined from M&T Bank Joseph Tedesco Retail Sales Manager 25 yrs Experience Joined from Wells Fargo |
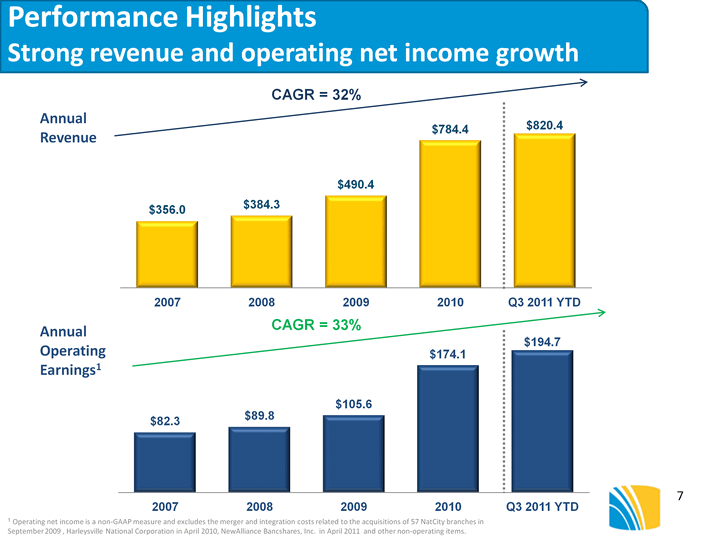
| Performance Highlights Strong revenue and operating net income growth 1 Operating net income is a non-GAAP measure and excludes the merger and integration costs related to the acquisitions of 57 NatCity branches in September 2009 , Harleysville National Corporation in April 2010, NewAlliance Bancshares, Inc. in April 2011 and other non-operating items. CAGR = 32% CAGR = 33% (CHART) (CHART) Annual Operating Earnings1 Annual Revenue |
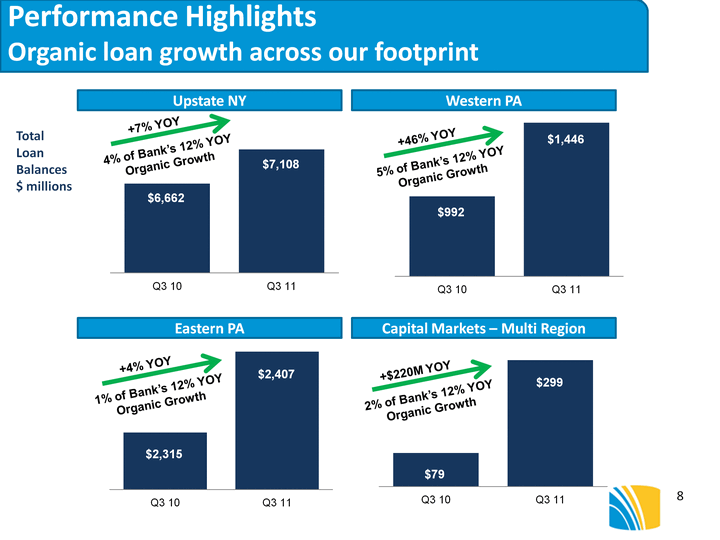
| Performance Highlights Organic loan growth across our footprint Eastern PA Upstate NY Western PA Capital Markets - Multi Region Total Loan Balances $ millions (CHART) +7% YOY 4% of Bank's 12% YOY Organic Growth +46% YOY (CHART) (CHART) +4% YOY 1% of Bank's 12% YOY Organic Growth (CHART) +$220M YOY 2% of Bank's 12% YOY Organic Growth 5% of Bank's 12% YOY Organic Growth |
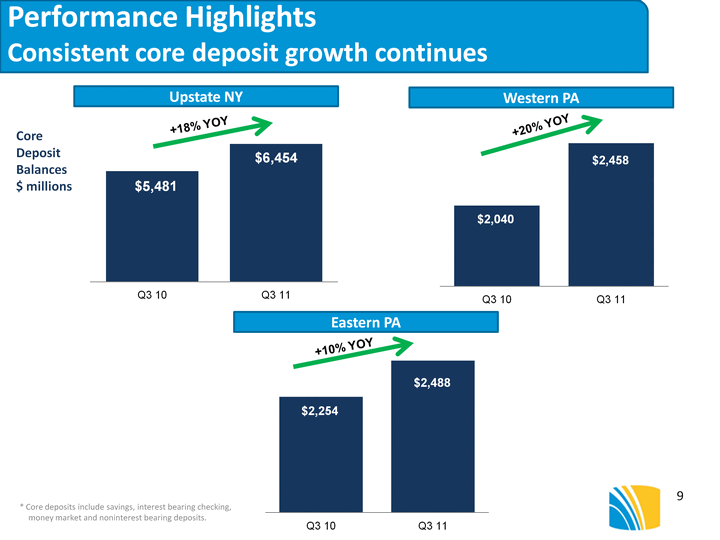
| Performance Highlights Consistent core deposit growth continues * Core deposits include savings, interest bearing checking, money market and noninterest bearing deposits. Eastern PA Upstate NY Western PA Core Deposit Balances $ millions +10% YOY +18% YOY +20% YOY (CHART) (CHART) (CHART) |
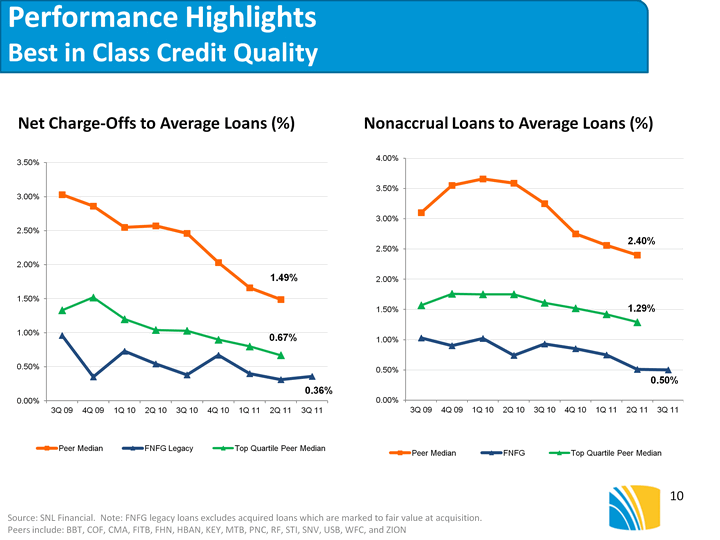
| Performance Highlights Best in Class Credit Quality Net Charge-Offs to Average Loans (%) Nonaccrual Loans to Average Loans (%) Source: SNL Financial. Note: FNFG legacy loans excludes acquired loans which are marked to fair value at acquisition. Peers include: BBT, COF, CMA, FITB, FHN, HBAN, KEY, MTB, PNC, RF, STI, SNV, USB, WFC, and ZION (CHART) (CHART) |
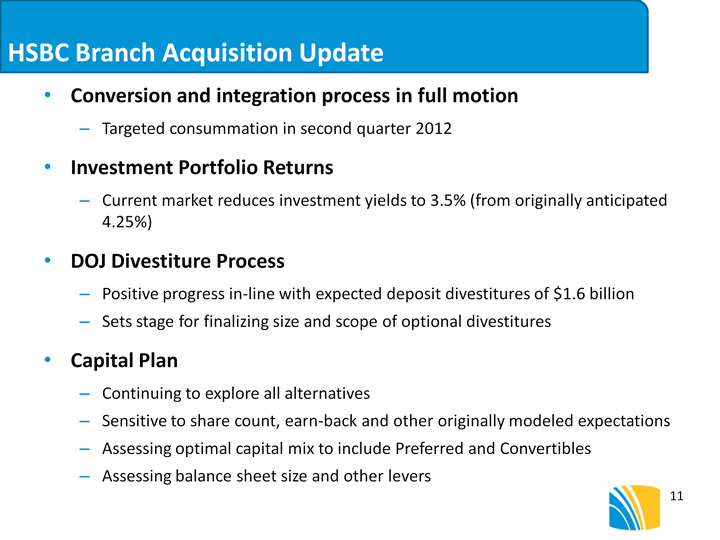
| HSBC Branch Acquisition Update Conversion and integration process in full motion Targeted consummation in second quarter 2012 Investment Portfolio Returns Current market reduces investment yields to 3.5% (from originally anticipated 4.25%) DOJ Divestiture Process Positive progress in-line with expected deposit divestitures of $1.6 billion Sets stage for finalizing size and scope of optional divestitures Capital Plan Continuing to explore all alternatives Sensitive to share count, earn-back and other originally modeled expectations Assessing optimal capital mix to include Preferred and Convertibles Assessing balance sheet size and other levers |
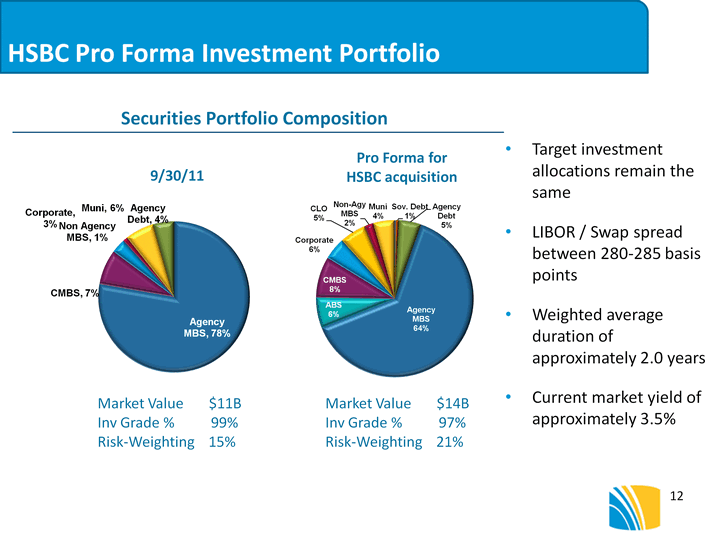
| HSBC Pro Forma Investment Portfolio Target investment allocations remain the same LIBOR / Swap spread between 280-285 basis points Weighted average duration of approximately 2.0 years Current market yield of approximately 3.5% 9/30/11 Securities Portfolio Composition Market Value $11B Inv Grade % 99% Risk-Weighting 15% (CHART) (CHART) Market Value $14B Inv Grade % 97% Risk-Weighting 21% Pro Forma for HSBC acquisition |
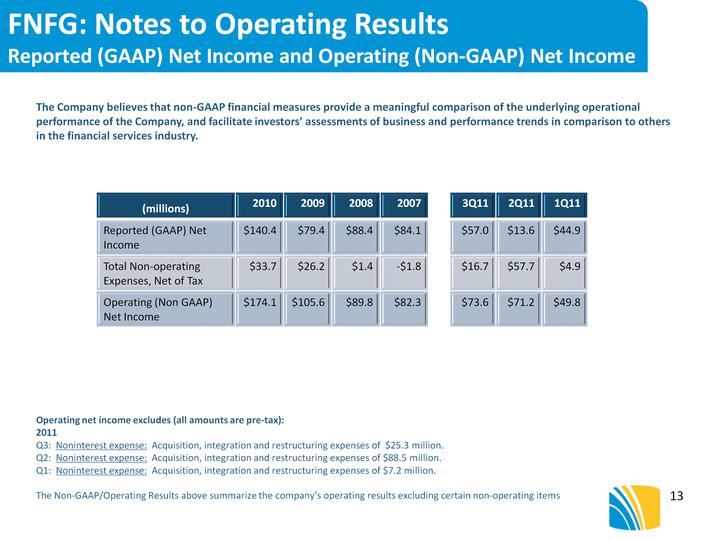
| The Company believes that non-GAAP financial measures provide a meaningful comparison of the underlying operational performance of the Company, and facilitate investors' assessments of business and performance trends in comparison to others in the financial services industry. Operating net income excludes (all amounts are pre-tax): 2011 Q3: Noninterest expense: Acquisition, integration and restructuring expenses of $25.3 million. Q2: Noninterest expense: Acquisition, integration and restructuring expenses of $88.5 million. Q1: Noninterest expense: Acquisition, integration and restructuring expenses of $7.2 million. The Non-GAAP/Operating Results above summarize the company's operating results excluding certain non-operating items (millions) 2010 2009 2008 2007 3Q11 2Q11 1Q11 Reported (GAAP) Net Income $140.4 $79.4 $88.4 $84.1 $57.0 $13.6 $44.9 Total Non-operating Expenses, Net of Tax $33.7 $26.2 $1.4 -$1.8 $16.7 $57.7 $4.9 Operating (Non GAAP) Net Income $174.1 $105.6 $89.8 $82.3 $73.6 $71.2 $49.8 FNFG: Notes to Operating Results Reported (GAAP) Net Income and Operating (Non-GAAP) Net Income 13 |
