Attached files
| file | filename |
|---|---|
| 8-K - FORM 8-K - ENCORE CAPITAL GROUP INC | d249238d8k.htm |
 November 2, 2011
ENCORE CAPITAL GROUP
Exhibit 99.1 |
 CAUTIONARY NOTE ABOUT FORWARD-LOOKING STATEMENTS
2
The statements in this presentation that are not historical facts, including, most
importantly, those statements preceded by, or that include, the words
“may,” “believe,”
“projects,”
“expects,”
“anticipates”
or the negation thereof, or similar
expressions, constitute “forward-looking statements”
within the meaning of the Private
Securities Litigation Reform Act of 1995 (the “Reform Act”).
These statements may
include, but are not limited to, statements regarding our future
operating results and
growth.
For all “forward-looking statements,”
the Company claims the protection of
the safe harbor for forward-looking statements contained in the Reform
Act. Such
forward-looking statements involve risks, uncertainties and other factors which
may cause actual results, performance or achievements of the Company
and its
subsidiaries to be materially different from any future results,
performance or
achievements expressed or implied by such forward-looking statements. These
risks, uncertainties and other factors are discussed in the reports filed by
the Company with the Securities and Exchange Commission, including the most
recent reports on Forms 10-K, 10-Q and 8-K, each as it may be
amended from time to time. The
Company disclaims any intent or obligation to update these forward-looking
statements.
FORWARD-LOOKING STATEMENTS |
 INVESTMENT HIGHLIGHTS
3
•
Investments made over the past few years have driven
significant improvements in collections, cash flow and earnings
•
Difficult regulatory environment being managed proactively
•
Demonstrated ability to raise and profitably deploy capital in
favorable and unfavorable business cycles
•
Analytic insights that inform our valuation and operating strategies
allow for a closer partnership with consumers
•
Operational and financial leverage is improving, largely due to the
success of our operating center in India and new strategic initiatives
|
 ENCORE
IS A LEADING PLAYER IN THE CONSUMER DEBT BUYING AND RECOVERY INDUSTRY
4
Global Capabilities
St Cloud, MN
Arlington, TX
Phoenix, AZ
Delhi, India
Call Center /
Technology Site
Call Center Site
Ascension
Call Center Site
San Diego, CA
Debt Purchasing & Collections
Bankruptcy Servicing
Headquarters/
Call Center Site
Revenue Composition
As of September 30, 2011
Debt Purchasing & Collections
Bankruptcy Servicing
•
Purchase and collection of
charged-off unsecured
consumer receivables
(primarily credit card)
•
Robust business model
emphasizing consumer
intelligence and
operational
specialization
•
Invested ~$2.1 billion to
acquire receivables with a face
value of ~$63 billion
•
Acquired ~38 million consumer
accounts since
inception
•
Process secured consumer bankruptcy accounts for leading
auto
lenders and other financial institutions
•
Proprietary software dedicated to bankruptcy servicing
•
Operational platform that integrates lenders, trustees,
and
consumers
Call Center
Site 2012
Costa Rica |
 ENCORE
HAS GENERATED STRONG RESULTS DESPITE THE MACROECONOMIC DOWNTURN
5
($ millions)
*
Adjusted EBITDA is a non-GAAP number. The Company considers Adjusted EBITDA to
be a meaningful indicator of operating performance and uses it as a measure to
assess the operating performance of the Company. See Reconciliation of Adjusted
EBITDA to GAAP Net Income in Appendix B to this presentation **
LTM data as of 09/30/2011
Adjusted EBITDA* and Gross Collections by year |
 Metric
Recent trend
•
Payer rates
•
Modestly upward
•
Average payment
size
•
Stable
•
Payment style
•
More payment
plans
•
Broken payer
rates
•
Mild improvement
•
Settlement rates
•
Stable
6
OUR CONSUMERS HAVE SHOWN THAT THEY ARE RESILIENT AS EVIDENCED
BY THE INCREASE OF PAYER RATES
Overall Payer Rate for All Active Inventory |
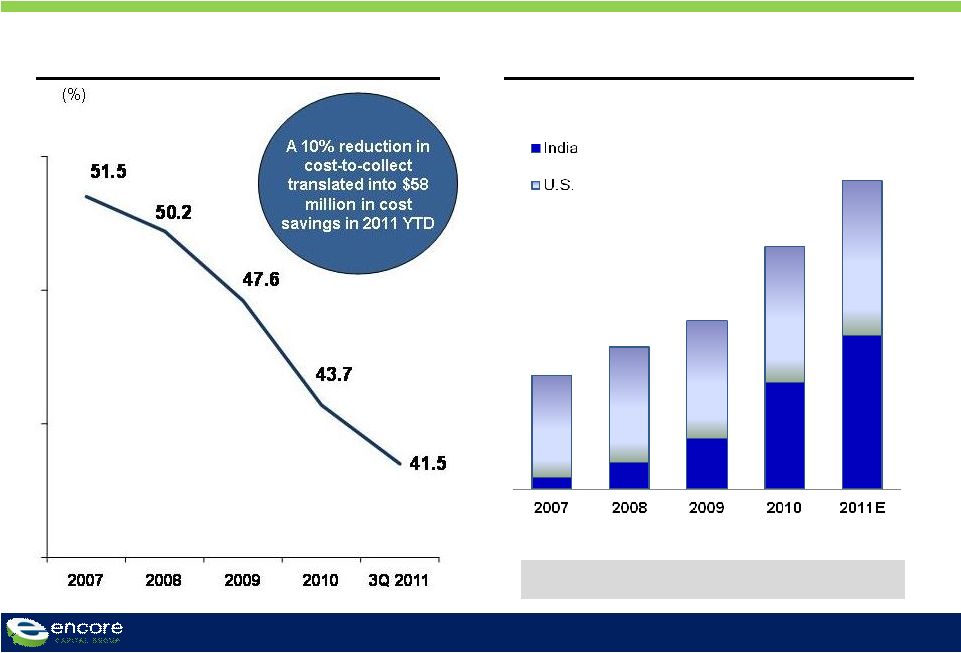 WE HAVE
FUNDAMENTALLY CHANGED THE COST STRUCTURE OF THE COMPANY OVER THE PAST FOUR
YEARS, LED BY OUR INDIA CENTER 7
Overall Cost-to-Collect
Collections from all Call Centers
Percent of Total from India
$126
$157
$186
$268
~$340
10%
19%
30%
44%
50%
($ millions) |
 DIVERSIFIED PURCHASE ACTIVITY AND CONSERVATIVE PROJECTIONS HAVE
RESULTED IN A RESERVOIR OF FUTURE COLLECTIONS
8 |
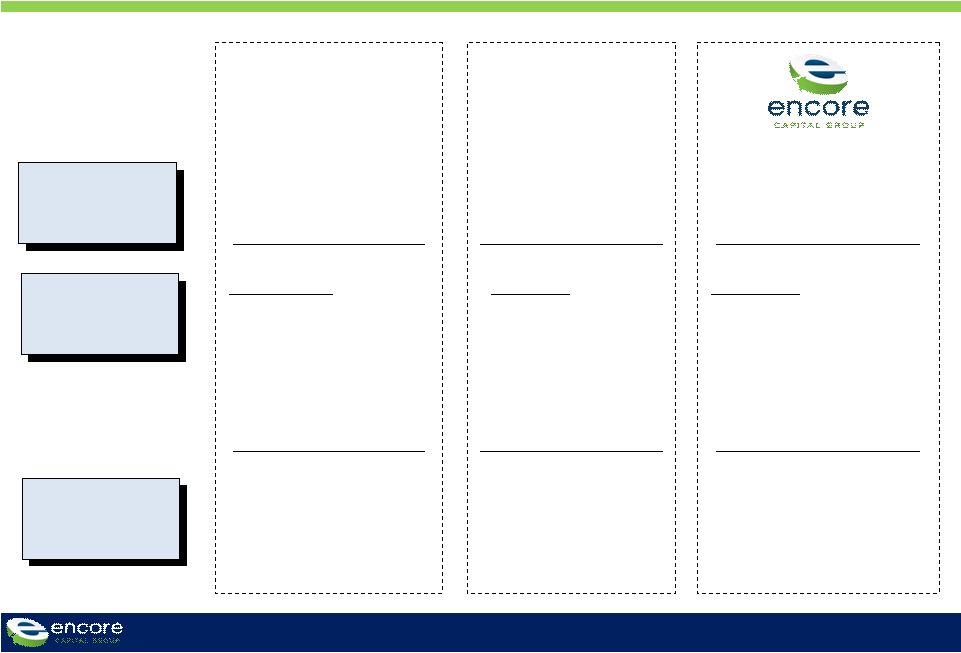 OUR
BUSINESS MODEL IS CRITICALLY IMPORTANT, AS IT PROVIDES THE CONSUMER WITH TIME
TO RECOVER 9
Timeframe
Process and
relationship
with consumers
Outcome
•
Charge-off threshold
extends a maximum of
6 months
Transactional
•
Attempt immediate
resolution during
delinquency cycle
(days 30 –
180)
•
Consumer is “charged-
off”
by issuer on day 181
•
Issuer offers to sell
unsecured, charged-off
debt or service through
3rd party agencies
ORIGINAL
CREDITOR
•
Four-to-six month
collection cycle
Pressured
•
Artificial deadlines
•
Multiple collection
companies
•
Counterproductive
incentive structure
•
Consumer is
confused and
frustrated
CONTINGENCY
COLLECTION
AGENCY
•
Consumer has 84 months
to recover financially
Partnership
•
Create partnership strategy
and set goals
•
Tailor work strategies to
individual circumstances,
giving them time for a
consumer to recover
•
Maximizes likelihood of
repayment, creates
consistency, and ensures
that consumers are treated
fairly |
 WE
HAVE TAKEN A LEADERSHIP STANCE BY OUTLINING OUR CORE PRINCIPLES IN AN
INDUSTRY-FIRST CONSUMER BILL OF RIGHTS 10 |
 PURCHASING
ACCURACY
AND
OUR
ANALYTIC
OPERATING
MODEL
HAVE
LED
US
TO
CONSISTENTLY
OUTPERFORM
OUR
PEERS
11
Cumulative
Actual
Collection
Multiples
by
Vintage
Year
as
of
June
30,
2011
(Total
Collections
/
Purchase
Price)
Source:
SEC
Filings,
Encore
Capital
Group
Inc.
Since 2000, 95%
of our portfolio
purchases have
been profitable |
 WE
HAVE CONSISTENTLY OUTPERFORMED OUR PEERS AND THE S&P 500 12
Source: FactSet (10/28/2011)
Total Return
1-Year (%)
3-Year (%)
5-Year (%) |
 WE ARE
WELL POSITIONED TO CAPITALIZE ON A CHANGING ENVIRONMENT 13
•
Diversified purchase model
–
Ability to increase purchases is a result of having capabilities
across asset classes, age and balance
•
New operational initiatives
–
Insourcing of legal function over time will drive increasing margin
contributions in the future
•
Robust consumer-level underwriting
–
Continue to develop new insights about our consumers while
addressing a growing population of Spanish-speaking consumers
•
Lower-cost collection platform
–
Capture incremental value through increased low-cost collection
activities in India and Costa Rica |
 APPENDIX |
 APPENDIX A: CUMULATIVE COLLECTIONS BY PORTFOLIO VINTAGE
15
Cumulative Collections through September 30, 2011 (000’s)
Year
of
Purchase
Purchase
Price
<2005
2005
2006
2007
2008
2009
2010
2011
Total
CCM
<2005
$385,474
$749,791
$224,620
$164,211
$85,333
$45,893
$27,708
$19,986
$12,084
$1,329,626
3.4
2005
192,585
66,491
129,809
109,078
67,346
42,387
27,210
14,850
457,171
2.4
2006
141,028
42,354
92,265
70,743
44,553
26,201
14,567
290,683
2.1
2007
204,099
68,048
145,272
111,117
70,572
35,566
430,575
2.1
2008
227,867
69,049
165,164
127,799
70,604
432,616
1.9
2009
253,401
96,529
206,773
131,861
435,163
1.7
2010
358,989
125,853
225,530
351,383
1.0
2011
249,284
70,036
70,036
0.3
Total
$2,012,727
$749,791
$291,111
$336,374
$354,724
$398,303
$487,458
$604,394
$575,098
$3,797,253
1.9 |
 APPENDIX B: RECONCILIATION OF ADJUSTED EBITDA
16
Reconciliation of Adjusted EBITDA to GAAP Net Income
(Unaudited, In Thousands)
Three Months Ended
Note:
The
periods
3/31/07
through
12/31/08
have
been
adjusted
to
reflect
the
retrospective
application
of
ASC
470-20
3/31/07
6/30/07
9/30/07
12/31/07
3/31/08
6/30/08
9/30/08
12/31/08
3/31/09
6/30/09
9/30/09
12/31/09
GAAP net income, as reported
4,991
(1,515)
4,568
4,187
6,751
6,162
3,028
(2,095)
8,997
6,641
9,004
8,405
Interest expense
4,042
4,506
4,840
5,260
5,200
4,831
5,140
5,401
4,273
3,958
3,970
3,959
Contingent interest expense
3,235
888
-
-
-
-
-
-
-
-
-
-
Pay-off of future contingent interest
-
11,733
-
-
-
-
-
-
-
-
-
-
Provision for income taxes
3,437
(1,031)
1,315
2,777
4,509
4,225
2,408
(1,442)
5,973
4,166
5,948
4,609
Depreciation and amortization
869
840
833
810
722
766
674
652
623
620
652
697
Amount applied to principal on receivable portfolios
28,259
29,452
26,114
29,498
40,212
35,785
35,140
46,364
42,851
48,303
49,188
47,384
Stock-based compensation expense
801
1,204
1,281
1,001
1,094
1,228
860
382
1,080
994
1,261
1,049
Adjusted EBITDA
45,634
46,077
38,951
43,533
58,488
52,997
47,250
49,262
63,797
64,682
70,023
66,103
3/31/10
6/30/10
9/30/10
12/31/10
3/31/11
6/30/11
9/30/11
GAAP net income, as reported
10,861
11,730
12,290
14,171
13,679
14,775
15,370
Interest expense
4,538
4,880
4,928
5,003
5,593
5,369
5,175
Contingent interest expense
-
-
-
-
-
-
-
Pay-off of future contingent interest
-
-
-
-
-
-
-
Provision for income taxes
6,490
6,749
6,632
9,075
8,601
9,486
9,868
Depreciation and amortization
673
752
816
958
1,053
1,105
1,194
Amount applied to principal on receivable portfolios
58,265
64,901
63,507
53,427
85,709
83,939
73,187
Stock-based compensation expense
1,761
1,446
1,549
1,254
1,765
1,810
2,405
Adjusted EBITDA
82,588
90,458
89,722
83,888
116,400
116,484
107,199
|
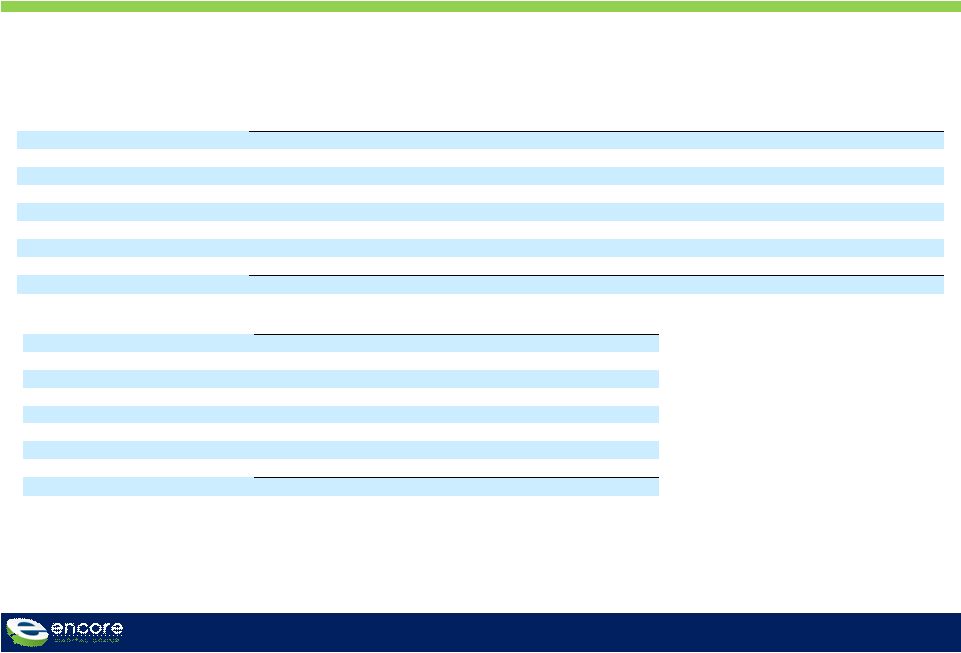
 APPENDIX C: THE COMPANY’S FINANCIAL RESULTS OVER THE PAST TWO
YEARS HAVE BEEN STRONG
17
2010
2009
YOY Growth
Annual Variance
604.6
116.8
24%
487.8
Collections
381.3
64.9
21%
316.4
Revenue
346.7
82.1
31%
264.6
Adjusted EBITDA*
362.0
105.3
41%
256.6
Purchases
1.95
0.58
42%
1.37
Diluted EPS
($M, except EPS and ratios)
575.2
346.7
340.1
250.1
1.71
YTD
9/30/10
455.4
281.5
262.8
242.9
1.39
YTD
9/30/11 |