Attached files
| file | filename |
|---|---|
| 8-K - FORM 8-K - SVB FINANCIAL GROUP | d249327d8k.htm |
 Corporate
Overview and Third Quarter 2011 Financial Results
Exhibit 99.1 |
| The presentations
made at today’s meeting contain projections or other forward- looking statements
regarding management’s expectations about the future events or the future financial
performance of the Company, as well as future economic, market and tax conditions.
Forward-looking statements are
statements that are not historical facts.
We wish to caution you that such
statements are just predictions and actual events or results may
differ materially,
due to changes in economic, business and regulatory factors and trends.
We refer you to the documents the Company files from time to time with the
Securities and Exchange Commission, specifically the Company’s latest Annual
Report on Form 10-K for the year ended December 31, 2010, which was filed on
February 25, 2011, and our latest Quarterly Report on Form 10-Q.
These
documents contain and identify important risk factors that could
cause the
Company’s actual results to differ materially from those contained in our
projections or other forward-looking statements.
All subsequent written or oral
forward-looking statements attributable to the Company or persons acting
on its
behalf are expressly qualified in their entirety by these cautionary statements. All
forward-looking statements included in this presentation are made only as of
today’s date and the Company undertakes no obligation to update such forward-
looking statements.
Safe Harbor Disclosure
2 |
 Overview
3
SVB’s Unique Model
Strong Performance
Growth Initiatives
Outlook
Appendix |
 A Unique
Financial Services Company Differentiated business model
•
Focus on “innovation”
markets
•
Balance sheet lender
•
Strong deposit franchise
•
Diversified revenue streams
Leader
•
Leading market share
•
More than 600 venture firm clients
•
The
bank for innovation companies
Established
(1)
•
26 U.S. and seven international offices
•
12,000+ clients and 1,500+ employees
•
$19.2 billion in total assets
•
$34.8 billion in total client funds
(2)
(1) As of 9/30/11.
(2) Total client funds includes deposits and off-balance sheet client investment
funds. 4 SVB’s Unique Model
|
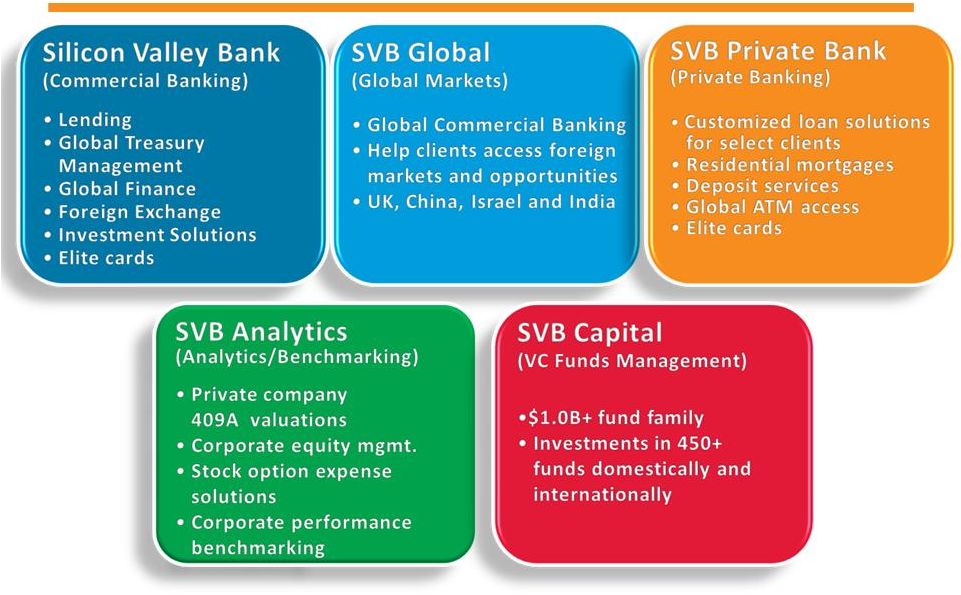 An Expansive
Financial Services Platform 5 SVB’s Unique
Model |
 Strong Q3 2011
Performance Outstanding
loan growth
Continued high
credit quality
Stable net interest
margin
Strong warrant
and VC fund gains
Continued net
interest income
growth
Strong client
transaction
volumes
Continued deposit
growth
Positive conditions
in client markets
Total client
liquidity at all-
time highs *
6 Strong Performance
•Total client liquidity includes
deposits and off-balance sheet client investment funds. |
 Net Interest
Income Remains Strong Millions
NIM
7 Strong Performance
All-time high |
 An Expanded
Balance Sheet DRIVERS
•
Deposit growth primarily due to low interest rate environment
•
New client acquisitions
•
Solid client liquidity
FOCUSED BALANCE SHEET MANAGEMENT
•
Offering the right deposit and investment products to clients
•
Developing new client investment and deposit products
•
Recent debt repurchase of $313 million
•
Maintaining high-quality balance sheet
•
Disciplined use of investment portfolio to maintain liquidity
and minimize extension risk
8
8 Strong Performance |
 We Are Highly
Liquid (1)
As of 9/30/11.
(2)
Net of non-controlling interests, non-marketable securities were $346.4 million.
Non-GAAP number. Please see non-GAAP reconciliations at end of presentation and
in our most recent financial releases for more information. Non-Marketable
Securities
(VC Investments)
(2)
9 Strong Performance |
 A
Well-Performing Loan Portfolio While strategically important, early-
stage has become a smaller portion
of our portfolio as a result of
growth in lending to larger
companies.
Our loan portfolio is focused but
well diversified
within technology
lending.
Total: $6.3 billion as of 9/30/11
10 Strong Performance
Early-Stage
loans were
approximately
30% of
portfolio in
2001 |
 Diversified
Growth Across the Business GLOBAL MARKETS & REACH
GLOBAL PLATFORM
New Global Core
Banking System
IT Backbone
Upgrade
Enhanced Global
Payment System
Enhanced On-
line/Mobile
Systems
PRODUCT LINES
Expanded Banking
Network
New Debit &
Credit Cards
New Products &
Services
Enhanced Credit
Solutions
CLIENT NEEDS
Client Experience
Corporate
Finance Segment
Growth Segment
Private Bank
UK and Europe
India
China
Israel
11 Growth Initiatives |
 Full Year
Outlook: 2011 vs. 2010 Metric
2010 Actual
2011 Outlook
(4)
as of 10/20/2011
Loans (average)
$4.4B
High-twenties % growth
Deposits (average)
$12.0B
High-twenties % growth
Net Interest Income
$418.1B
Mid-twenties % growth
Net Interest Margin
3.08%
Between 3.05% and 3.15%
Allowance for loan losses for performing loans/
period end gross performing loans
1.37%
Between 1.20% and 1.30%
Net Loan Charge-Offs
$34.5M
Lower than 0.25% of average total gross
loans
Non-Performing Loans/Total Loans
0.71%
Lower than 2010 levels
“Core”
Fee Income
(1)
$109.0M
Mid single-digit % increase
Net gains (losses) on equity warrant assets
(2)
$6.6M
Between $25 million and $30 million
Net gains on investment securities (excluding
gains on sales of available-for-sale securities
and non-controlling interests)
(2)
$16.1M
(3)
Between $25 million and $30 million
Non-interest expense
(excluding expenses
related to non-controlling interests)
$410.5M
(3)
Mid-teens % increase
12
Outlook
(1)
“Core” is defined as fees for deposit services, letters of credit, business credit
card, client investment, and foreign exchange, in aggregate.
(2)
The timing, magnitude and realization of these gains (or losses) is uncertain and is dependent
on market conditions.
(3)
Non-GAAP number. Please see non-GAAP reconciliations at end of presentation and
our most recent financial releases for more information.
(4)
See financial press release dated October 20, 2011, for more information.
|
 Expecting Solid
Performance in 2012 13
•
Continued positive environment for our clients relative to the economy
•
Technology revenues expected to outpace U.S. GDP
(4)
•
Expected results from growth initiatives: Growth Segment, Corporate
Finance Segment, UK, and Private Bank
•
Continued new client acquisition and strengthening of existing client
relationships through cross-selling
•
No significant deterioration in overall economy
•
Continued low rate environment
Drivers and Assumptions
•
Average loan growth in the mid teens
•
Gross loan charge-offs between 40 and 70 basis points
(2)
•
Net interest income growth of approximately 10 percent
•
“Core”
(3)
fee income growth in the mid single digits
•
Expense growth in mid to high single digits
Preliminary Outlook
(1)
13
Outlook
(1)
Change estimates relative to 2011 full-year results; outlook is preliminary as of October
20, 2011, and may change.
(2)
Of average total gross loans; assuming no significant deterioration in overall economy.
(3)
“Core” is defined as fees for deposit services, letters of credit, business credit
card, client investment, and foreign exchange, in aggregate.
(4)
Source: FactSet, I/B/E/S consensus estimates -- September 13, 2011, California
Department of Finance -- August 2011 |
 |
 Appendix
1)
Financial Results
16
•
Highlights
17
•
Loans & Credit Quality
19
•
Assets & Client Liquidity
23
•
Sensitivity Charts
25
•
Capital Ratios
27
2)
Growth Initiatives
29
3)
Venture Capital Markets
33
4)
Non-GAAP Reconciliations
36 |
 Financial
Results 16
Appendix |
 Financial
Highlights: Q310 – Q311
Q3 2010
Q4 2010
Q1 2011
Q2 2011
Q3 2011
Diluted Earnings Per Share
$0.89
(3)
$0.41
$0.76
$1.50
(1)(2)
$0.86
Net Income Available to
Common Stockholders
$37.8M
(3)
$17.5M
$33.0M
$65.8M
(1)(2)
$37.6M
Average Loans
(Change)
$4.5B
(+9.4%)
$5.0B
(+11.3%)
$5.3B
(+6.1%)
$5.5B
(+4.2%)
$6.0B
(+8.6%)
Average Deposits
(Change)
$11.9B
(+0.1%)
$13.3B
(+11.6%)
$14.7B
(+10.3%)
$15.3B
(+4.1%)
$15.8B
(+3.5%)
Net Interest Margin
3.14%
2.74%
2.96%
3.13%
3.13%
Net Interest Income
$106.3M
$104.5M
$120.3M
$130.5M
$135.5M
Non-Interest Income
$86.2M
(3)
$71.9M
$90.0M
$123.7M
(1)
$95.6M
Net (Recoveries) Charge-
Offs/Total Average Gross
Loans
0.73%
0.57%
(0.19%)
(6)
0.00%
(5)
(0.15%)
(4)
Non-Interest Expense
$104.2M
$115.9M
$117.4M
$121.0M
(2)
$127.5M
(4)
Represents net recoveries of $2.3M.
(5)
Represents net charge-offs of $30K.
(6)
Represents net recoveries of $2.5M.
(1)
Includes gains of $0.51/share or $22.5M (net of tax) from sales of AFS securities.
(2)
Includes gains of $0.04/share or $1.9M (net of tax) from the early extinguishment of
debt and the termination of corresponding interest rate swaps.
(3)
Includes gains of $0.34/share or $14.2M (net of tax) from sales of AFS securities.
17
Appendix –
Financial Results (Highlights) |
 Financial
Highlights: 2007 -2010 2007
2008
2009
2010
Diluted Earnings Per Share
$3.28
$2.16
$0.66
$2.24
Net Income Available to
Common Stockholders
$120.3M
$73.6M
$22.7M
$95.0M
Average Loans
(Change)
$3.5B
(+22.2%)
$4.6B
(+31.5%)
$4.7B
(+1.4%)
$4.4B
(-5.6%)
Average Deposits
(Change)
$4.0B
(+1.0%)
$4.9B
(+23.6%)
$8.8B
(+79.6%)
$12.0B
(+36.8%)
Average AFS Securities
$1.4B
$1.3B
$2.3B
$5.3B
Net Interest Margin
7.19%
5.72%
3.73%
3.08%
Net Interest Income
$375.8M
$368.6M
$382.2M
$418.1M
Non-Interest Income
$221.0M
$152.4M
$97.7M
$247.5M
Net Charge-Offs/Total Average
Gross Loans
0.35%
0.87%
2.64%
0.77%
Non-Interest Expense
$346.5M
$312.9M
$343.9M
$422.8M
18
Appendix –
Financial Results (Highlights) |
 Loans Are at an
All-Time High 19
19
Appendix –
Financial Results (Loans) |
 Loans Are at an
All-Time High 20
20
Appendix –
Financial Results (Loans) |
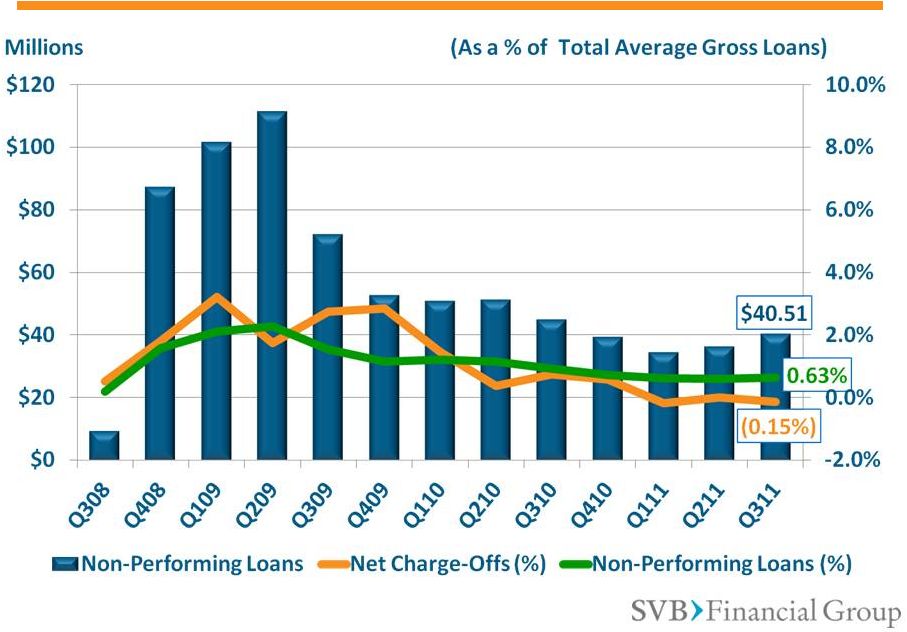 Credit Quality
Has Remained Strong 21
Appendix –
Financial Results (Credit Quality) |
 Solid Credit
Quality Through The Cycle Note: Period-end loans
22
Appendix –
Financial Results (Credit Quality) |
 Solid Franchise
With Consistent Growth 23
Billions
23
Appendix –
Financial Results (Assets)
•
Total client funds includes deposits and off-balance sheet client investment funds.
|
 Total Client
Liquidity is at an All-Time High 24
Billions
24
Appendix –
Financial Results (Client Liquidity)
•Total client liquidity includes
deposits and off-balance sheet client investment funds. |
 Rate Increases
Will Benefit Us Significantly * Tax-effected; estimates are based on static balance
sheet and assumptions as of 9/30/11 Changes in
Fed Funds
Rate (basis
points)
Changes in
Net Interest
Income (tax
effected)
Incremental
EPS Effect
Incremental
ROE Effect
Net Interest
Margin Effect
+75
+19.1M
$0.44
+0.9%
+0.18%
+100
+$26.8M
$0.62
+1.3%
+0.25%
+200
+$67.3M
$1.56
+3.2%
+0.63%
+300
+$108.3M
$2.51
+5.0%
+1.01%
25
Appendix
–
Financial
Results
(Rate
Sensitivity)
We expect each 25 bps increase in the Fed Funds rate to contribute
approximately
$6
–
$9
million
to
Net
Interest
Income* |
 Higher Loan
Balances Will Benefit Us * Estimates
are
based
on
static
balance
sheet
and
assumptions
as
of
9/30/11
We expect each $250 million increase in loan volume to
contribute approximately $0.23 to EPS*
Growth in
Overall Loan
Balances
($$)
Changes in
Net Interest
Income (tax
effected)
Incremental
EPS Effect
Incremental
ROE Effect
Net Interest
Margin
Effect
+250 million
+$9.7M
$0.23
+0.5%
+0.09%
+500 million
+$19.4M
$0.45
+0.9%
+0.18%
+750 million
+$29.1M
$0.68
+1.64%
+0.27%
+1 billion
+$38.8M
$0.90
+1.9%
+0.36%
26
Appendix
–
Financial
Results
(Rate
Sensitivity) |
 We Are Well
Capitalized *
*
27
Appendix –
Financial Results (Capital Ratios)
•
TCE/TA and TCE/RWA are non-GAAP numbers; please refer to Non-GAAP reconciliations at end
of presentation and in our most recent financial releases for more information.
Holding Company Capital Ratios |
 We Are Well
Capitalized Bank Capital Ratios
1)
1)
All ratios, except TCE/TA and TCE/RWA are as reported in our most recent Bank Call
Reports. Bank TCE/TA and TCE/RWA ratios are as reported in our most recent financial releases.
2)
TCE/TA and TCE/RWA are non-GAAP numbers; please refer to non-GAAP reconciliations at end
of presentation and in our most recent financial releases for more information. 28
Appendix –
Financial Results (Capital Ratios)
2)
2) |
 Growth
Initiatives 29
Appendix –
Growth Initiatives |
 We’re
Supporting Clients At All Stages ~50%
Market Share
10% –
12%
Market Share
< 10%
Market Share
30
Appendix –
Growth Initiatives |
 Prior to
2011
2011 -
2012
Long Term
Financial
Impact
-
Rep office
-
Loan
production
office
Branch and
full product
set
Subsidiary bank +
Europe; expansion
and growth
0-2 years
-
Rep Office
-
Funds
JV Bank and
related
activities
Subsidiary
Branch; expansion
and growth
3-5 years
-
Rep Office
-
Loan
production
office
Expansion and
growth
0-2 years
-
NBFC
-
Fund
Develop NBFC
Branch or
subsidiary
3-5 years
We Are Extending Our Platform Globally
31
31
Appendix –
Growth Initiatives |
 Private
Bank •
Expanded private banking services
•
Tailored lending for influencers in the SVB
ecosystem
•
An advanced, easy-to-use, online platform
•
Support for clients’
success in all arenas:
business, family, life
32
Appendix –
Growth Initiatives |
 Venture Capital
Markets 33
Appendix –
Venture Capital Markets |
 Stabilizing VC
Markets 34
Appendix –
Venture Capital Markets
Volume
Source: ThomsonReuters, National Venture Capital Association, PricewaterhouseCoopers -
MoneyTree |
 Source:
ThomsonReuters,
National
Venture
Capital
Association,
PricewaterhouseCoopers
-
MoneyTree
35
Appendix –
Venture Capital Markets
Stabilizing VC Markets
Deal
Volume |
 Non-GAAP
Reconciliations 36
Appendix –
Non-GAAP Reconciliations |
 Non-GAAP Net
Income Reconciliation For additional non-GAAP disclosures, please refer to our latest
Forms 10-Q and 10-K, as well as our quarterly earnings releases. 37
Appendix –
Non-GAAP Reconciliations
September 30,
June 30,
September 30,
2011
2011
2010
Net income available to common stockholders
37,571
$
65,750
$
37,787
$
Less: Gains on sales of available-for-sale securities
-
(37,314)
(23,605)
Tax impact of gains on sales of available-for-sale securities
-
14,810
9,397
Less: Net gain from note repurchases and termination of
corresponding interest rate swaps
-
(3,123)
-
Tax impact of
net gain from note repurchases and termination of corresponding interest rate swaps
-
1,240
-
Non-GAAP
net income available to common stockholders $37,571
$41,363
$23,579
Three months ended
Non-GAAP net income
(Dollars in thousands) |
 Non-GAAP EPS
Reconciliation 38
Appendix –
Non-GAAP Reconciliations
September 30,
June 30,
September 30,
2011
2011
2010
GAAP earnings per common share — diluted
$0.86
$1.50
$0.89
Less: Gains on sales of available-for-sale securities
-
(0.85)
(0.56)
Tax impact of gains on sales of available-for-sale
securities -
0.34
0.22
Less: Net gain from note repurchases and termination of
corresponding interest rate swaps
-
(0.07)
-
Tax impact of net
gain from note repurchases and termination of corresponding interest rate swaps
-
0.03
-
Non-GAAP
earnings per common share — diluted $0.86
$0.95
$0.55
Weighted average diluted common shares outstanding
43,791,238
43,739,743
42,512,515
Non-GAAP earnings per share
For additional non-GAAP disclosures, please refer to our latest Forms 10-Q and 10-K,
as well as our quarterly earnings releases. |
 Non-GAAP
TCE/TA and TCE/RWA Reconciliation
39
Appendix –
Non-GAAP Reconciliations
For additional non-GAAP disclosures, please refer to our latest Forms 10-Q and 10-K,
as well as our quarterly earnings releases. September 30,
December 31,
September 30,
December 31,
2011
2010
2011
2010
GAAP SVBFG stockholders' equity
1,536,098
$
1,274,350
$
1,317,325
$
1,074,561
$
Less: intangible assets
650
847
-
-
Tangible common equity (TCE)
1,535,448
$
1,273,503
$
1,317,325
$
1,074,561
$
GAAP total assets
19,195,363
$
17,527,761
$
18,016,695
$
16,268,589
$
Less: intangible assets
650
847
-
-
Tangible assets (TA)
19,194,713
$
17,526,914
$
18,016,695
$
16,268,589
$
Risk-weighted assets (RWA)
10,808,233
$
9,406,677
$
10,453,446
$
9,047,907
$
Tangible common equity to tangible assets
8.00
7.27
7.31
6.61
Tangible common equity to risk-weighted assets
14.21
13.54
12.60
11.88
Non-GAAP tangible common equity and tangible
assets (dollars in thousands, except ratios)
SVB Financial
Bank |
 Non-GAAP
Non-Interest Income Reconciliation 40
Appendix –
Non-GAAP Reconciliations
September 30,
June 30,
September 30,
December 31,
December 31,
2011
2011
2010
2010
2009
GAAP noninterest income
95,611
$
123,708
$
86,236
$
247,530
$
97,743
$
Less: income (losses) attributable to
noncontrolling interests, including
carried interest
41,239
26,558
17,589
54,186
(24,901)
Noninterest income, net of
noncontrolling interests
54,372
97,150
68,647
193,344
122,644
Less: gains on sales of available-for-
sale securities
-
37,314
23,605
24,699
-
Non-GAAP noninterest income, net
of noncontrolling interests and
excluding gains on sales of
available-for-sale securities
54,372
$
59,836
$
45,042
$
168,645
$
122,644
$
Three months ended
Year ended
Non-GAAP noninterest income, net
of noncontrolling interests
(dollars in thousands)
For additional non-GAAP disclosures, please refer to our latest Forms 10-Q and 10-K,
as well as our quarterly earnings releases. |
 Non-GAAP
Operating Efficiency Reconciliation 41
Appendix –
Non-GAAP Reconciliations
* The non-GAAP operating efficiency ratio is calculated by dividing non-GAAP noninterest
expense, net of non-controlling interests by non-GAAP taxable equivalent revenue, net of
noncontrolling interests. For additional GAAP to non-GAAP reconciliation information,
please refer to our latest Forms 10-Q and 10-K, as well as our quarterly earnings releases.
September 30,
June 30,
September 30,
December 31,
December 31,
2011
2011
2010
2010
2009
GAAP noninterest expense
127,451
$
121,032
$
104,171
$
422,818
$
343,866
$
Less: amounts attributable to
noncontrolling interests
2,766
2,621
2,939
12,348
12,451
Less: net gain from note repurchases and
termination of corresponding interest rate
swaps
-
(3,123)
-
-
-
Less: impairment of goodwill
-
-
-
-
4,092
Non-GAAP noninterest expense, net of
noncontrolling interests
124,685
$
121,534
$
101,232
$
410,470
$
327,323
$
GAAP taxable equivalent net interest
income
135,938
$
130,929
$
106,851
$
420,186
$
384,354
$
Less: income (expenses) attributable to
noncontrolling interests
32
45
2
28
(18)
Non-GAAP taxable equivalent net interest
income, net of noncontrolling interests
135,906
130,884
106,849
420,158
384,372
Non-GAAP noninterest income, net of
noncontrolling interests
54,372
59,836
45,042
168,645
122,644
Non-GAAP taxable equivalent revenue, net
of noncontrolling interests
190,278
$
190,720
$
151,891
$
588,803
$
507,016
$
Non-GAAP operating efficiency ratio
65.53
%
63.72
%
66.65
%
69.71
%
64.56
%
Three months ended
Year ended
Non-GAAP operating efficiency ratio*, net of
noncontrolling interests (dollars in
thousands, except ratios) |
 Non-GAAP
Non-Marketable Securities Reconciliation 42
Appendix –
Non-GAAP Reconciliations
September 30,
June 30,
September 30,
2011
2011
2010
GAAP non-marketable securities
951,963
$
875,194
$
656,067
$
Less: noncontrolling interests in non-marketable securities
605,558
543,548
375,988
Non-GAAP non-marketable securities, net of noncontrolling
interests
346,405
$
331,646
$
280,079
$
Non-GAAP non-marketable securities, net of noncontrolling
interests
(dollars in thousands)
For additional non-GAAP disclosures, please refer to our latest Forms 10-Q and 10-K,
as well as our quarterly earnings releases. |
 Non-GAAP
Non-Marketable Securities Reconciliation 43
Appendix –
Non-GAAP Reconciliations
December 31,
December 31,
December 31,
December 31,
2010
2009
2008
2007
GAAP non-marketable securities
721,520
$
553,531
$
467,206
$
339,877
$
Less: noncontrolling interests in non-
marketable securities
423,400
320,523
298,140
225,000*
Non-GAAP non-marketable securities,
net of noncontrolling interests
298,120
$
233,008
$
169,066
$
$ 114,877*
Non-GAAP non-marketable securities,
net of noncontrolling interests
(dollars in thousands)
For additional non-GAAP disclosures, please refer to our latest Forms 10-Q and 10-K,
as well as our quarterly earnings releases. * Estimated |