Attached files
| file | filename |
|---|---|
| 8-K - FORM 8-K - Patriot Coal CORP | d248841d8k.htm |
 November 1,
2011 Exhibit 99.1
Met Coke World Summit 2011 |
 1
Some of the following information contains forward-looking statements within the meaning
of Section 27A of the Securities Act of 1933 and Section 21E of the Securities
Exchange Act of 1934, as amended, and is intended to come within the safe-harbor
protection provided by those sections. Forward-Looking Statements
Certain statements in this presentation are forward-looking as defined in the Private
Securities Litigation
Reform
Act
of
1995.
These
statements
involve
certain
risks
and
uncertainties
that
may
be
beyond our control and may cause our actual future results to differ materially from
expectations. We do not undertake to update our forward-looking
statements. Factors that could affect our results include, but are not limited
to: price volatility and demand, particularly in higher margin products; geologic,
equipment and operational risks associated with mining; changes in general economic
conditions, including coal, power and steel market conditions; coal mining laws and
regulations; the availability and costs of competing energy resources; legislative and
regulatory developments; risks associated with environmental laws and compliance,
including selenium-related matters; developments in
greenhouse
gas
emission
regulation
and
treatment;
negotiation
of
labor
contracts,
labor
availability
and relations; the outcome of pending or future litigation; changes in the costs to provide
healthcare to eligible active employees and certain retirees under postretirement
benefit obligations; increases to contribution requirements to multi-employer
retiree healthcare and pension funds; reductions of purchases or deferral of shipments
by major customers; availability and costs of credit; customer performance and credit
risks; inflationary trends; worldwide economic and political conditions; downturns in
consumer and company spending; supplier and contract miner performance and the
availability and cost of key equipment and commodities; availability and costs of
transportation; the Company’s ability to replace coal reserves; the outcome of
commercial negotiations involving sales contracts or other transactions; our ability
to respond to changing customer preferences; failure to comply
with
debt
covenants;
the
effects
of
mergers,
acquisitions
and
divestitures;
and
weather
patterns
affecting
energy
demand
or
disrupting
coal
supply.
The
Company
undertakes
no
obligation
(and
expressly
disclaims
any
such
obligation)
to
publicly
update
or
revise
any
forward-looking
statement,
whether
as
a
result
of
new
information,
future
events
or
otherwise.
For
additional
information
concerning
factors
that
could
cause
actual
results
to
materially
differ
from
those
projected
herein,
please
refer to the Company’s Form 10-K and Form 10-Q reports.
Statement on Forward-Looking Information |
 Metallurgical
Market Overview Stabilized global and U.S. steel
mill utilization
Strong seaborne market
China is expected to be a net
importer of 30+ million tonnes
of met coal in 2011
Limited new global supply in the
intermediate term
Adequate U.S. port capacity
Met market expected to remain strong
2 |
 Industry Trends
& Opportunities 3 |
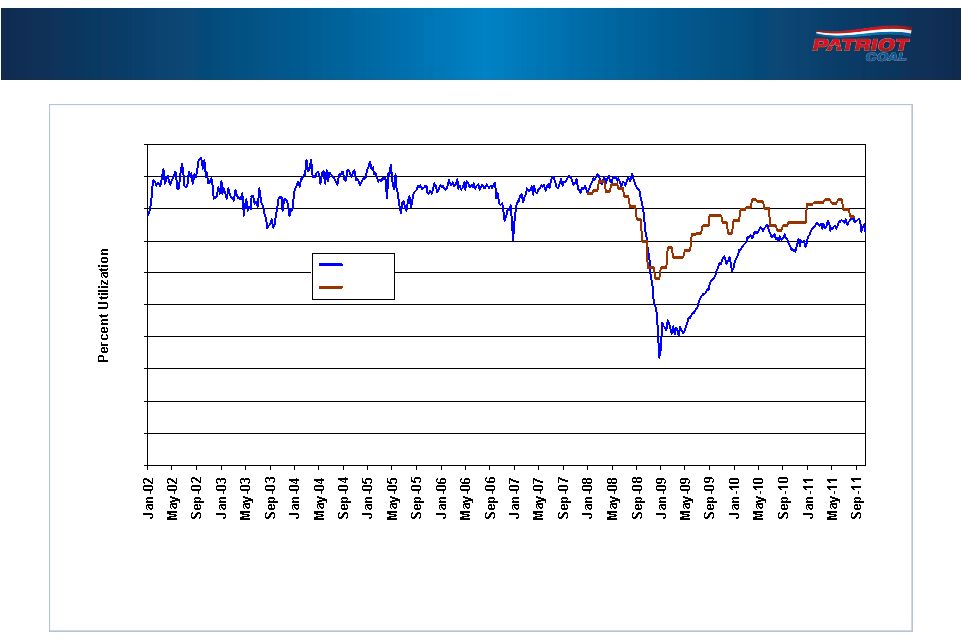 Domestic &
Global Steel Mill Utilization Both domestic & global steel mill utilization rates are
at 70-80% 0
10
20
30
40
50
60
70
80
90
100
U.S.
Global
Updated:
10/22/11
4 |
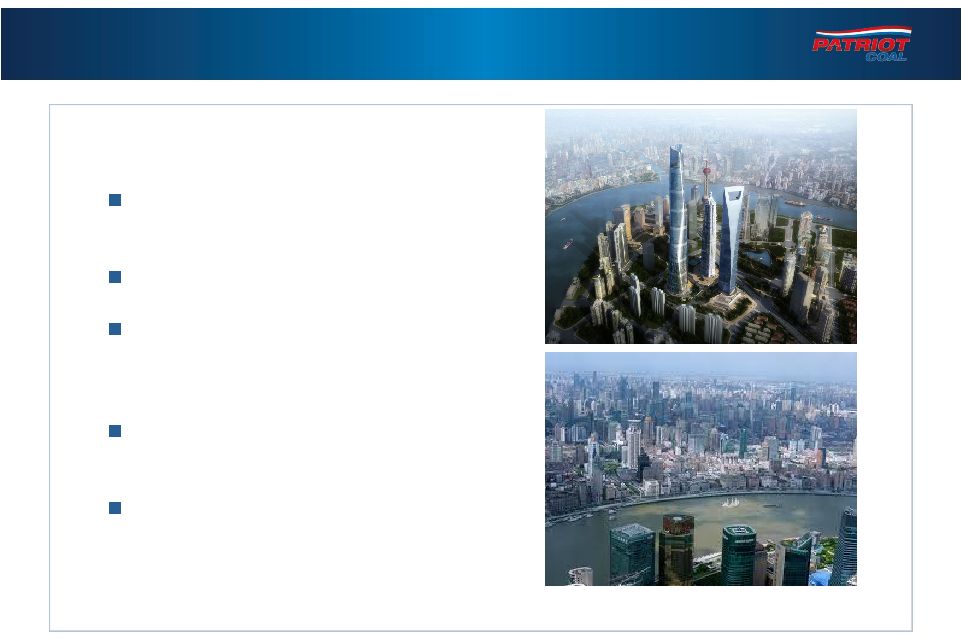
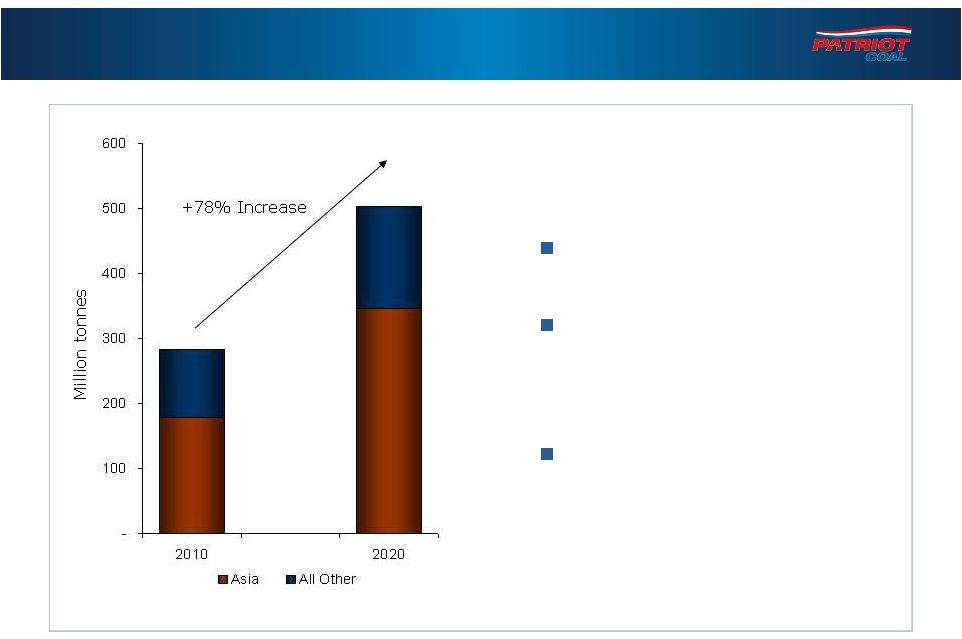 Strong Seaborne
Met Coal Demand Sustainable seaborne demand, led by Asia
Source: McCloskey
5
78% forecast increase in
seaborne met demand
Asian seaborne met
demand expected to
almost double between
2010 and 2020
Led by the urbanization of
Asian populations |
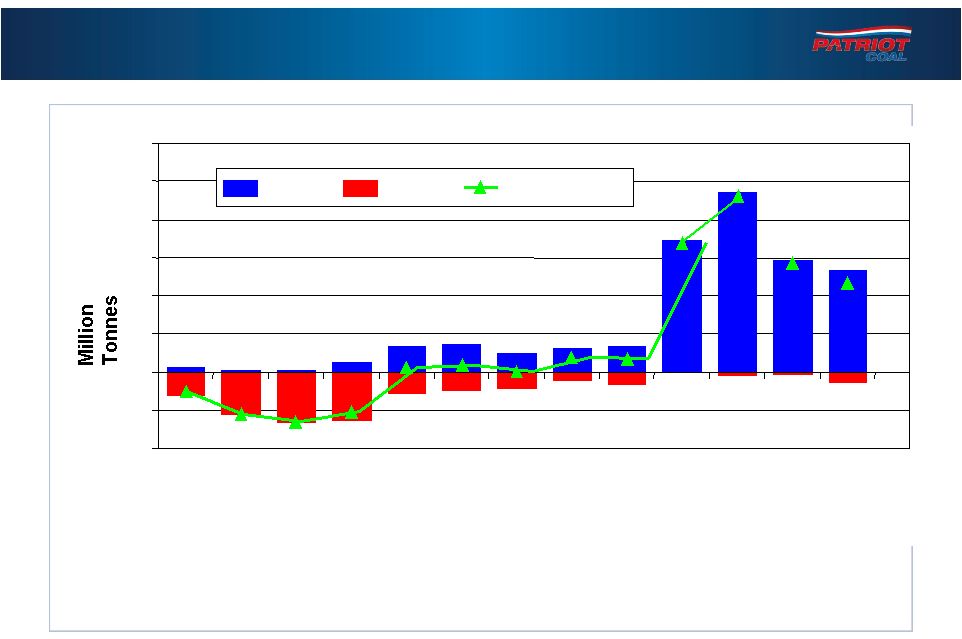 Chinese Met
Coal Trade Net imports of met coal by China remain strong
6
(20)
(10)
0
10
20
30
40
50
60
2000
2001
2002
2003
2004
2005
2006
2007
2008
2009
2010
YTD
Aug
2010
YTD
Aug
2011
Imports
Exports
Net Imports
Source: IHS McCloskey |
 U.S.
Metallurgical Coal Production 7
High
Mid
Low
Total
Estimate
Notes
Alpha
14.6
3.6
1.8
19.9
23.6
1
Arch
6.6
-
1.4
8.0
9.7
2
Walter
-
-
7.2
7.2
6.3
3
Consol
2.4
-
4.6
7.0
10.3
4
Patriot
6.9
-
-
6.9
7.6
5
Cleveland-Cliffs
0.6
-
2.2
2.8
3.2
6
Alliance
1.0
-
-
1.0
1.0
7
Rhino
0.7
-
-
0.7
0.8
8
Others
12.5
4.4
4.4
21.4
22.0
9
Total Estimate
45.2
8.0
21.6
74.8
84.5
Notes:
1. Includes full year of Alpha and Massey; based on shipment
guidance of 9/21/11 2. Includes full year of Arch and
ICG; based on revised earnings guidance of 9/30/11 3.
Based on revised operating plans of 9/21/11 4. Based on
operations update of 10/13/11 5. Based on Q3 2011
earnings release 6. Based on Q2 2011 earnings
release 7. Based on Q2 2011 earnings release
8. Based on Q2 2011 earnings release
9. Patriot estimate
2010
2011 |
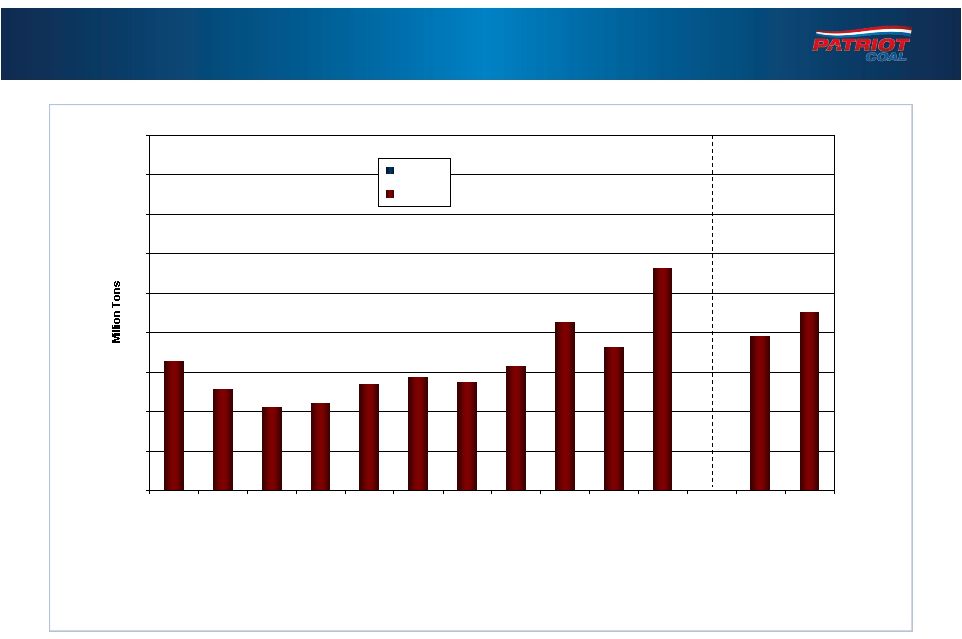
 U.S. Exports of
Met Coal U.S. met exports are at historical highs
8
0
1
2
3
4
5
6
7
8
Jan
Feb
Mar
Apr
May
Jun
Jul
Aug
Sep
Oct
Nov
Dec
5-Year Range
2009
2010
2011 |
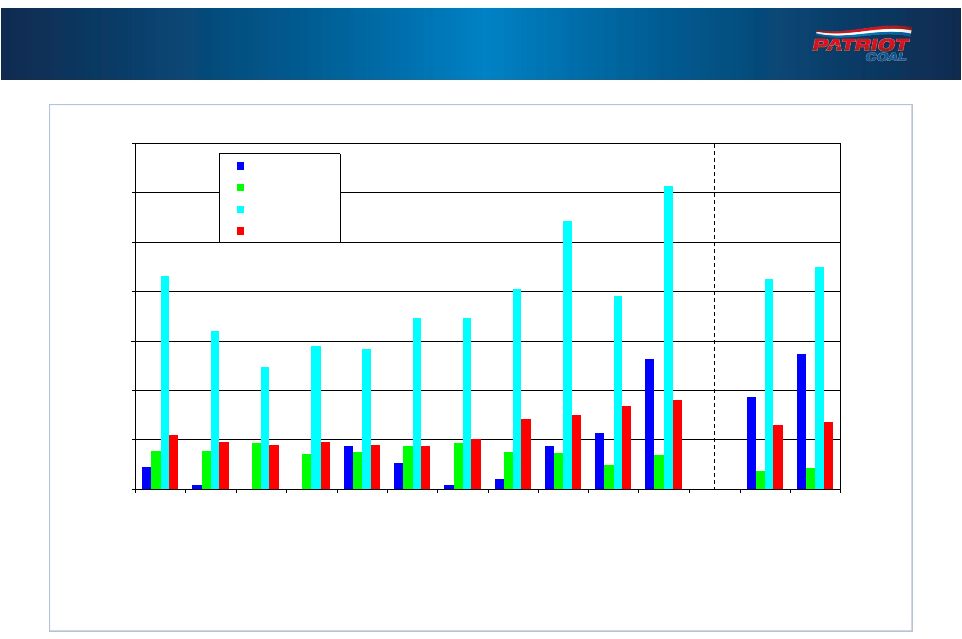 9
U.S. Met Coal Export Destinations
U.S. met exports are growing to three key regions
0
5
10
15
20
25
30
35
2000
2001
2002
2003
2004
2005
2006
2007
2008
2009
2010
YTD
August
2010
YTD
August
2011
Asia
Canada
Europe/Africa
South America |
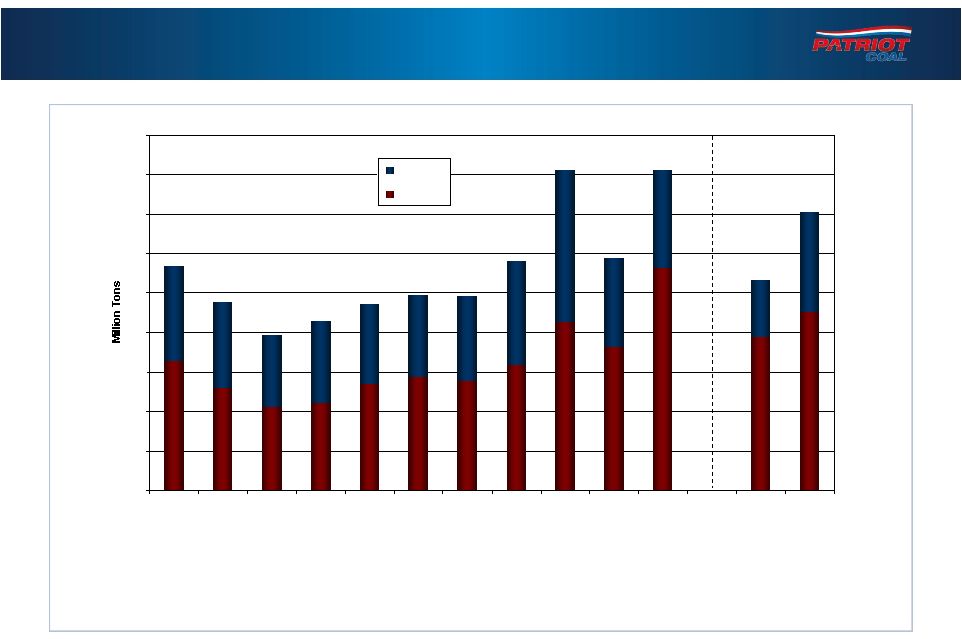
 10
Increasing U.S. Met Coal Exports
YTD August met exports are more than any full year, except 2010
0
10
20
30
40
50
60
70
80
90
2000
2001
2002
2003
2004
2005
2006
2007
2008
2009
2010
YTD
August
2010
YTD
August
2011
Thermal
Met
Updated:
10/25/11
Source: EVA |
 0
10
20
30
40
50
60
70
80
90
2000
2001
2002
2003
2004
2005
2006
2007
2008
2009
2010
YTD
August
2010
YTD
August
2011
Thermal
Met
Updated:
10/25/11
Source: EVA
11
Increasing U.S. Total Coal Exports
U.S. coal exports to approximate 100 million tons in 2011
International buyers looking for geographic diversity of supply |
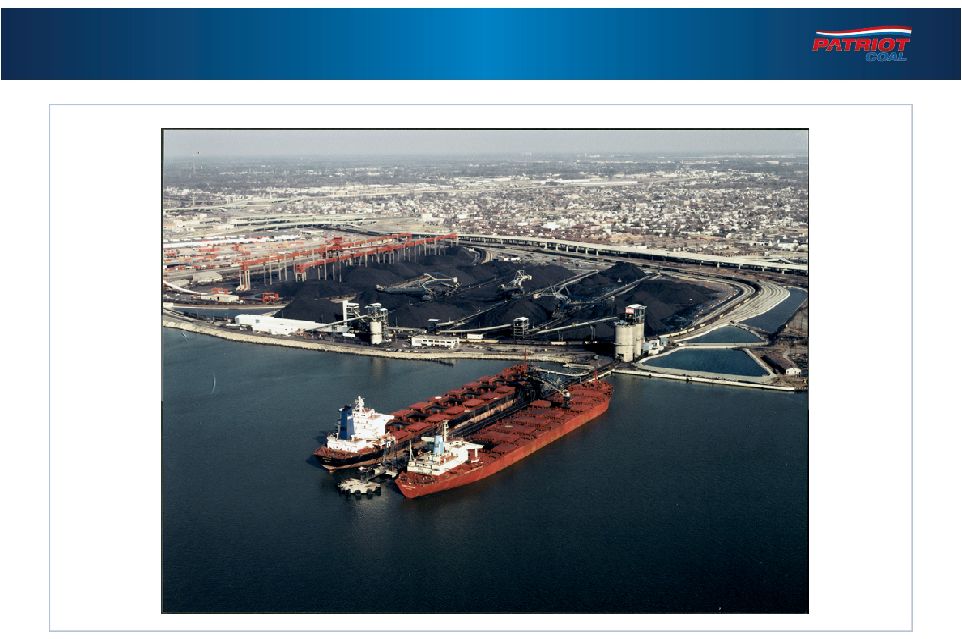
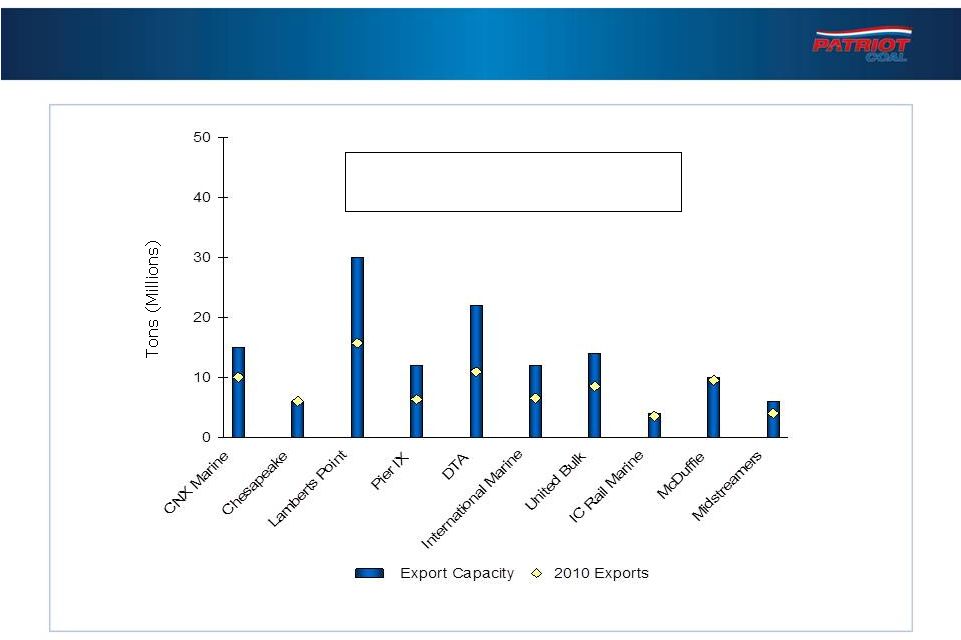 Adequate U.S.
Port Capacity Infrastructure adequate to handle expected exports
12
Total Export Capacity
131 MT
2010 Tons Shipped
81 MT |
 Challenges
13 |
 14
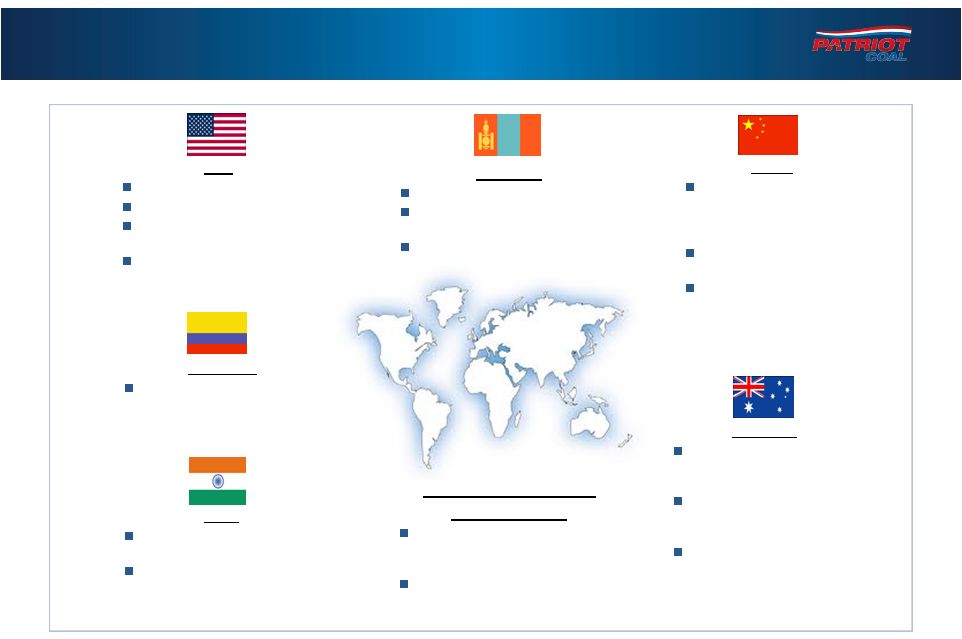
Why Global Coal Supply is Constrained
Global supply constraints are tightening markets
China
Constrained rail & truck
infrastructure makes
shipping within China
difficult
Indigenous met coal is
lower quality
Several years running
as significant net
importer
Indonesia, South Africa,
Russia, Vietnam
Domestic demand increases are
absorbing coal production that
was historically exported
Declining exports
U.S.
Depleting eastern reserves
Difficult permitting
Stricter interpretation of
safety rules
Supply increases will be
difficult
Australia
Regional infrastructure
constraints limit supply
increase
Australian production
recovering from record
rainfall in early 2011
Infrastructure needed to
supply global demand
India
Plentiful indigenous coal
reserves, but lower quality
Inadequate transportation
infrastructure
Colombia
Inadequate infrastructure
limiting further exports
Mongolia
Will eventually supply China
Much work & time to build
infrastructure
Ownership/structural
challenges
China
Constrained rail & truck
infrastructure makes
shipping within China
difficult
Indigenous met coal is
lower quality
Several years running
as significant net
importer
Indonesia, South Africa,
Russia, Vietnam
Domestic demand increases are
absorbing coal production that
was historically exported
Declining exports
U.S.
Depleting eastern reserves
Difficult permitting
Stricter interpretation of
safety rules
Supply increases will be
difficult
Australia
Regional infrastructure
constraints limit supply
increase
Australian production
recovering from record
rainfall in early 2011
Infrastructure needed to
supply global demand
Australia
Regional infrastructure
constraints limit supply
increase
Australian production
recovering from record
rainfall in early 2011
Infrastructure needed to
supply global demand
India
Plentiful indigenous coal
reserves, but lower quality
Inadequate transportation
infrastructure
Colombia
Inadequate infrastructure
limiting further exports
Colombia
Inadequate infrastructure
limiting further exports
Mongolia
Will eventually supply China
Much work & time to build
infrastructure
Ownership/structural
challenges |
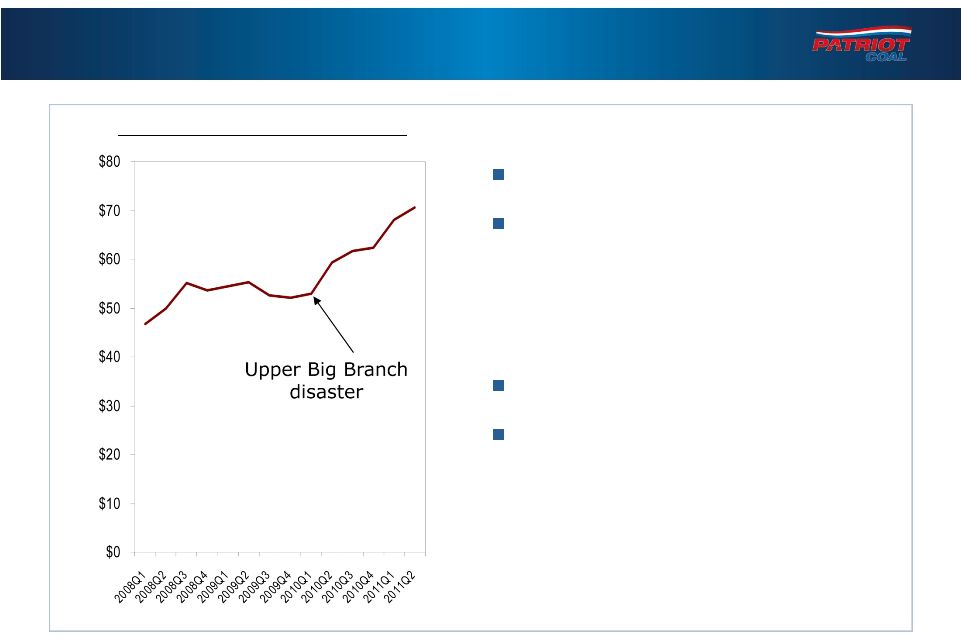 Higher
Industry Cost per Ton in Appalachia More difficult geology
Heightened regulatory scrutiny
–
MSHA and state inspections
–
MSHA & Army Corps of Engineers
permitting delays
–
Clean Water Act impediments
Availability of labor
Higher cost inputs
–
Labor
–
Diesel fuel
–
Steel-based equipment &
supplies
15
Industry Average Cost per Ton |
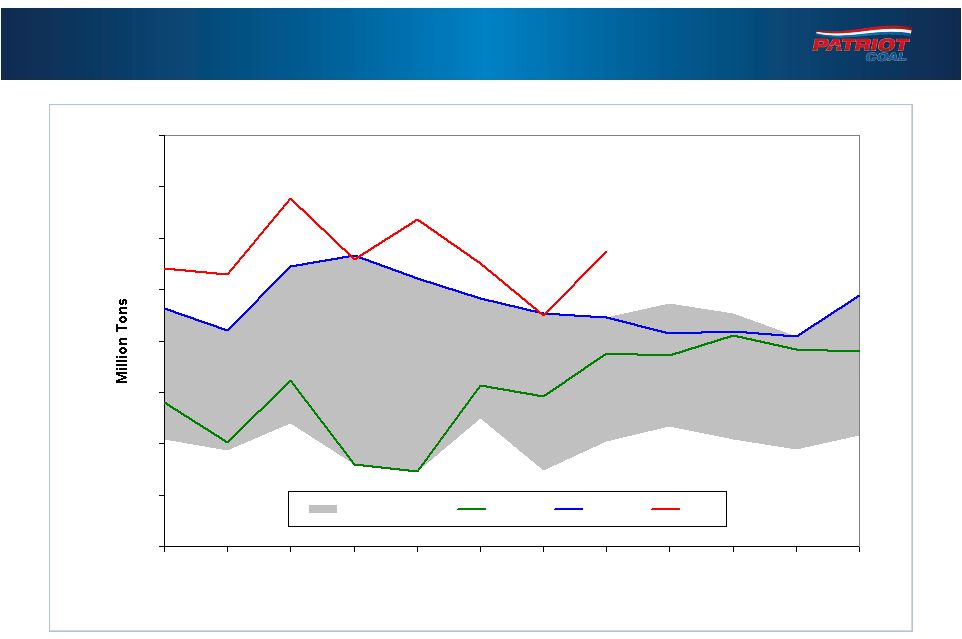
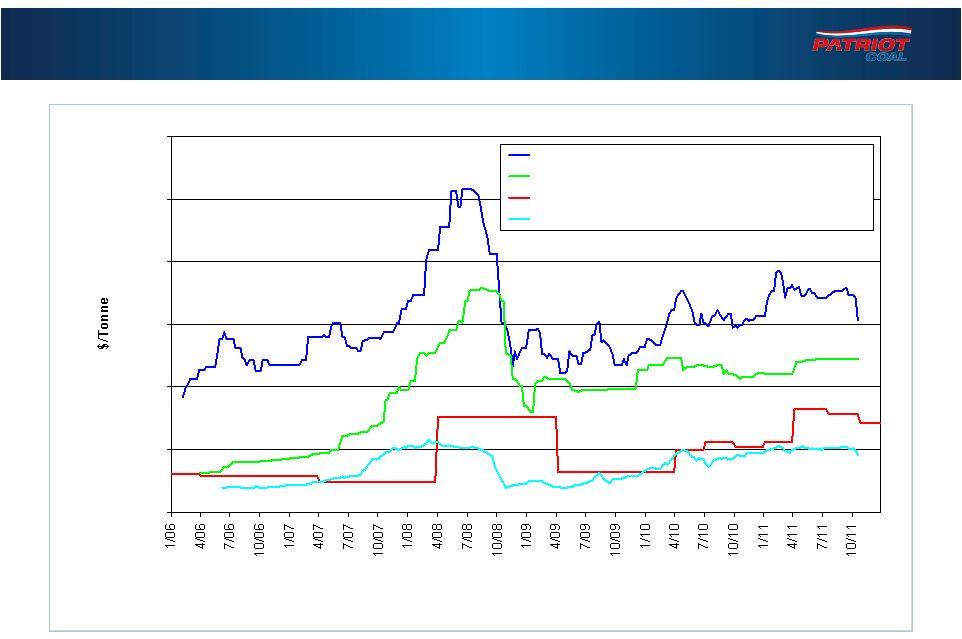 Steel Prices
versus Raw Material Costs Steel prices remain historically high
16
0
200
400
600
800
1,000
1,200
China Export Hot-Rolled Coil Steel, FOB main China Port
China Coke Export Price
Australian Hard Coking Coal, FOBT
Chinese Iron Ore Import Price
10/26/11
Updated:
Source: Metal Bulletin, Steel Business Briefing Commodities Research, McCloskey
|
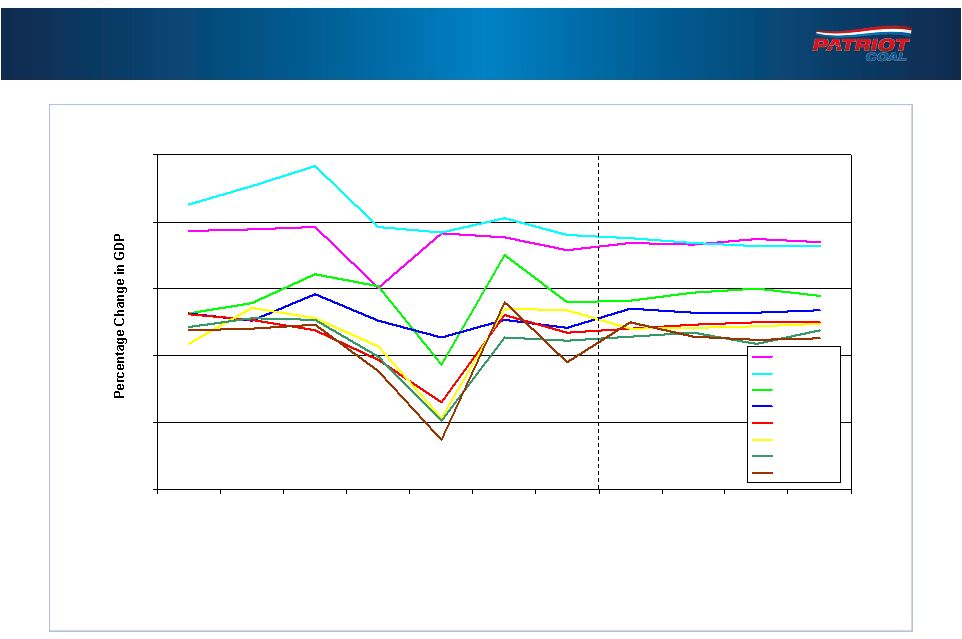 -10
-5
0
5
10
15
2005
2006
2007
2008
2009
2010
2011
2012
2013
2014
2015
India
China
Brazil
Australia
USA
Germany
UK
Japan
Source: Economist Intelligence Unit (The Economist)
Concerns about Global Economies
17
Chinese & Indian economies expected to remain strong
All global economies growing |
 Opportunities
for Patriot 18 |
 How Patriot
Will Participate Strategy –
Focus on growth markets
–
Expand metallurgical coal production
–
Increase exports –
Both met and thermal
Leverage to the market
–
Met Build-Out to 11 million tons annually
–
Legacy thermal contract roll-off
Culture
–
Strong safety program & environmental stewardship
–
Disciplined approach, focused on planning and execution
Future growth
–
Organic –
Strong reserve base
–
M&A –
Bolt-on and transformational
Product & transportation flexibility
19 |
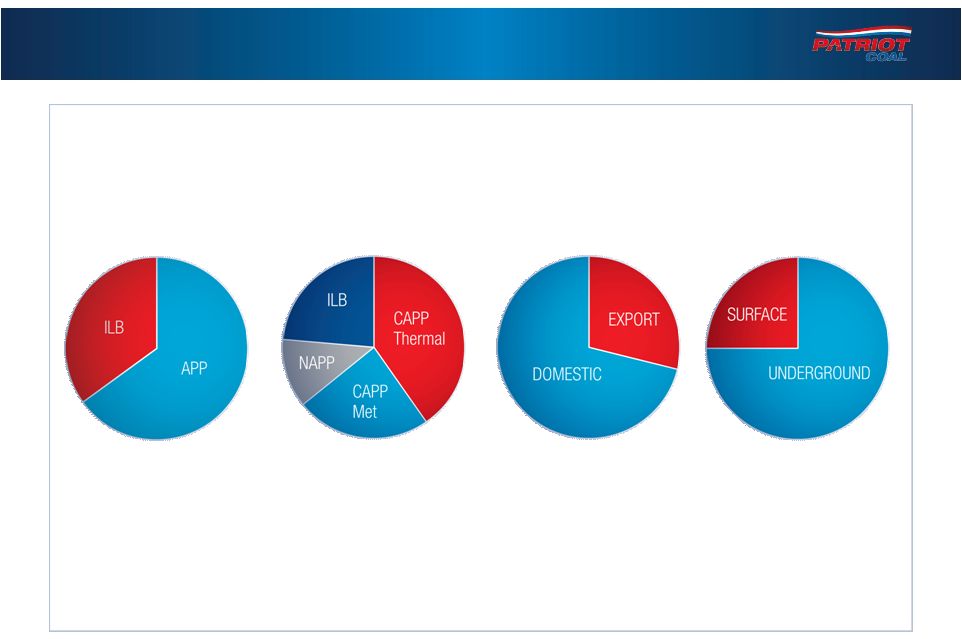 20
Product Diversification
Diverse locations, products & mining methods
Significant met & thermal coal exports
Mining
Method
YTD Sept ’11
Tons Sold
23.5 Million Tons
Reserves
1.9 Billion Tons
YTD Sept ’11
Shipments |
 21
Multiple Basins & Coal Qualities
Northern Appalachia Thermal
Federal
Central Appalachia Metallurgical
Kanawha Eagle
Paint Creek/Winchester
Panther
Rocklick
Wells
Central Appalachia Thermal
Big Mountain
Blue Creek
Campbell’s Creek
Corridor G
Logan County
Illinois Basin Thermal
Bluegrass
Dodge Hill
Highland
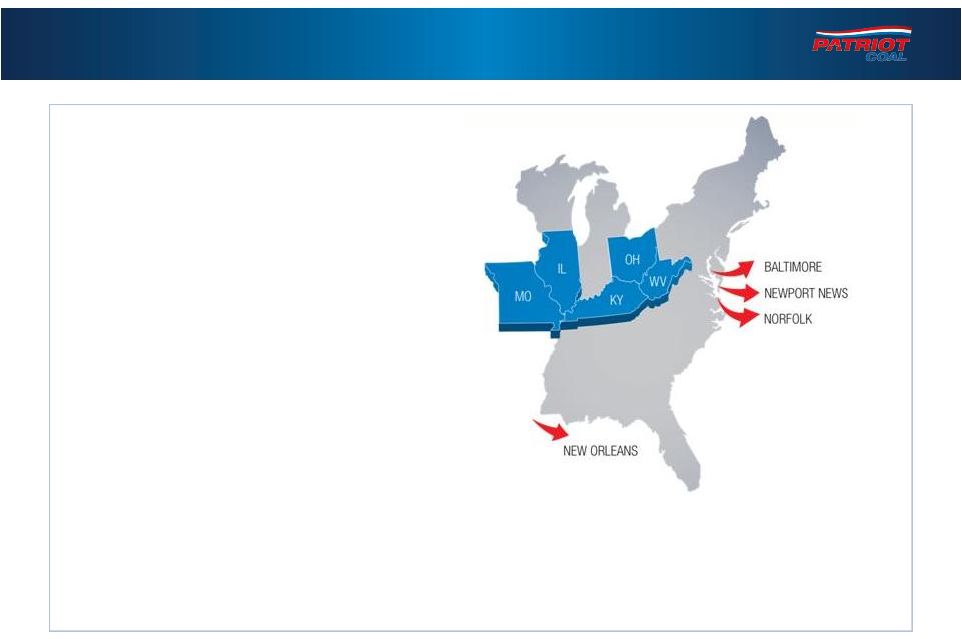
Multiple quality & transportation options
Transportation Optionality
Rail
Barge
East Coast & Gulf exports |
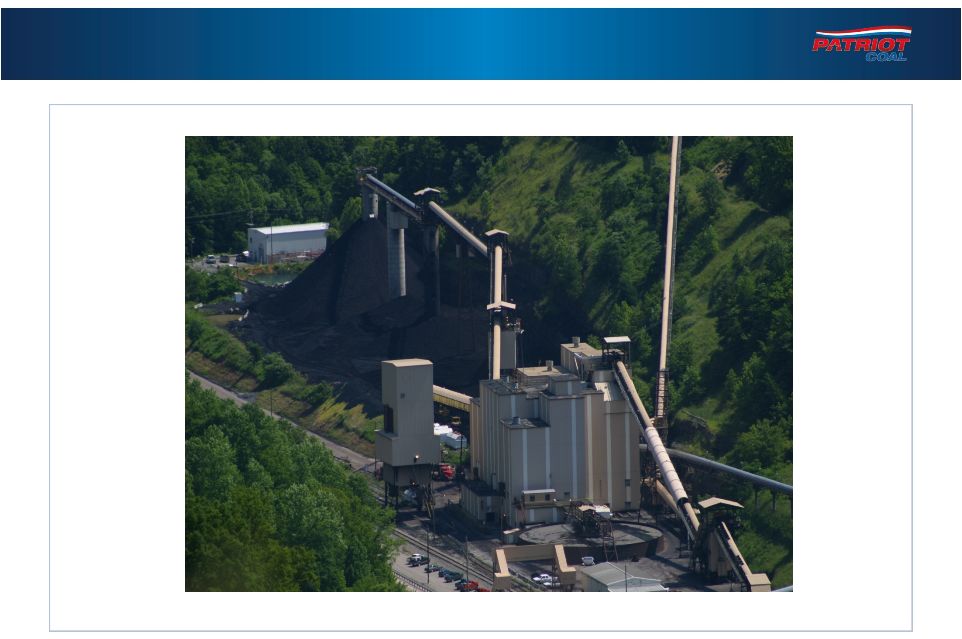
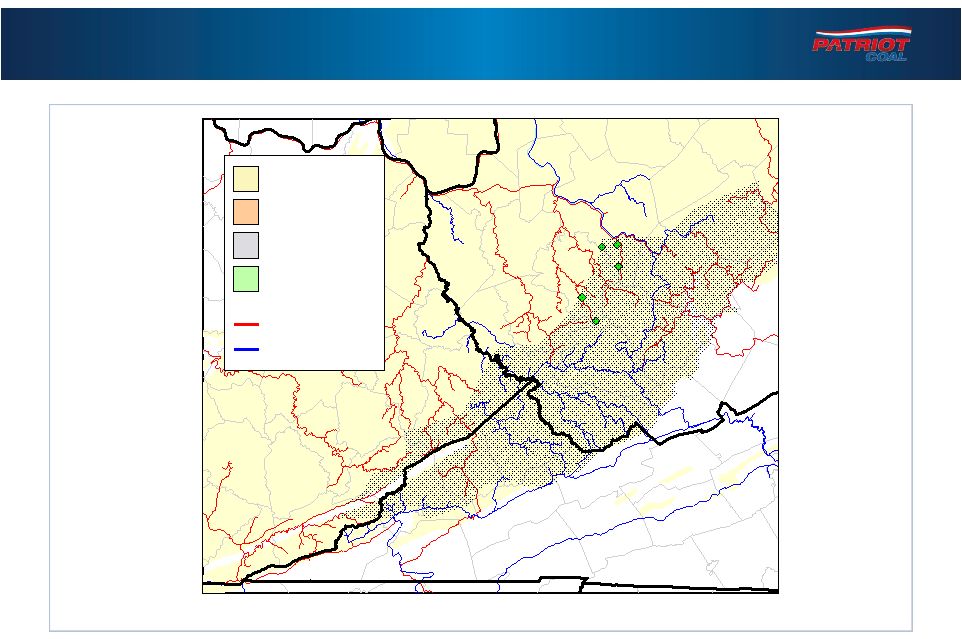       Patriot Met Coal
Complexes 22
Patriot produces premium high-volatile met coal
Rocklick
Wells
Winchester
Kanawha Eagle
Panther
Thermal
High-Vol
Mid-Vol
Low-Vol
CSX
NS |
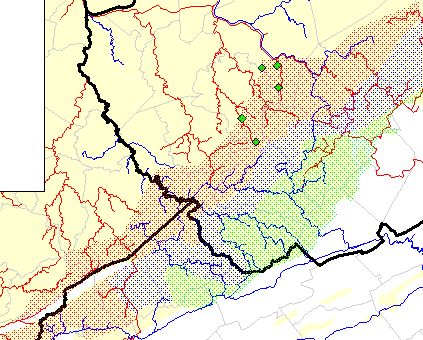
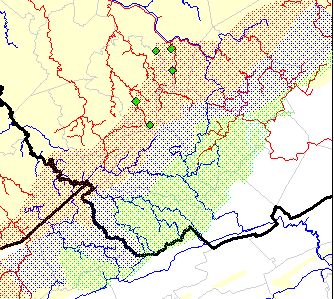
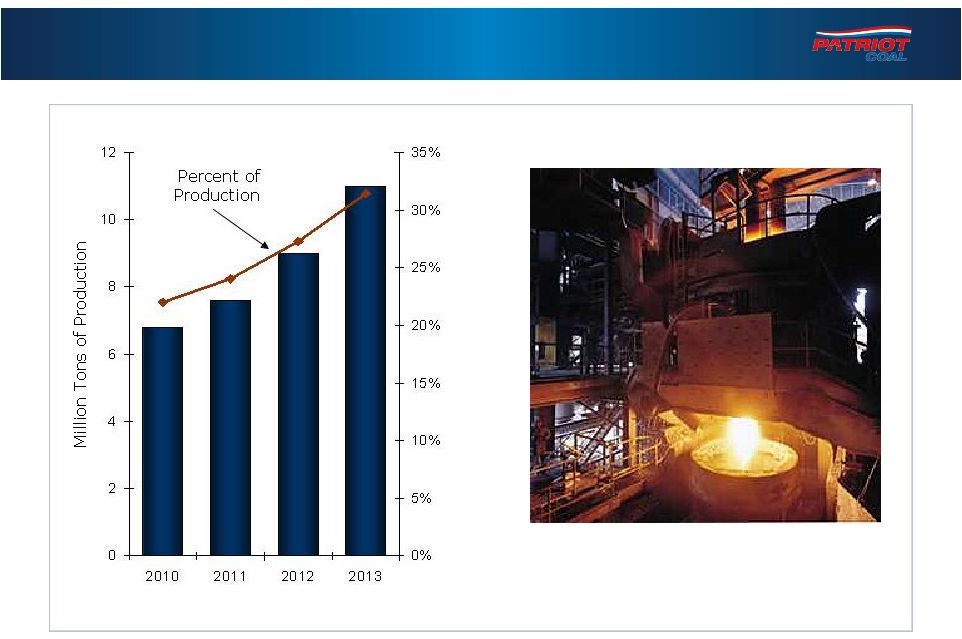 23
Opening new met mines to meet rising worldwide demand
Patriot Met Build-Out Program |
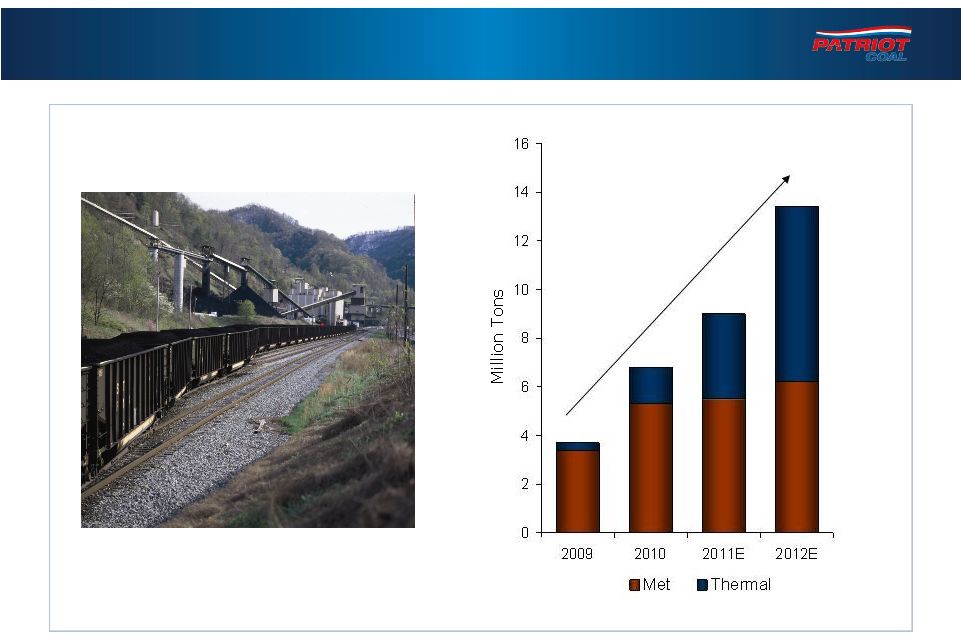 Increasing
Exports at Patriot Expect double-digit exports in 2012
+260% increase
24 |
 Contact:
Janine Orf
Vice President –
Investor Relations
314.275.3680
jorf@patriotcoal.com
FINANCIAL COMMUNITY PRESENTATION
November 1, 2011
Met Coke World Summit 2011 |