Attached files
| file | filename |
|---|---|
| 8-K - FORM 8-K - SUSQUEHANNA BANCSHARES INC | d248623d8k.htm |
 Exhibit 99.1 |
 Susquehanna Bancshares, Inc.
Lititz, Pennsylvania
William J. Reuter –
Chairman and CEO
Drew K. Hostetter –
Chief Financial Officer
Michael M. Quick –
Chief Corporate Credit Officer |
 Forward-Looking Statements
During the course of this presentation, we may make projections and other
forward-looking statements regarding events or the future financial performance
of Susquehanna, including the impact of the acquisition of Abington
Bancorp and the planned acquisition of Tower Bancorp, as well as
projected
capital ratios, efficiency ratios, net income and earnings. We wish to
caution you that these forward-looking statements may differ materially
from actual results due to a number of risks and uncertainties. For a
more detailed description of the factors that may affect Susquehanna’s
operating results, we refer you to our filings with the Securities &
Exchange Commission, including our quarterly report on Form 10-Q for the
quarter ended June 30, 2011, and our annual report on Form 10-K for the
year ended December 31, 2010. Susquehanna assumes no obligation to update
the forward-looking statements made during this presentation.
For more information, please visit our Web site at:
www.susquehanna.net |
 Geography
Susquehanna Profile
Susquehanna Profile
Overview
Size
Headquartered in Lititz, PA
Offers tailored products and services through its community bank, trust
and investment company, asset management, P&C insurance brokerage,
and leasing companies
240 branches in PA, NJ, MD, WV
$15.5 billion in assets
$10.3 billion in deposits
$6.1 billion in assets under management & administration
Shareholder
base
156.8 million shares outstanding
31,900 shareholders (record and street)
77% institutional holders
1 |
 November
2008
Received
$300mm
TARP
preferred
equity
April 2002
Announced
acquisition
of Addis
Group
(Deal
value:
$17mm)
April 1998
Announced
acquisition
of Cardinal
Bancorp
(Deal
value:
$49mm)
April 1998
Announced
acquisition
of First
Capitol
Bank
(Deal
value:
$27mm)
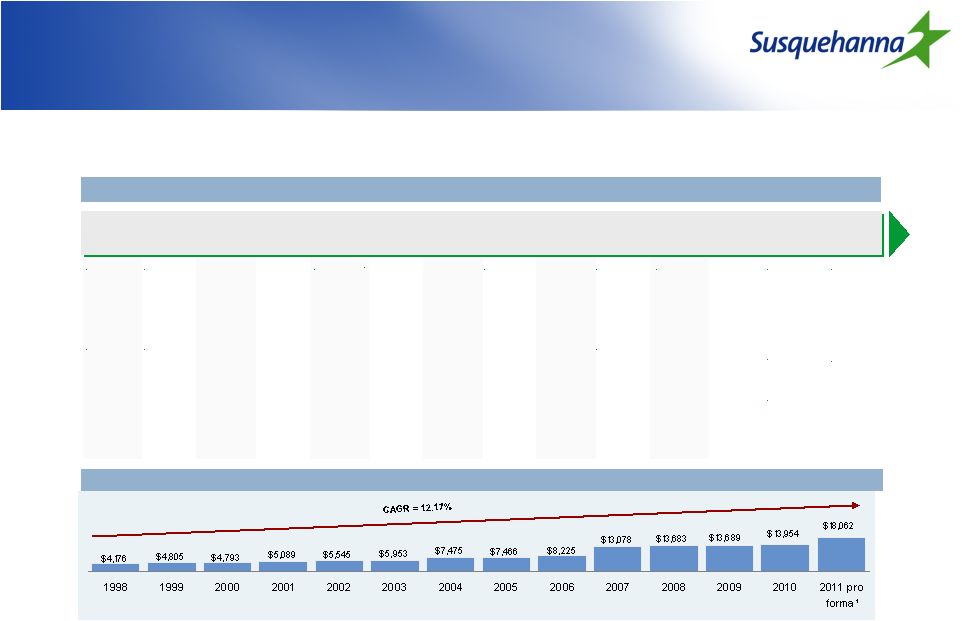
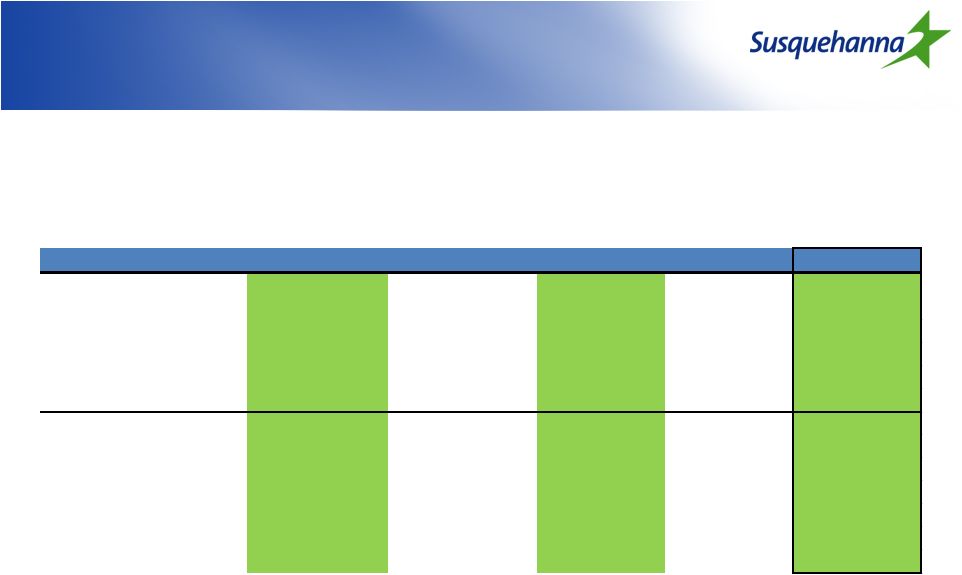
Susquehanna has built a strong
franchise over time
Susquehanna has built a strong
franchise over time
Assets ($ millions)
1998
2000
2001
November
1999
Announced
acquisition
of Hann
Finl. Corp.
(Deal value:
$42mm)
December
1999
Announced
acquisition
of Valley
Forge Asset
Mgmt
(Deal value:
$19mm)
2002
2004
December
2003
Announced
acquisition
of Patriot
Bank
(Deal value:
$210mm)
2006
2003
November
2005
Announced
acquisition
of Minotola
Bank
(Deal value
$166mm)
2005
2007
April 2007
Announced
acquisition
of
Community
Banks
(Deal value
$852mm)
December
2007
Announced
acquisition
of Stratton
Holding
Company
2008
2009
2010
2011
January
2011
Announced
acquisition
of Abington
Bancorp
(Deal value:
$268mm)
June 2011
Announced
acquisition
of Tower
Bancorp
(Deal value:
$345mm)
1999
Source: Company filings, FactSet, SNL Financial
¹
As of September 30, 2011; Pro forma for Abington and Tower acquisitions
2
March 2010
Raised
$345mm in
common
equity and
$50mm of
Trust
preferred
securities
April 2010
Repaid
$200mm
TARP
December
2010
Repaid the
remaining
$100mm
TARP |
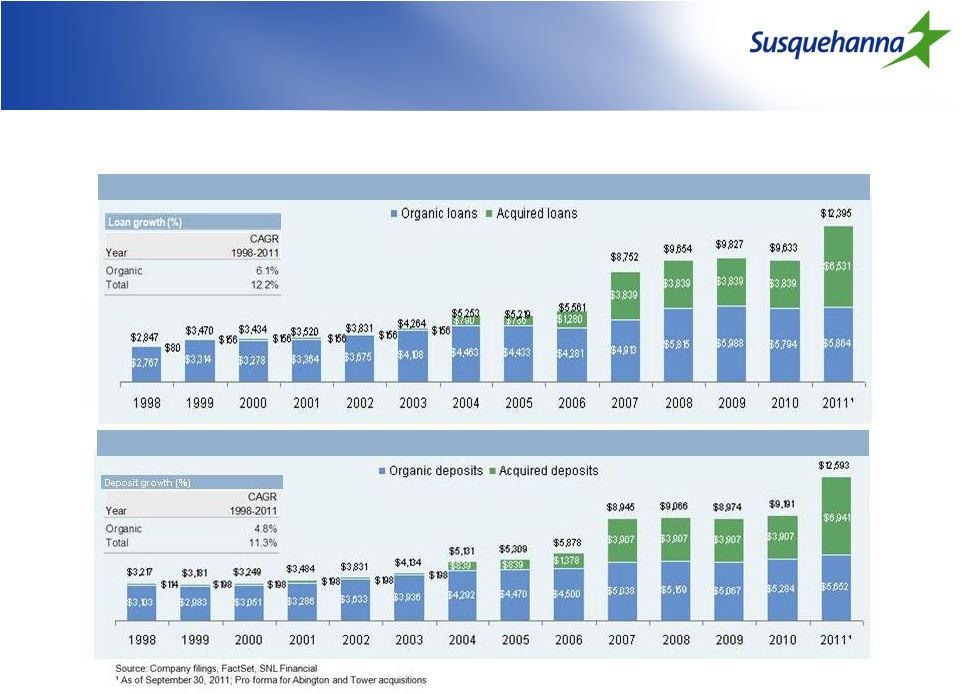 Strong
organic growth supported by acquisitions
Strong organic growth supported by
acquisitions
Loan growth ($mm)
Deposit growth ($mm)
3 |
 Improved Market Position in Focus
Markets
Improved Market Position in Focus
Markets
Sorted by 2011 market rank
4
MSA
2005
2011
% Change
2005
2011
Change
Current Rank 1-3
Sunbury, PA
18.7%
21.7%
3.0%
1
1
Flat
Hagerstown-Martinsburg, MD-WV
19.0%
30.2%
11.2%
1
1
Flat
Lancaster, PA
12.9%
25.1%
12.2%
3
1
+ 2
Chambersburg, PA
13.4%
28.6%
15.2%
5
1
+ 4
Cumberland, MD-WV
24.8%
44.0%
19.2%
2
1
+ 1
Williamsport, PA
14.2%
13.1%
-1.1%
3
3
Flat
York-Hanover, PA
3.5%
12.7%
9.2%
11
3
+ 8
Gettysburg, PA
0.0%
10.3%
10.3%
N/A
3
N/A
Vineland-Millville-Bridgeton, NJ
0.0%
13.6%
13.6%
N/A
3
N/A
Current Rank 4-8
Selinsgrove, PA
8.4%
11.1%
2.7%
5
4
+ 1
Pottsville, PA
0.0%
10.6%
10.6%
N/A
4
N/A
Harrisburg-Carlisle, PA
0.0%
8.3%
8.3%
N/A
5
N/A
Baltimore-Towson, MD
2.0%
1.8%
-0.3%
9
7
+ 2
Lewisburg, PA
2.5%
2.2%
-0.3%
7
7
Flat
Atlantic City-Hammonton, NJ
0.0%
5.1%
5.1%
N/A
8
N/A
Philadelphia-Camden-Wilmington, PA-NJ-DE-MD
0.4%
2.2%
1.8%
24
8
+ 16
Reading, PA
2.9%
3.9%
1.0%
9
8
+ 1
Source: SNL Financial
MSA Rank by Market Share
Market Share |
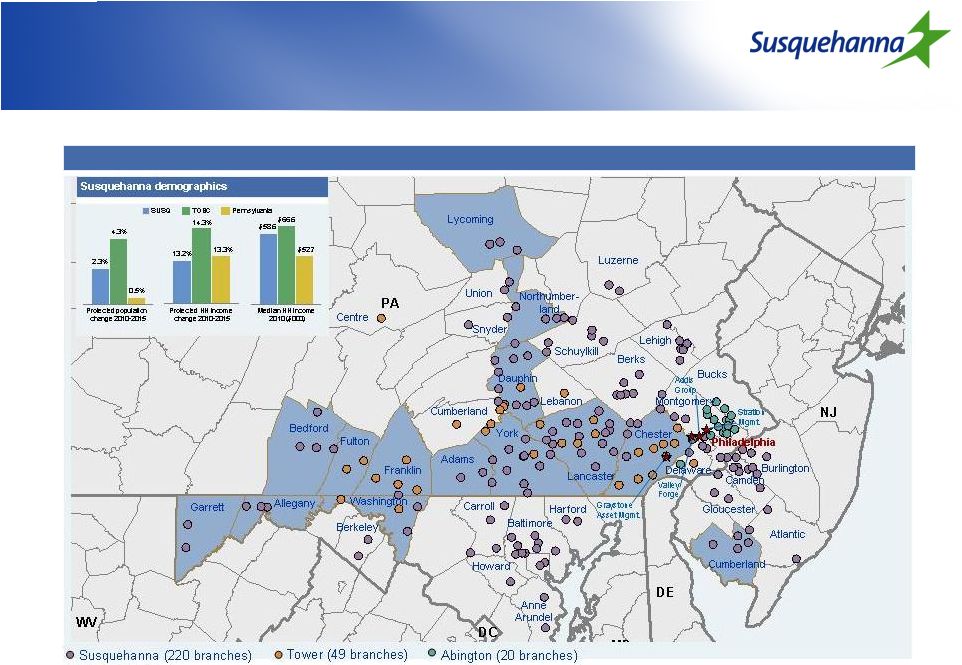 Continues Susquehanna’s expansion
into attractive markets
Continues Susquehanna’s expansion
into attractive markets
5
Susquehanna pro forma¹
branch map
Source: SNL Financial
Note: Shaded counties indicate those in which Susquehanna holds a top 3 market
position ¹
Susquehanna pro forma includes Tower and Abington |
 Few
independent players of scale Few independent players of scale
6
Deposit market share in Pennsylvania
Independent bank deposit market share in PA, MD, NJ
Source: SNL Financial
Note: Regulatory branch and deposit data as of June 30, 2011; banks and thrifts with
PA/MD/NJ deposits > 90% total deposits ¹
Susquehanna has 3 additional branches in West Virginia
Rank
Company
Deposits
% of Total DepositsBranches
1
Susquehanna (Proforma w/Tower)
$12.3
99%
2881
1
Fulton Financial Corp.
11.6
94%
252
2
Susquehanna Bancshares Inc.
10.2
99%
2391
3
Valley National Bancorp
8.1
83%
173
4
F.N.B. Corp.
7.1
96%
236
5
Investors Bancorp Inc. (MHC)
6.8
98%
78
6
National Penn Bancshares Inc.
6.0
100%
129
7
Northwest Bancshares Inc.
5.3
88%
148
8
Provident Financial Services Inc.
5.0
100%
83
9
First Commonwealth Financial Corp.
4.6
100%
112
10
Beneficial Mutual Bancorp Inc. (MHC)
3.8
100%
60
11
S&T Bancorp Inc.
3.3
100%
50
12
Dollar Bank Federal Savings Bank
3.2
66%
36
13
Sun Bancorp Inc.
2.8
100%
63
14
Sandy Spring Bancorp Inc.
2.4
92%
37
15
Lakeland Bancorp Inc.
2.2
100%
48
16
Tower Bancorp Inc.
2.2
100%
49
17
Kearny Financial Corp. (MHC)
2.2
100%
41
18
Firstrust Savings Bank
1.9
100%
24
19
Metro Bancorp Inc.
1.9
100%
33
Total PA / MD / NJ
Rank
Company
Branches
Deposits
($MM)
Market
Share (%)
1
PNC Financial Services Group Inc.
509
$ 62,259
20.7%
2
Wells Fargo & Co.
294
36,133
12.0%
3
Royal Bank of Scotland Group Plc
386
24,688
8.2%
4
Banco Santander SA
169
11,047
3.7%
5
Toronto-Dominion Bank
95
10,981
3.7%
6
Bank of New York Mellon Corp.
6
9,317
3.1%
7
Susquehanna Bancshares Inc. (Proforma w/Tower)
214
8,908
3.0%
7
M&T Bank Corp.
205
8,468
2.8%
8
Bank of America Corp.
99
8,253
2.8%
9
Fulton Financial Corp.
135
7,259
2.4%
10
F.N.B. Corp.
237
7,110
2.4%
11
Susquehanna Bancshares Inc.
167
6,821
2.3%
12
First Niagara Financial Group Inc.
136
6,450
2.2%
13
National Penn Bancshares Inc.
128
5,991
2.0%
14
Northwest Bancshares Inc.
143
4,997
1.7%
15
First Commonwealth Financial Corp.
112
4,556
1.5%
16
S&T Bancorp Inc.
50
3,365
1.1%
17
Dollar Bank Federal Savings Bank
36
3,204
1.1%
18
Huntington Bancshares Inc.
62
2,905
1.0%
19
Beneficial Mutual Bancorp Inc. (MHC)
35
2,237
0.7%
20
Tower Bancorp Inc.
47
2,087
0.7% |
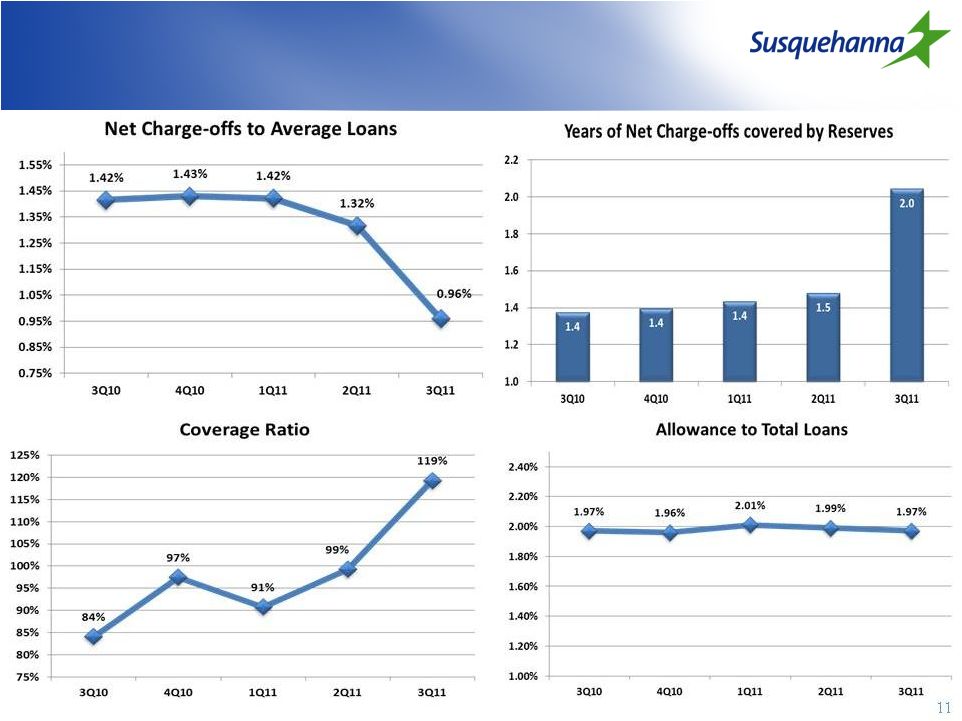
 Third
Quarter Financial Highlights Third Quarter Financial Highlights
Significant Improvement in Credit Quality
NCO/Average Loans = 0.96%, 1
st
time below 1.00% since economic downturn
NPA/Loans & OREO = 1.95%, 1
st
time below 2.00% since economic downturn
Negative NPA Generation of $6M, 1
st
time negative since economic downturn
Loan portfolio contraction halted, as net loans & leases grew 1%
from prior
quarter
Core deposits increased 5.6% from prior quarter and 9.0% from prior year
Strong capital position that meets fully-phased-in requirements of Basel
III 7 |
 Quarterly Loan Originations
8
Average
Balance
($ in Millions)
Balance
Originations
Balance
Originations
Balance
Originations
Balance
Originations
Balance
Originations
Commercial
1,632
91
1,609
106
1,558
63
1,549
120
1,531
154
Real Estate -
Const & Land
848
53
818
56
805
53
750
49
728
63
Real Estate -
1-4 Family Res
1,526
13
1,470
21
1,428
34
1,410
38
1,413
55
Real Estate -
Commercial
3,342
57
3,280
81
3,262
84
3,286
146
3,264
108
Real Estate -
HELOC
646
83
714
103
760
60
802
66
842
68
Tax-Free
253
17
245
10
292
58
305
12
317
7
Consumer Loans
565
35
589
31
612
33
646
44
685
45
VIE
227
-
219
-
214
-
206
-
201
-
Total
9,039
$
349
$
8,944
$
408
$
8,931
$
385
$
8,954
$
475
$
8,981
$
500
$
3Q10
4Q10
1Q11
2Q11
3Q11 |
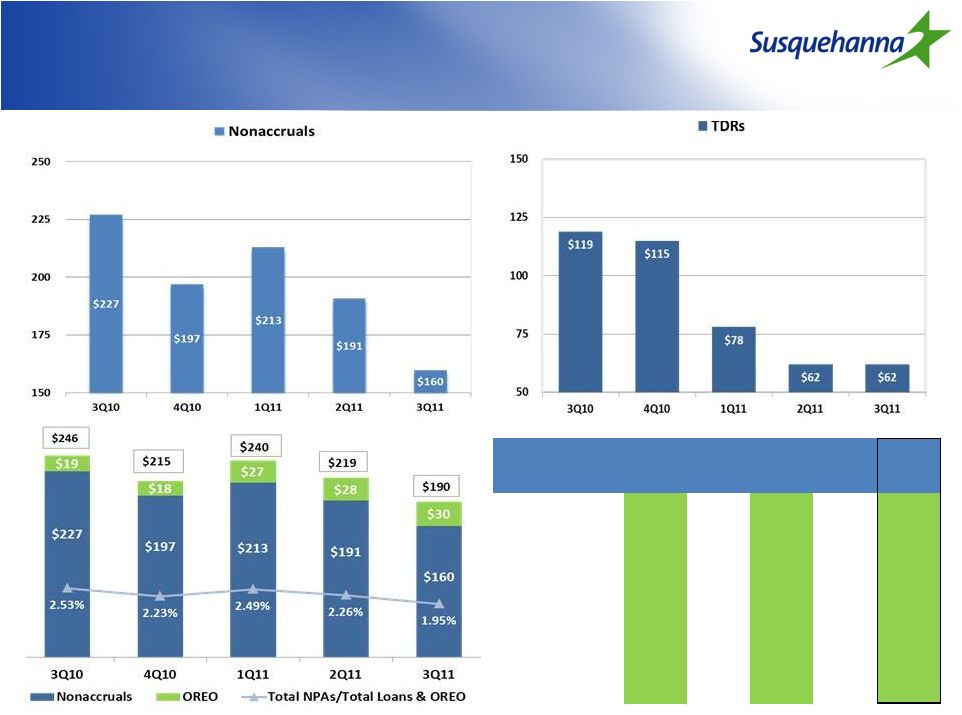 Asset
Quality ($ in Millions)
Asset Quality
($ in Millions)
9
($ in millions)
3Q10
4Q10
1Q11
2Q11
3Q11
NPL's Beginning of Period
237.4
$
227.4
$
196.9
$
212.9
$
190.7
$
-
New NonAccruals
37.3
$
43.6
$
61.2
$
23.4
$
20.4
$
-
Cure/Exits/Other
(23.0)
$
(36.3)
$
(4.7)
$
(13.5)
$
(28.8)
$
-
Gross Charge-Offs
(17.7)
$
(25.9)
$
(27.4)
$
(21.7)
$
(14.8)
$
-
Transfer to OREO
(6.5)
$
(11.9)
$
(13.0)
$
(10.4)
$
(7.5)
$
NPL's End of Period
227.4
$
196.9
$
212.9
$
190.7
$
160.1
$ |
 Asset
Quality ($ in Millions)
Asset Quality
($ in Millions) |
 Asset
Quality Asset Quality |
 Capital Ratios
Pro Forma
3/31/2012
At
9/30/2011
At
12/31/2010
Management Target
Tangible Common Equity
8.10%
7.74%
7.57%
7.50%
Tier 1 Common/RWA
10.20%
9.81%
9.58%
8.00%
Leverage
10.20%
10.39%
10.27%
6.00%
Tier 1 Risk-Based
12.60%
12.86%
12.65%
9.50%
Total Risk-Based
15.10%
14.93%
14.72%
11.50%
Capital at
3/31/2012
($ in millions)
Excess Over
Management Target
($ in millions)
Tangible Common Equity
$1,375
$ 97
Tier 1 Common Equity
1,397
295
Leverage
1,730
710
Tier 1 Capital
1,730
422
Total Risk-Based Capital
2,079
495
12 |
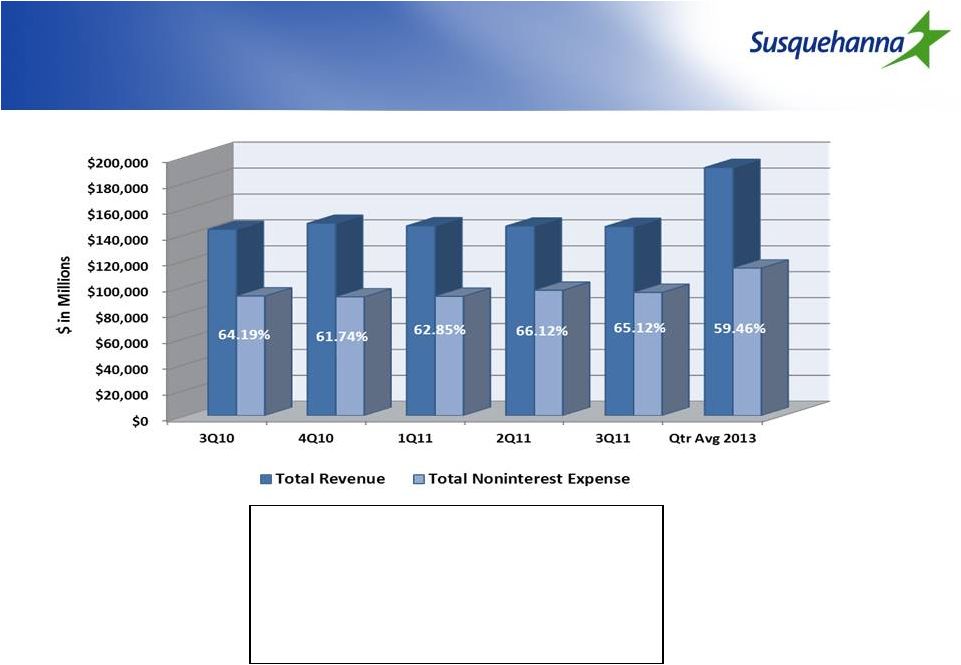  Efficiency Ratio
Key Initiatives
Abington Cost Saves of $8.0MM
Tower Cost Saves of $30.0MM
Susquehanna Cost Saves of $20.0MM
13
* Efficiency Ratio based on SNL Methodology |
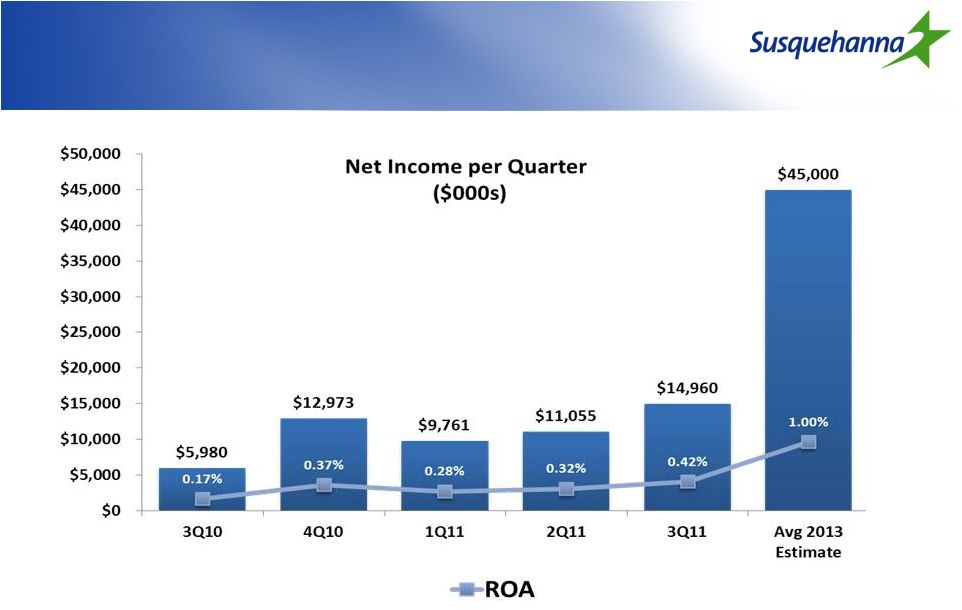 Net
Income Net Income
14 |
 Earnings Drivers
15
($000)
3Q10
4Q10
1Q11
2Q11
3Q11
Q Average
2013
Avg. interest-earning assets
$12,070,477
$12,084,056
$12,141,223
$12,171,868
$12,275,793
$17,272,600
Net interest margin (FTE)
3.58%
3.61%
3.63%
3.62%
3.58%
3.52%
Net interest income
105,411
106,573
105,023
106,086
106,839
146,575
Noninterest income
35,407
39,788
37,467
37,054
36,800
44,975
Total revenue
140,818
146,361
142,490
143,140
143,639
191,550
Noninterest expense
96,212
95,971
95,883
101,157
100,745
113,900
Pre-tax, pre-provision income
44,606
50,390
46,607
41,983
42,894
77,650
Provision for loan losses
40,000
35,000
35,000
28,000
25,000
12,000
Pre-tax income
$4,606
$15,390
$11,607
$13,983
$17,894
$65,650 |
 Investment Securities
$ in millions
EOP Balance
QTR Yield
3Q10
4Q10
1Q11
2Q11
3Q11
Total Investment Securities
$2,372
$2,418
$2,480
$2,624
$2,700
Duration (years)
3.5
4.2
4.2
3.9
3.6
Yield
3.64%
3.73%
3.73%
3.61%
3.32%
Unrealized Gain/(Loss)
$36.7
($19.9)
($7.9)
$25.5
$42.0
16 |
 Loan
Mix & Yield Loan Mix & Yield
17
$ in millions
Avg Bal QTR
INT % QTR
LOANS
Commercial
1,632
5.39%
1,609
5.33%
1,558
5.31%
1,549
5.10%
1,531
5.38%
Real Estate -
Const & Land
848
4.71%
818
4.75%
805
4.62%
750
4.74%
728
4.74%
Real Estate -
1-4 Family Res
1,526
5.99%
1,470
5.99%
1,428
5.93%
1,410
5.89%
1,413
5.81%
Real Estate -
Commercial
3,342
5.63%
3,280
5.67%
3,262
5.54%
3,286
5.51%
3,264
5.47%
Real Estate -
HELOC
646
3.69%
714
3.68%
760
3.65%
802
3.61%
842
3.60%
Tax-Free
253
6.20%
245
5.74%
292
5.74%
305
5.62%
317
6.06%
Consumer Loans
565
6.31%
589
6.31%
612
6.19%
646
6.18%
685
5.61%
Commercial Leases
274
8.09%
275
8.15%
267
8.28%
276
8.11%
285
7.92%
Consumer Leases
408
5.40%
389
5.35%
386
5.36%
390
5.13%
380
4.90%
VIE
227
4.74%
219
4.71%
214
4.67%
206
4.62%
201
4.58%
Total Loans
9,721
5.53%
9,608
5.51%
9,584
5.43%
9,620
5.37%
9,646
5.34%
3Q10
4Q10
1Q11
2Q11
3Q11 |
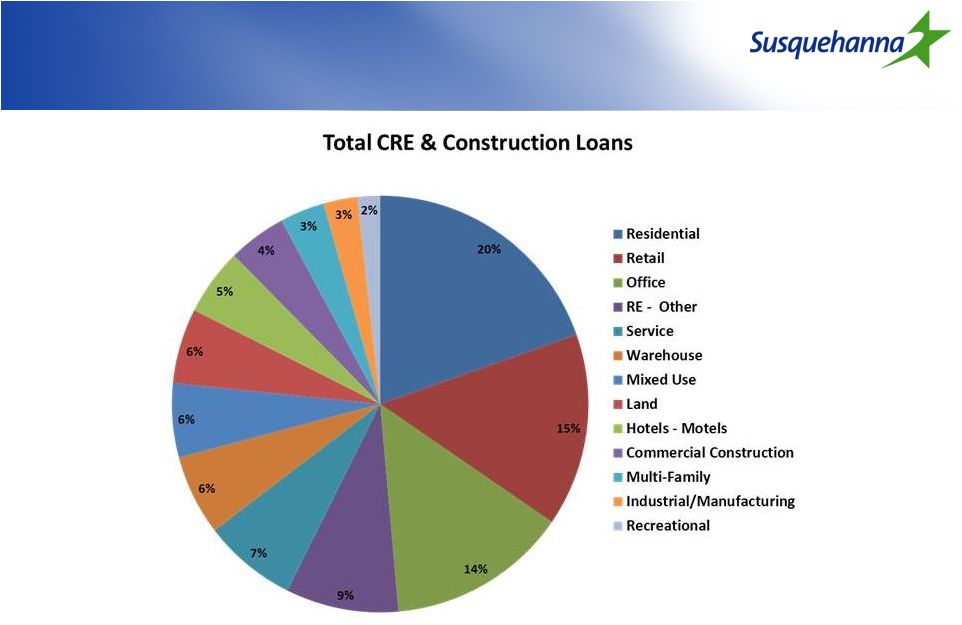 Collateral Type Distribution of
CRE -
3Q11
Collateral Type Distribution of
CRE -
3Q11
18 |
 Deposit Mix & Cost by Product
19
$ in millions
Avg Bal QTR
INT % QTR
Deposits
Demand
1,341
0.00%
1,380
0.00%
1,340
0.00%
1,382
0.00%
1,401
0.00%
Interest Bearing Demand
3,487
0.62%
3,638
0.62%
3,687
0.61%
3,653
0.58%
3,797
0.52%
Savings
770
0.15%
765
0.15%
780
0.15%
807
0.15%
797
0.14%
Certificates of Deposits
3,607
2.11%
3,470
2.00%
3,436
1.79%
3,501
1.62%
3,491
1.55%
Total Interest-Bearing Deposits
7,864
1.26%
7,873
1.18%
7,903
1.08%
7,961
0.99%
8,085
0.93%
Core Deposits/Total
60.8%
62.5%
62.8%
62.5%
63.2%
Loans(excluding VIE)/Deposits
103.1%
101.5%
101.4%
100.8%
99.6%
3Q10
4Q10
1Q11
2Q11
3Q11 |
 Borrowing Mix & Cost
20
$ in millions
Avg Bal QTR
INT % QTR
Borrowings
Short-Term Borrowings
590
0.38%
604
0.38%
748
0.33%
668
0.31%
632
0.32%
.
FHLB Advances
1117
3.99%
1105
3.19%
1100
3.09%
1116
2.91%
1,115
2.90%
Long Term Debt
719
5.09%
712
5.09%
701
5.24%
691
5.03%
679
4.78%
Total Borrowings
2,426
3.44%
2,421
3.05%
2,549
2.87%
2,475
2.80%
2,426
2.75%
Off Balance Sheet Swap Impact
525
0.17%
525
0.57%
525
0.54%
625
0.68%
675
0.76%
Total Borrowings Cost
2,426
3.61%
2,421
3.62%
2,549
3.41%
2,475
3.48%
2,426
3.51%
Avg Borrowings/Avg Total Assets
17.4%
17.3%
18.3%
17.6%
17.1%
3Q10
4Q10
1Q11
2Q11
3Q11 |
 Strategic Objectives for 2011-2012
Continuing strong progress in improving credit quality
Completing acquisition and integration of Tower Bancorp
Growing loans, deposits and revenue
Increasing profitability and shareholder dividends
21 |
 Appendix |
 Strategic Acquisition of
Abington Bancorp |
 Transaction Highlights
Strong Strategic
Rationale
Attractive Financial
Returns
Low Risk
Low-risk fill-in acquisition of an in-market community bank in
Montgomery and Bucks counties
—
Adds 20 branches and $900mm of deposits; no branch overlap
Strengthens presence in attractive Montgomery and Delaware counties and provides
entry into Bucks County
—
Top 10 market share in Montgomery County –
20
th
wealthiest in U.S.
—
3 counties rank among top 5 highest HHI in PA
Tremendous opportunity for deposit, loan and fee income growth
—
Wealth management and insurance subsidiaries (Valley Forge, Stratton, and
Addis) located in Montgomery County with strong customer contacts
—
Expand Susquehanna’s in-market mortgage origination capability
—
Potential for commercial loan growth
20% IRR
100bps accretive to Tier I common at close
Breakeven to 2012 EPS, without considering benefits of excess capital
Comprehensive due diligence process
In-market transaction with similar demographics
Proven track record of integrating acquisitions
A -
1 |
 Pro
Forma Financial Impact Pro Forma Financial Impact
Attractive financial returns:
20% IRR
60 bps accretive to TCE and 100bps to Tier I common
Breakeven accretion to SUSQ normalized EPS without considering any benefit from
excess capital; 3% accretive to SUSQ current 2012 median analyst
estimate¹ Tangible book value dilution less than 2%
Strong pro forma capital position (approximately $95mm capital accretive):
Assumptions:
8.5% cumulative lifetime credit losses through the cycle (since 2008)
Cost savings of $8.1mm or 31%², phased in 50% in 2011 and 100% in 2012
One time pre-tax restructuring charge of $21mm
A -
2
12/31/2010
Actual (%)
Pro forma (%)
TCE/TA
7.6%
8.2%
Tier I common
9.6%
10.6%
Tier I
12.7%
13.5%
Note: Based on SUSQ and ABBC stock prices at announcement
¹
Susquehanna normalized analyst estimate of $0.80 and 2012 analyst estimate of
$0.66 ²
Excluding stock based compensation expenses, core cost synergies are approximately
24% of non interest expenses |
 Pricing Metrics
Based on Jan. 26, 2011
(Announcement date)
1 day
Deal price per share ($)
$12.80
Implied premium (%)
10.3%
Price / 4Q net income (adjusted for excess capital)¹
24.1x
Price / Tangible book value
1.2x
Price / Adjusted tangible book value²
1.3x
Core deposit premium³
8.2%
Memo:
Susquehanna price per share ($)
$9.70
Financial information as of December 31, 2010
¹4Q 2010 net income annualized; price and earnings adjusted for excess capital of $95mm; assumes
1% pre-tax earnings on excess capital ²Adjusted for credit marks of $31mm and loan loss
reserve of $4mm ³ Core deposits of $680 excludes time deposits >$100mm
A -
3 |
 Strategic Acquisition of Tower
Bancorp |
 Transaction highlights
Strong Strategic
Rationale
Superior Financial
Returns
Low Risk
Acquisition of an in-market, growth oriented community bank with favorable
demographics in central and southeastern Pennsylvania with $2.2bn of
deposits Strengthens presence in attractive Chester County while
building scale in Lancaster and
Harrisburg
—
Top 3 market share in Chester County –
wealthiest in PA
Tremendous opportunity for deposit, loan and fee income growth
—
Attractive wealth management division, headquartered in Chester County with
$560mm AUM
—
Small business lending expertise
—
Complementary loan and deposit mix
Seasoned management team with a record of achieving growth
Deploys excess capital generated from Abington acquisition
Approximately 25% IRR
10% accretive to 2013 EPS
Tangible book value earn-back of ~5 years
Comprehensive due diligence process
In-market transaction
Proven track record of integrating acquisitions
Strong pro forma capital and balance sheet
A -
4 |
 Consideration:
Fixed exchange ratio of 3.4696x (resulting in approximately 30.8 million
shares issued based on assumed Tower outstanding shares)
Fixed cash amount of $88mm
75% stock and 25% cash¹
Implied transaction value:¹
$345mm
Implied price per share:¹
$28.69 / Premium to closing price: 41%
Board composition:
Tower receives 3 seats on the pro forma 20 member Board of Directors
(including Abington transaction), and including 1 seat on the Executive
Committee
Due diligence:
Completed
Management
Andrew Samuel (Tower CEO) will become President and Chief Revenue
Officer of Susquehanna and will be appointed to the Susquehanna Board;
Jeffrey Renninger (Tower President & COO) and Janak Amin (CEO of
Graystone Tower Bank) to assume senior management positions at
Susquehanna Bank
Required approval:
Regulatory approval required
Shareholder approval required for SUSQ and TOBC
Termination fee:
$13.5mm (reflects 4% of transaction)
Anticipated closing:
1Q 2012
Transaction overview
Transaction overview
1
Based on Susquehanna stock price as of June 20, 2011; based on diluted shares of
12.0mm A -
5 |
 Financial impact –
cost saves
Financial impact –
cost saves
($mm)
Cost savings of approximately 34% of Tower’s non-interest
expense¹ Driven by consolidation of branch network of Susquehanna and
Tower; approximately 25 branch closings anticipated between Susquehanna and
Tower History of deposit retention in prior acquisitions
Proven track record of delivery on cost savings
Compensation and benefits
$20.1
Occupancy
3.8
Systems and technology
2.2
Professional fees
0.9
Marketing & other
3.1
Total cost saves (pre-tax)
$30.0
One-time restructuring charge (pre-tax)
$63.0
A -
6
¹
Based on Tower’s core Q1 2011 non-interest expense annualized
|
 Pricing metrics
A -
7
Tower acquisition
Precedent transactions2
Deal price per share ($)
$28.69
Implied premium
41%
24% - 57%
Price to 2012 EPS (IBES)
15.1x
Price to 2013 EPS (IBES)
12.8x
Price to tangible book value
1.5x
1.6x - 1.9x
Core deposit premium¹
6%
9% - 14%
Memo:
Susquehanna price per share
$8.34
Note: Financial information as of March 31, 2011; based on market data as of June 20, 2011
1
Core deposits of $1.9bn excludes time deposits of greater than $100k
2
Precedent transactions include First Niagara/NewAlliance, People's United/Danvers, Brookline/Bank of
Rhode Island and Valley/State |
 3/31/2011
Pro forma
Current (%)
Pro forma ABBC (%)²
TOBC & ABBC (%)²
TCE / TA¹
7.7%
8.4%
7.8%
Tier I common
9.7%
10.5%
9.7%
Tier I capital
12.8%
13.5%
12.3%
Pro-forma financial impact
Pro-forma financial impact
Superior financial returns:
IRR of approximately 25%
Immediately accretive to EPS; 10% accretive to 2013 EPS
Tangible book value earn-back in ~5 years
Strong pro-forma capital position:
Assumptions:
Cost savings of $30mm, phased in 75% in 2012 and 100% in 2013; no revenue
synergies assumed One time pre-tax costs of $63mm
Core deposit intangibles of $22mm, amortized over 10 years
A -
8
¹
Includes deferred tax liabilities associated with intangibles
²
Pro forma adjustments assuming SUSQ share price as of June 20, 2011
|
 Summary
A -
9
Expands Susquehanna’s footprint into highly attractive markets and
increases scale in existing markets
Superior financial returns; significant synergy potential
Considerable opportunity for small business lending and fee income
generation by delivering on Susquehanna’s full-service platform
Gain experienced, growth oriented management team with extensive
in-market knowledge |
 Additional information about the
merger and where to find it
Additional information about the
merger and where to find it
In connection with the proposed merger, Susquehanna has filed a registration
statement on Form S-4 with the SEC on October 3, 2011, which contains a
joint proxy statement/prospectus of Susquehanna and Tower. The companies
will file with the SEC other relevant materials in connection with the merger and have mailed
the joint proxy statement/prospectus to their respective shareholders.
Investors and security holders of Susquehanna and Tower are urged to read the
proxy statement/prospectus and the other relevant materials because they
contain important information about Tower, Susquehanna and the merger. The
joint proxy statement/prospectus and other relevant materials and any other documents filed by
Susquehanna or Tower with the SEC, may be obtained free of charge at the SEC’s
Web site at http://www.sec.gov.
In addition, investors and security holders may obtain free copies of the documents
filed with the SEC by Tower by contacting Brent Smith, Tower Bancorp, Inc.,
telephone: 717-724-4666 or from Tower’s Web site at
www.towerbancorp.com. Investors and security holders may obtain free copies of the
documents filed with the SEC by Susquehanna by contacting Abram G. Koser, Susquehanna
Bancshares, Inc., 26 North Cedar Street, Lititz, PA 17543, telephone:
717-626-4721 or from Susquehanna’s web site at
www.susquehanna.net.
Susquehanna, Tower and their respective directors, executive officers and certain
other members of management and employees may be deemed
“participants” in the solicitation of proxies from shareholders of
Susquehanna and Tower in favor of the merger.
Information regarding the persons who may, under the rules of
the SEC, be considered participants in the solicitation of the shareholders of
Susquehanna and Tower in connection with the proposed merger will be set forth
in the joint proxy statement/prospectus when it is filed with the SEC. You can
find information about the executive officers and directors of Susquehanna in its Annual
Report on Form 10-K for the year ended December 31, 2010 and in its definitive
proxy statement filed with the SEC on March 18, 2011. You can find information
about Tower’s executive officers and directors in its Annual Report on
Form 10-K for the year ended December 31, 2010 and in its definitive proxy statement filed with the
SEC on April 8, 2011. |