Attached files
| file | filename |
|---|---|
| 8-K - FORM 8-K - NATIONAL FINANCIAL PARTNERS CORP | d248386d8k.htm |
 THIRD
QUARTER 2011 EARNINGS CALL PRESENTATION OCTOBER 28, 2011
Exhibit 99.1 |
 2
Related to Forward-Looking Statements
Certain
items
in
this
presentation
and
in
today’s
discussion,
including
matters
relating
to
revenue,
net
income,
Adjusted
EBITDA,
cash
earnings,
cash
earnings
per
diluted
share
and
percentages
or
calculations
using
these
measures,
acquisitions,
capital
structure
or
growth
rates
and
other
financial
measurements
and
non-financial
statements
in
future
periods,
constitute
forward-looking
statements
as
that
term
is
defined
in
the
Private
Securities
Litigation
Reform
Act
of
1995.
These
forward-looking
statements
are
based
on
management's
current
views
with
respect
to
future
results
and
are
subject
to
risks
and
uncertainties.
These
statements
are
not
guarantees
of
future
performance.
Actual
results
may
differ
materially
from
those
contemplated
by
forward-looking
statements.
National
Financial
Partners
Corp.
(“NFP”
or
the
“Company”)
refers
you
to
its
filings
with
the
SEC,
including
its
Annual
Report
on
Form
10-K
for
the
year
ended
December
31,
2010,
filed
on
February
10,
2011,
for
additional
discussion
of
these
risks
and
uncertainties
as
well
as
a
cautionary
statement
regarding
forward-looking
statements.
Forward-looking
statements
made
during
this
presentation
speak
only
as
of
today's
date.
NFP
expressly
disclaims
any
obligation
to
update
or
revise
any
forward-looking
statements,
whether
as
a
result
of
new
information,
future
events or otherwise. |
 3
Related to Non-GAAP Financial Information
The
Company
analyzes
its
performance
using
historical
and
forward-looking
non-GAAP
financial
measures
called
cash
earnings,
cash
earnings
per
diluted
share,
Adjusted
EBITDA,
adjusted
income
before
management
fees,
management
fees
(excluding
the
accelerated
vesting
of
certain
RSUs),
and
percentages
or
calculations
using
these
measures.
The
Company
believes
these
non-
GAAP
financial
measures
provide
additional
meaningful
methods
of
evaluating
certain
aspects
of
the
Company’s
operating
performance
from
period
to
period
on
a
basis
that
may
not
be
otherwise
apparent
under
GAAP.
Cash
earnings
is
defined
as
net
income
excluding
amortization
of
intangibles,
depreciation,
the
after-tax
impact
of
the
impairment
of
goodwill
and
intangible
assets,
the
after-tax
impact
of
non-cash
interest
expense
and
the
after-tax
impact
of
certain
non-recurring
items.
Cash
earnings
per
diluted
share
is
calculated
by
dividing
cash
earnings
by
the
number
of
weighted
average
diluted
shares
outstanding
for
the
period
indicated.
Cash
earnings
and
cash
earnings
per
diluted
share
should
not
be
viewed
as
substitutes
for
net
income
and
net
income
per
diluted
share,
respectively.
Adjusted
EBITDA
is
defined
as
net
income
excluding
income
tax
expense,
interest
income,
interest
expense,
gain
on
early
extinguishment
of
debt,
other,
net,
amortization
of
intangibles,
depreciation,
impairment
of
goodwill
and
intangible
assets,
(gain)
loss
on
sale
of
businesses,
the
pre-tax
impact
of
the
accelerated
vesting
of
certain
RSUs
and
any
change
in
estimated
contingent
consideration
amounts
recorded
in
accordance
with
purchase
accounting
that
have
been
subsequently
adjusted
and
recorded
in
the
consolidated
statement
of
operations.
Adjusted
EBITDA
should
not
be
viewed
as
a
substitute
for
net
income.
Adjusted
income
before
management
fees
is
defined
as
income
before
management
fees
excluding
corporate
income.
Adjusted
income
before
management
fees
should
not
be
viewed
as
a
substitute
for
income
from
operations.
Management
fees
(excluding
accelerated
vesting
of
certain
RSUs)
shows
management
fees
without
the
one-time
impact
of
the
accelerated
vesting
of
certain
RSUs
on
September
17,
2010.
Management
fees
(excluding
the
accelerated
vesting
of
certain
RSUs)
should
not
be
viewed
as
a
substitute
for
management
fees.
A
reconciliation
of
these
non-GAAP
financial
measures
to
their
GAAP
counterparts
for
the
periods
presented
herein
is
provided
in
the
Company’s
quarterly
financial
supplement
for
the
period
ended
September
30,
2011, which is available on the Investor Relations section of the Company’s
Web site at www.nfp.com. |
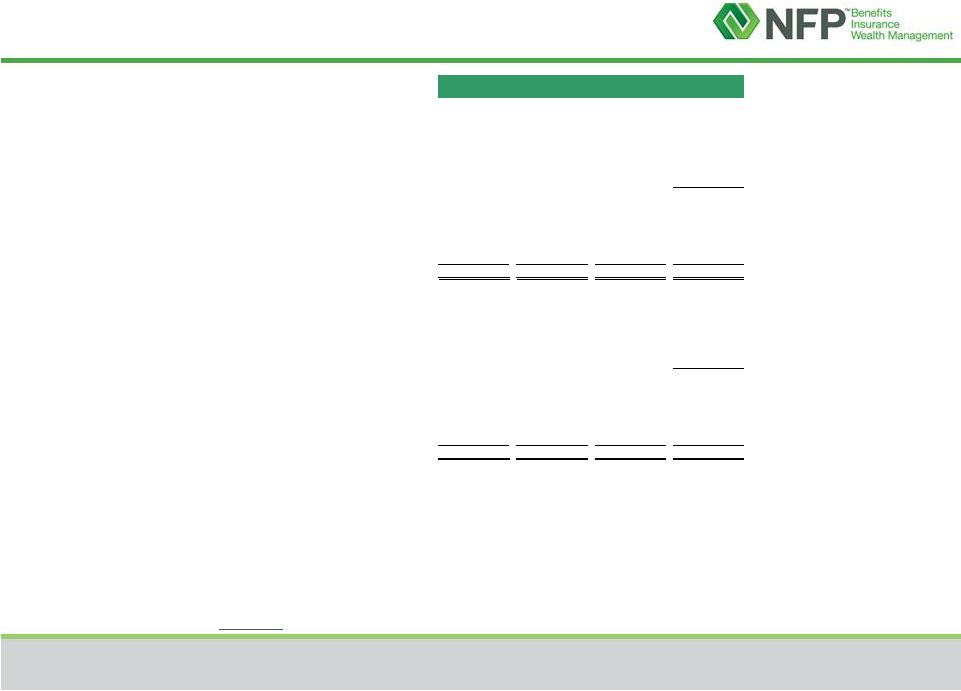
 4
Reconciliation: Net Income to Cash Earnings
($ in thousands, except per share data)
Q3 2011
Q3 2010
YTD 2011
YTD 2010
GAAP net income
$ 9,321
$ 8,230
$ 25,687
$ 27,289
Amortization of intangibles
8,348
8,258
24,207
24,802
Depreciation
3,126
3,017
9,240
9,028
Impairment of goodwill and intangible assets
2,466
-
3,386
2,901
Tax benefit of impairment of goodwill and intangible assets
(975)
(102)
(1,339)
(1,132)
Non-cash interest, net of tax
664
588
1,932
4,292
Accelerated vesting of certain RSUs, net of tax
-
8,174
-
8,174
Gain on early extinguishment of debt, net of tax
-
(5,914)
-
(5,914)
Change in estimated acquisition earn-out, net of tax
32
-
32
-
Cash earnings (1)
$ 22,982
$ 22,251
$ 63,145
$ 69,440
GAAP net income per share -
diluted
$ 0.21
$ 0.19
$ 0.58
$ 0.62
Amortization of intangibles
0.19
0.19
0.55
0.57
Depreciation
0.07
0.07
0.21
0.21
Impairment of goodwill and intangible assets
0.06
-
0.08
0.07
Tax benefit of impairment of goodwill and intangible assets
(0.02)
-
(0.03)
(0.03)
Non-cash interest, net of tax
0.02
0.01
0.04
0.10
Accelerated vesting of certain RSUs, net of tax
-
0.18
-
0.19
Gain on early extinguishment of debt, net of tax
-
(0.13)
-
(0.13)
Change in estimated acquisition earn-out, net of tax
-
-
-
-
Cash earnings per share -
diluted (2)
$ 0.53
$ 0.50
$ 1.42
$ 1.58
Cash earnings is a non-GAAP financial measure, which the Company defines as net income excluding
amortization of intangibles, depreciation, the after-tax impact of the impairment of
goodwill and intangible assets, the after-tax impact of non-cash interest expense and the
after-tax impact of certain non-recurring items. The sum of the per-share components of cash earnings per share - diluted may not agree to cash
earnings per share - diluted due to rounding.
(1)
(2) |
 5
Reconciliation: Net Income to
Adjusted EBITDA
Corporate
Individual
Advisor
(in thousands)
Client Group
Client Group
Services Group
Consolidated
For the nine months ended September 30, 2011
GAAP net income
25,687
$
Income tax expense
20,328
Interest income
(2,600)
Interest expense
11,751
Gain on early extinguishment of debt
-
Other, net
(5,818)
Income from operations
34,388
$
7,850
$
7,110
$
49,348
$
Amortization of intangibles
15,901
8,306
-
24,207
Depreciation
4,602
3,209
1,429
9,240
Impairment of goodwill and intangible assets
-
3,386
-
3,386
(Gain) loss on sale of businesses, net
(47)
100
-
53
Accelerated vesting of certain RSUs
-
-
-
-
Change in estimated acquisition
earn-out payables 53
-
-
53
Adjusted EBITDA
(1)
54,897
$
22,851
$
8,539
$
86,287
$
For the nine months ended September 30, 2010
GAAP net income
27,289
$
Income tax expense
16,739
Interest income
(2,645)
Interest expense
14,449
Gain on early extinguishment of debt
(9,711)
Other, net
(5,516)
Income from operations
30,035
$
6,013
$
4,557
$
40,605
$
Amortization of intangibles
16,003
8,799
-
24,802
Depreciation
4,674
3,345
1,009
9,028
Impairment of goodwill and intangible assets
1,931
970
-
2,901
(Gain) loss on sale of businesses, net
(8,287)
(1,734)
-
(10,021)
Accelerated vesting of certain RSUs
7,394
6,001
-
13,395
Change in estimated acquisition earn-out payables
-
-
-
-
Adjusted EBITDA
(1)
51,750
$
23,394
$
5,566
$
80,710
$
(1)
Adjusted EBITDA is a non-GAAP financial measure, which the Company defines as net income
excluding income tax expense, interest income, interest expense, gain on early extinguishment
of debt, other, net, amortization of intangibles, depreciation, impairment of goodwill and intangible assets, (gain) loss on sale of businesses, the pre-tax
impact of the accelerated vesting of certain RSUs and any change in estimated contingent
consideration amounts recorded in accordance with purchase accounting that have been
subsequently adjusted and recorded in the consolidated statement of operations.
The reconciliation of Adjusted EBITDA per reportable segment does not include the following items,
which are not allocated to any of the Company’s reportable segments: income tax expense,
interest income, interest expense, gain on early extinguishment of debt and other, net. These items are included in the reconciliation of Adjusted
EBITDA to net income on a consolidated basis.
For a reconciliation of Adjusted EBITDA per reportable segment for the three months ended September
30, 2010, December 31, 2010, June 30, 2011 and September 30, 2011, please see the
Company’s quarterly financial supplement for the period ended September 30, 2011 which is available on the Investor Relations section of the
Company’s Web site at www.nfp.com.
|
 JESSICA BIBLIOWICZ
Chairman, President & Chief Executive Officer |
 7
3Q11 Highlights
Organic revenue growth +3.3%
Positive contributions from
–
Corporate Client Group +5.3%
–
Advisor Services Group +19.7%
Adjusted EBITDA grew 20%; margin expansion
Strategy to continue to further diversify product & service offerings
throughout NFP Continue to build pipeline for acquisitions and
sub-acquisitions Executing on balanced capital allocation strategy
Strategic acquisitions and sub-acquisitions
–
Approximately $49 million cash consideration YTD
$50 million stock repurchase plan
–
$28.6 million repurchased as of September 30, 2011
–
$21.4 million remaining authorization, as of September 30, 2011
Reinvestment in existing businesses
Patrick S. Baird, former CEO of AEGON USA, joins NFP’s Board of
Directors |
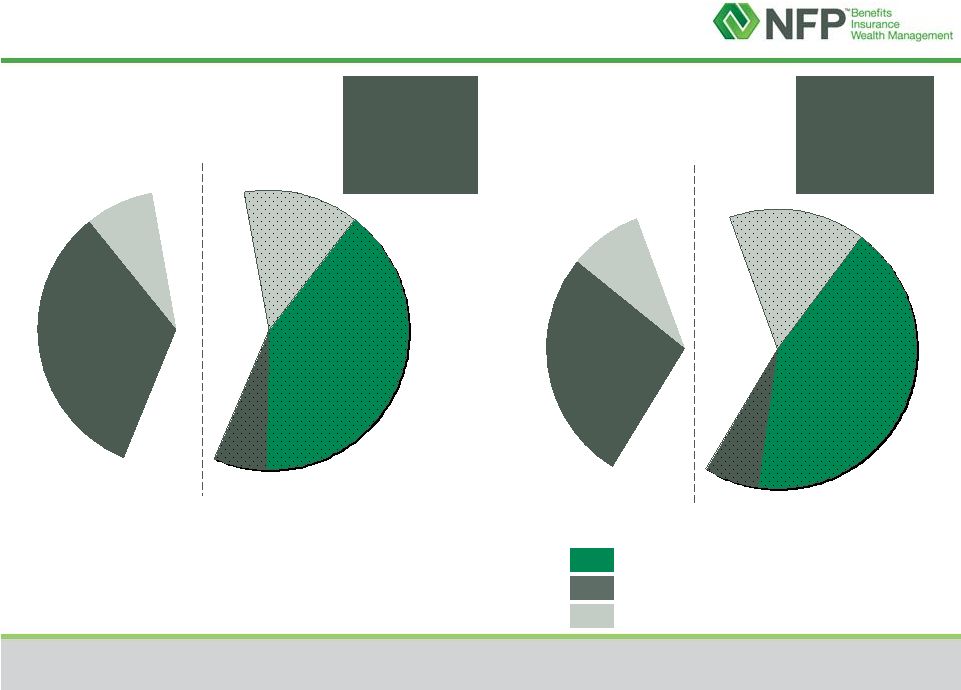
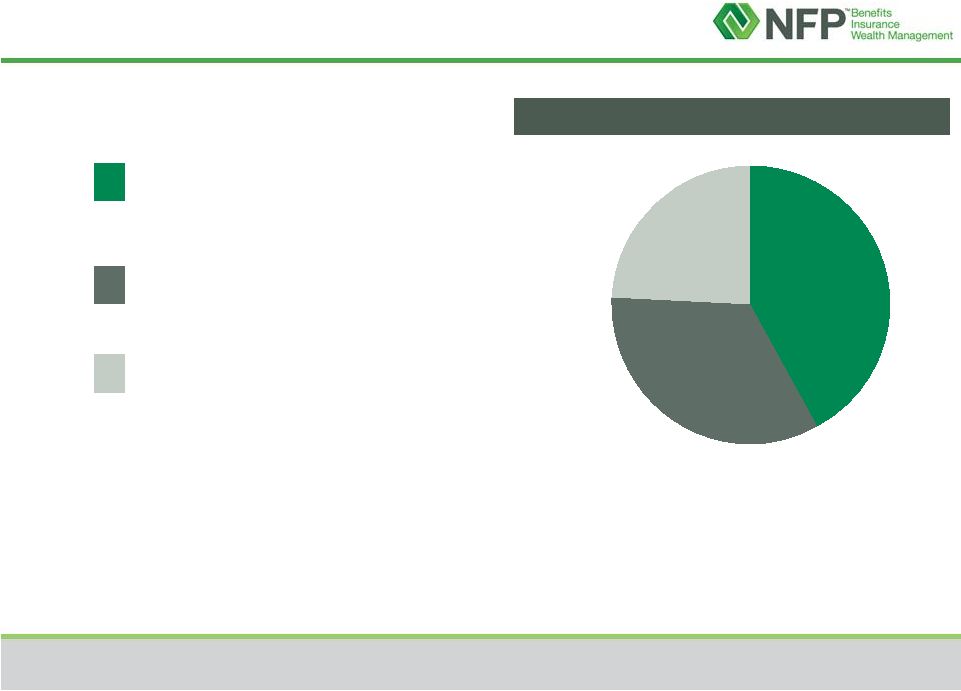 8
Business Segments
Advisor Services Group
Organic revenue growth +19.7%
Individual Client Group
Organic revenue decline -7.8%
Corporate Client Group
Organic revenue growth +5.3%
3Q11 Revenue $251.5 million
$84.8
33.7%
$105.7
42.0%
$61.0
24.3% |
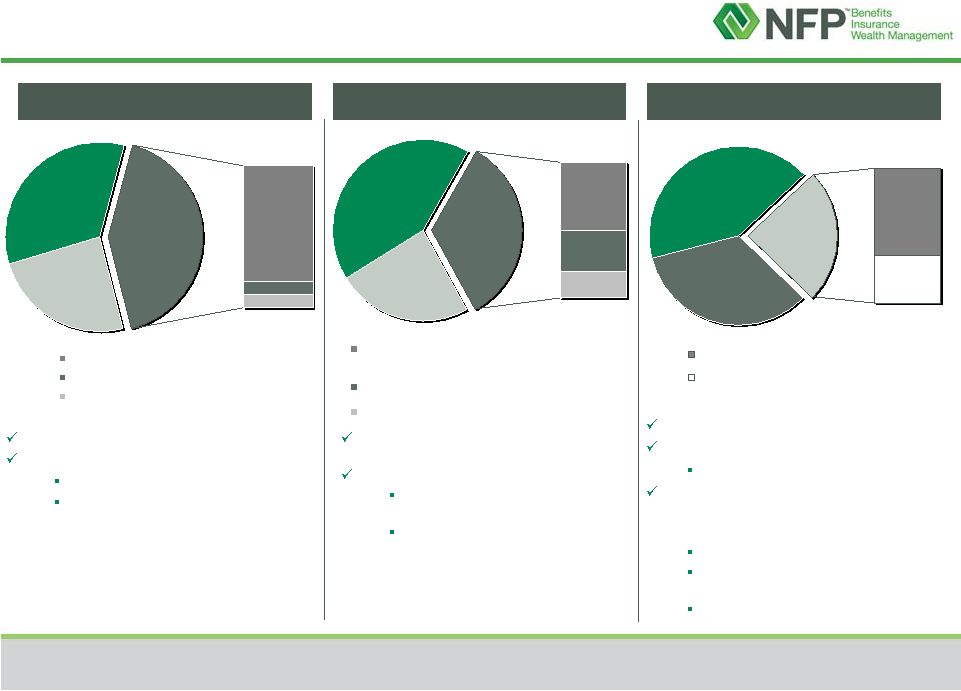 9
Corporate Benefits
Executive Benefits
Property & Casualty
Business Segment
3Q11 Overview & Components of Revenue
Solid performance
FY 2011 expectations for CCG
3% -
4% organic growth
Adjusted EBITDA margins
generally consistent with first nine
months of 2011
Corporate Client Group
Individual Client Group
Advisor Services Group
Strong performance in wealth
management
FY 2011 expectations for life insurance
Volatility and uncertainty remains
in the market
Weakness in 4Q11 compared to
4Q10
33.7%
Retail Life
Marketing Organization & Wholesale Life
Brokerage
Wealth Management
24.3%
Asset Based Fees & Trails
Commissions & Non-Recurring Fees
Continued strong growth
AUM $9.0 billion, up 1.3% YOY
Strong variable annuity sales
FY 2011 expectations for ASG
(depending on performance of financial
markets)
12% –
14% organic growth
Investments in recruiting and
marketing
Adjusted EBITDA margin about 4.5%
% of ICG
Revenue
% of ASG
Revenue
% of CCG
Revenue
64.9%
35.1%
18.8%
30.6%
50.6%
81.8%
8.8%
* See appendix for historical data for components of CCG revenue
*
42.0%
9.4% |
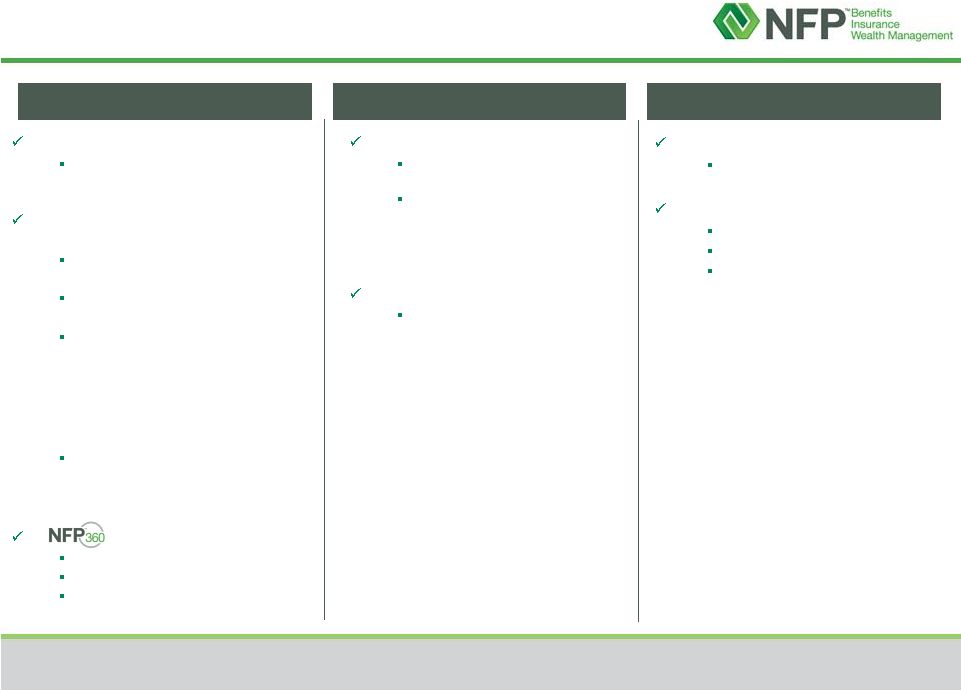
 10
$19.3
$39.6
15.7%
$16.0
6.4%
$105.7
42.0%
Recurring Revenue
by Business Segment
3Q11 Revenue $251.5 million
3Q11
Recurring
revenue
64.1%
3Q10
Recurring
revenue
59.1%
1
Recurring revenue refers to revenue that is generally recurring in nature and
includes revenue from corporate and executive benefits, investment advisory and asset-based fees
and trails.
3Q10 Revenue $237.5 million
Individual Client Group
Corporate Client Group
Advisor Services Group
($ in millions)
8.1%
$77.9
32.8%
$31.7
13.4%
$94.6
39.8%
$14.0
5.9%
$21.4
8.6%
$68.8
27.3%
1 |
 DOUG HAMMOND
Chief Operating Officer |
 12
Steady and recurring business
Navigating challenging economic and
regulatory environment
Diversification of products and
services
Health & Welfare
–
Health care reform
Retirement
–
Positive market trends
NFP Executive Benefits
–
Represents combined
operations of most of our
leading executive benefits
subsidiaries
–
Strong, consolidated message
to the marketplace
P&C
–
Smooth integration
–
Solid pipeline
Integrated CRM solution
Improved analytics
Business collaboration
Life insurance
Challenges and uncertainty
remain in the market
4Q11 financial performance
expected to be weaker than
4Q10
Wealth management
Strong performance continues
AUM $9.0 billion, up 1.3% YOY
Strong variable annuity sales
Growth drivers
New assets
Advisor recruitment
Asset-based fees (due to broader
financial market performance)
Business Segment Performance
Corporate Client Group
Individual Client Group
Advisor Services Group |
 DONNA BLANK
Chief Financial Officer |
 14
3Q11 Consolidated Financial Highlights
$17.2
$20.2
$8.3
$9.3
$1.2
$2.7
3Q10
3Q11
$26.8
$32.2
Individual Client Group
Corporate Client Group
Advisor Services Group
$51.0
$61.0
$94.6
$105.7
$91.9
$84.8
3Q10
3Q11
$237.5
$251.5
($ in millions)
Adjusted EBITDA Margin
3Q10
3Q11
Corporate Client Group
18.2%
19.1%
Individual Client Group
9.1%
10.9%
Advisor Services Group
2.5%
4.5%
Consolidated
11.3%
12.8%
59.1%
64.1%
Recurring
Revenue
1
1
The sum of the components may not agree to total due to rounding.
Revenue growth +6%, Adjusted EBITDA growth +20% and margin expansion
Adjusted EBITDA & Margin
Revenue |
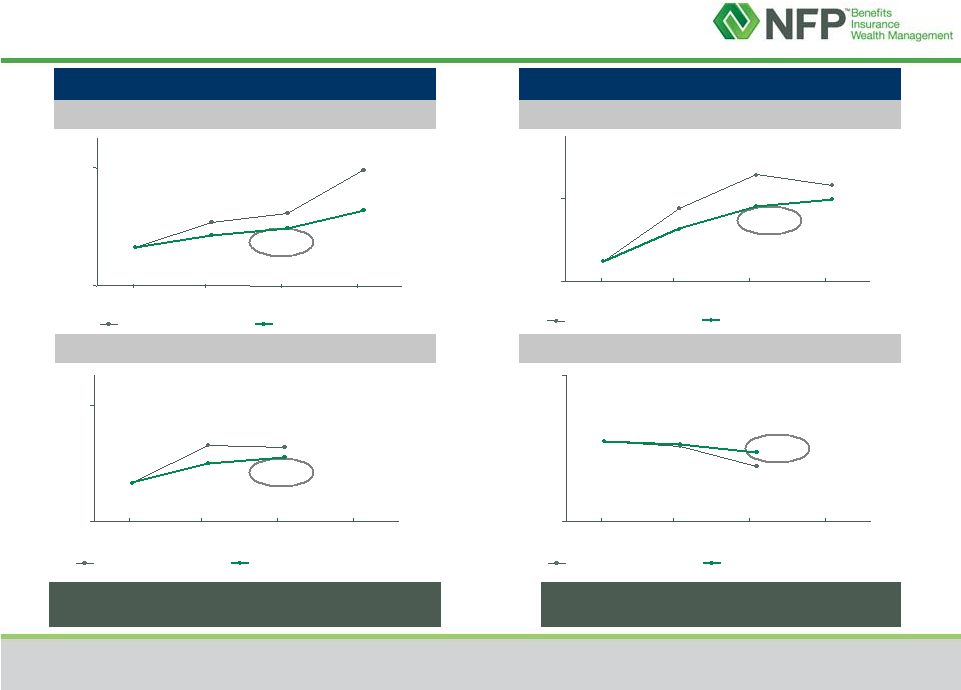 15
Management Fees
(excl. accelerated vesting of RSUs in 2010)
as % of Adjusted Income Before Management Fees
Corporate Client Group
Individual Client Group
NFP’s priority interest in CCG was 61.7%
as of 9/30/11
NFP’s priority interest in ICG was 46.8%
as of 9/30/11
2010
2010
2011
2011
50.0%
38.8%
43.2%
36.8%
41.2%
42.7%
40.2%
30%
50%
1Q
2Q
3Q
4Q
2010 QTD Mgmt Fees
2010 YTD Mgmt Fees
44.9%
57.6%
52.7%
65.7%
63.2%
58.0%
59.8%
40%
60%
1Q
2Q
3Q
4Q
2010 QTD Mgmt Fees
2010 YTD Mgmt Fees
52.1%
50.6%
52.7%
52.9%
53.2%
45%
60%
1Q
2Q
3Q
4Q
2011 QTD Mgmt Fees
2011 YTD Mgmt Fees
36.6%
42.8%
43.1%
40.9%
39.9%
30%
50%
1Q
2Q
3Q
4Q
2011 QTD Mgmt Fees
2011 YTD Mgmt Fees |
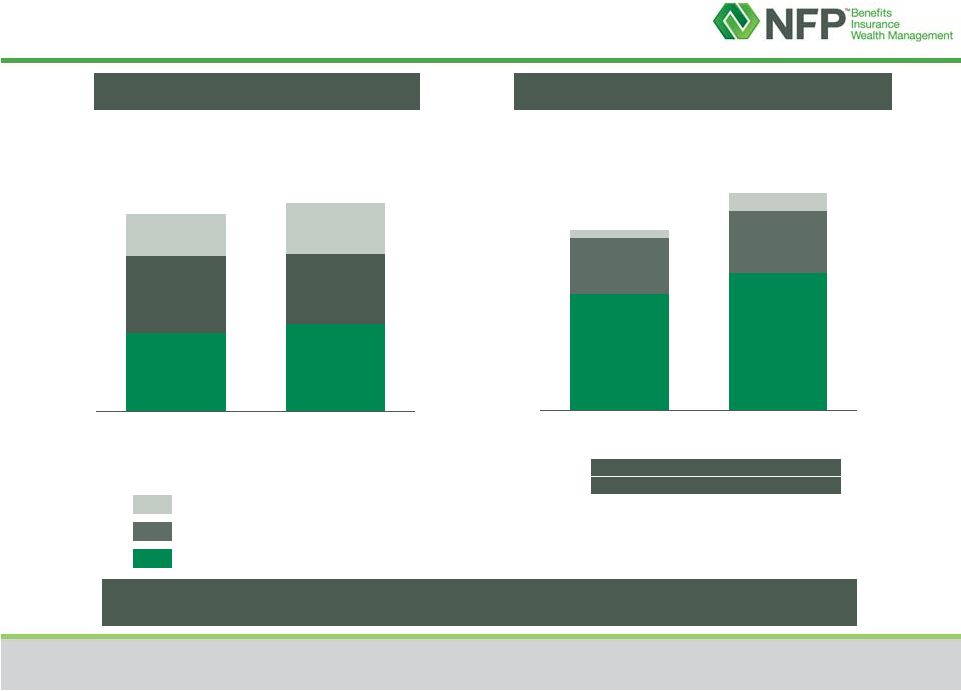
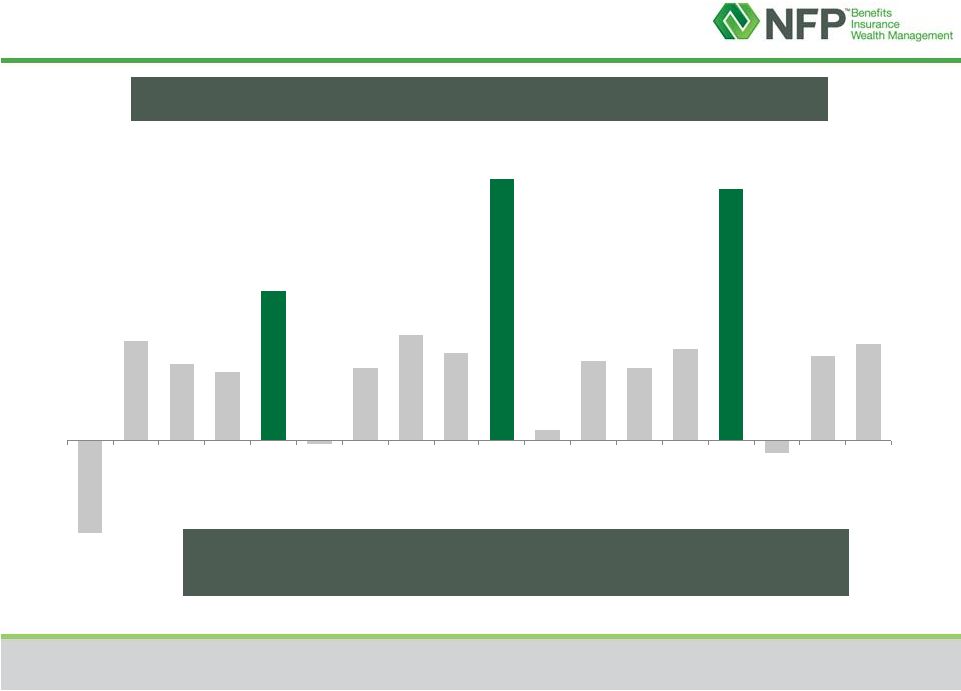 Operating Cash Flow
-$44
$47
$36
$32
$71
-$2
$34
$50
$41
$124
$5
$37
$34
$43
$119
-$6
$40
$46
Q1'08
Q2'08
Q3'08
Q4'08
FY'08
Q1'09
Q2'09
Q3'09
Q4'09
FY'09
Q1'10
Q2'10
Q3'10
Q4'10
FY'10
Q1'11
Q2'11
Q3'11
In Q1, larger payments to Principals typically occur as management
fee bonuses for prior year performance are paid
(1)
Q1 2008 and 12/31/08 YTD acquisitions include $14.4 mm paid in connection with an
acquisition which was treated as prepaid management fees. (2)
Sum of the quarters may not agree to the full year total due to rounding.
Quarterly/Annual Operating Cash Flow
($ in millions)
(1)
(2)
(1)
16 |
 17
Balanced approach to capital allocation; maintain financial flexibility
Strategic acquisitions and sub-acquisitions
–
Approximately $49 million cash consideration YTD
Direct capital return to shareholders –
stock buyback
Reinvestment in existing businesses
$50 million NFP stock buyback authorization
Balanced Capital Allocation Strategy
1
Repurchase authorization announced May 2, 2011.
3Q11
Total Program as of
September 30, 2011
# of shares repurchased
1,690,700
2,421,700
Weighted average share price
$11.69
$11.79
Total $ amount repurchased (in millions)
$19.8
$28.6
$ amount remaining outstanding as of September 30, 2011
(in millions)
$21.4 |
 Appendix |
 19
Components
of
CCG
Revenue
¹
Updated to reflect current CCG business lines
1
The sum of the components may not agree to total due to rounding.
2010
2011
1Q10
2Q10
3Q10
4Q10
FY10
Corporate Benefits
82.9%
84.8%
84.6%
81.2%
83.3%
Executive Benefits
11.2%
9.6%
10.6%
14.9%
11.7%
Property & Casualty
6.3%
5.8%
4.9%
4.1%
5.2%
1Q11
2Q11
3Q11
Corporate Benefits
83.0%
83.6%
81.8%
Executive Benefits
10.9%
10.4%
9.4%
Property & Casualty
6.1%
6.0%
8.8% |