Attached files
| file | filename |
|---|---|
| 8-K - FORM 8-K - Energy Future Holdings Corp /TX/ | d248904d8k.htm |
| EX-99.1 - PRESS RELEASE - Energy Future Holdings Corp /TX/ | d248904dex991.htm |
 EFH Corp.
Q3 2011 Investor Call
October 28, 2011
Exhibit 99.2 |
 1
Safe Harbor Statement
Forward Looking Statements
This
presentation
contains
forward-looking
statements,
which
are
subject
to
various
risks
and
uncertainties.
Discussion
of
risks
and
uncertainties
that
could
cause
actual
results
to
differ
materially
from
management's
current
projections,
forecasts,
estimates
and
expectations
is
contained
in
EFH
Corp.'s
filings
with
the
Securities
and
Exchange
Commission
(SEC).
In
addition
to
the
risks
and
uncertainties
set
forth
in
EFH
Corp.'s
SEC
filings,
the
forward-looking
statements
in
this
presentation
regarding
the
company’s
long-term
hedging
program
could
be
affected
by,
among
other
things:
any
change
in
the
ERCOT
electricity
market,
including
a
regulatory
or
legislative
change,
that
results
in
wholesale
electricity
prices
not
being
largely
correlated
to
natural
gas
prices;
any
decrease
in
market
heat
rates
as
the
long-term
hedging
program
generally
does
not
mitigate
exposure
to
changes
in
market
heat
rates;
the
unwillingness
or
failure
of
any
hedge
counterparty
or
the
lenders
under
the
commodity
collateral
posting
facility
to
perform
their
respective
obligations;
or
any
other
event
that
results
in
the
inability
to
continue
to
use
a
first
lien
on
TCEH’s
assets
to
secure
a
substantial
portion
of
the hedges under the long-term hedging program.
Regulation G
This
presentation
includes
certain
non-GAAP
financial
measures.
A
reconciliation
of
these
measures
to
the
most
directly
comparable
GAAP
measures
is
included
in
the
appendix to this presentation. |
 2
Today’s Agenda
Q&A
Financial and Operational
Overview
Q3 2011 Review
Paul Keglevic
Executive Vice President & CFO |
 Consolidated: reconciliation of GAAP net income (loss) to adjusted (non-GAAP)
operating results Q3
1
10 vs. Q3 11; $ millions, after tax
EFH Corp.
Adjusted (Non-GAAP) Operating Results -
QTR
1
Three months ended September 30.
2
Items are noncash except for severance related to EPA’s Cross State Air
Pollution Rule (CSAPR). 3
Charges include, net of tax, $269 million of emissions allowances impairments, $32
million of severance accruals, and $6 million of mining asset impairments all recorded in other
deductions and $14 million of incremental depreciation expense.
Factor
Q3 10
Q3 11
Change
EFH Corp. GAAP net loss
(2,902)
(710)
2,192
Items
excluded
from
adjusted
(non-GAAP)
operating
results
(after
tax)
2
Unrealized commodity-related mark-to-market net gains
(494)
(89)
405
Unrealized mark-to-market net losses on interest rate swaps
118
402
284
Charges
related
to
EPA
Cross
State
Air
Pollution
Rule
3
-
321
321
Debt extinguishment gains –
2010 debt exchanges and repurchases
(659)
-
659
Goodwill impairment
4,100
-
(4,100)
Reduction of income tax expense due to resolution of IRS tax audit for 1997-2002
(146)
-
146
EFH Corp. adjusted (non-GAAP) operating income (loss)
17
(76)
(93)
3 |
 Consolidated key drivers of the change in (non-GAAP) operating results
Q3 10 vs. Q3 11; $ millions, after tax
EFH Corp.
Adjusted (Non-GAAP) Operating Results Key Drivers -
QTR
1
Competitive business consists of Competitive Electric segment and Corp. &
Other. Description/Drivers
Better
(Worse) Than
Q3 10
Competitive business
1
:
Lower retail volumes and commodity hedging offset by favorable weather-driven
consumption and asset management (21)
Lower production from nuclear generation units due to unplanned outages
(12)
Higher fuel costs at legacy generation units reflecting increased costs of purchased
coal and related transportation (7)
Impact of new lignite-fueled generation units
22
Other
(6)
Contribution margin
(24)
Higher net interest expense driven by higher average rates
(44)
Higher SG&A reflecting employee related expenses and information
technology costs
(13)
Higher operating costs reflecting nuclear plant planned maintenance and spending
related to CSAPR (6)
Higher depreciation reflecting ongoing investment in the legacy generation
fleet (3)
Lower retail bad debt expense reflecting improved collections and customer mix
8
All other -
net
(6)
Total change -
Competitive business
(88)
Regulated business:
Higher revenues from increased consumption primarily due to warmer weather
28
Higher net revenues driven by transmission rate and distribution
tariff increases, AMS surcharge and growth in points of delivery
15
Change in income taxes driven by 2010 reduction in interest accrued on uncertain tax
positions (16)
Higher depreciation reflecting infrastructure investment
(9)
Higher operations and maintenance expense due to employee related costs,
transportation and materials costs, vegetation management and advanced
metering expenses (9)
Higher transmission fees
(7)
Higher net interest expense
(3)
All other -
net
(4)
Total change –
Regulated business (~80% owned by EFH Corp.)
(5)
Total change in EFH Corp. adjusted (non-GAAP) operating results
(93)
4 |
 Consolidated: reconciliation of GAAP net income (loss) to adjusted (non-GAAP)
operating results YTD
1
10
vs. YTD 11; $ millions, after tax
EFH Corp.
Adjusted (Non-GAAP) Operating Results -
YTD
1
Nine months ended September 30.
2
Items are noncash except for severance related to CSAPR, fees associated with April
2011 TCEH debt amendment and extension transactions, gain related to counterparty bankruptcy
settlement and 2011 income tax charge.
3
Charges include, net of tax, $269 million of emissions allowances impairments, $32
million of severance accruals, and $6 million of mining asset impairments all recorded in other
deductions and $14 million of incremental depreciation expense.
4
YTD 2010 charges recorded as a result of health care legislation in 2010; YTD 2011
state income tax charges recorded as a result of April 2011 TCEH debt amendment and extension
transactions.
Factor
YTD 10
YTD 11
Change
EFH Corp. GAAP net loss
(2,973)
(1,776)
1,197
Items
excluded
from
adjusted
(non-GAAP)
operating
results
(after
tax)
2
Unrealized mark-to-market net losses on interest rate swaps
352
572
220
Unrealized commodity-related mark-to-market net (gains) losses
(1,040)
159
1,199
Charges
related
to
EPA
Cross
State
Air
Pollution
Rule
3
-
321
321
Third-party fees associated with April 2011 TCEH debt amendment and extension
transactions -
64
64
Debt extinguishment gains
(751)
(16)
735
Gain related to counterparty bankruptcy settlement
-
(14)
(14)
Goodwill impairment
4,100
-
(4,100)
Reduction of income tax expense due to resolution of IRS tax audit for
1997-2002 (146)
-
146
Income
tax
charges
4
8
13
5
EFH Corp. adjusted (non-GAAP) operating loss
(450)
(677)
(227)
5 |
 Consolidated key drivers of the change in (non-GAAP) operating results
YTD 10 vs. YTD 11; $ millions, after tax
EFH Corp.
Adjusted (Non-GAAP) Operating Results Key Drivers -
YTD
1
Competitive business consists of Competitive Electric segment and Corp. &
Other. Description/Drivers
Better (Worse)
Than
YTD 10
Competitive business
1
:
Lower retail volumes and commodity hedging offset by favorable weather-driven
consumption and asset management (117)
Higher fuel costs at legacy generation units reflecting increased costs of purchased
coal and related transportation (23)
Impact of winter weather event
(17)
Lower production from nuclear generation units primarily due to unplanned
outages (10)
Lower production from legacy coal-fueled generation units (excludes Sandow 4
generation) (8)
Impact of new lignite-fueled generation units
58
Lower amortization of intangibles arising from purchase accounting
10
All other -
net
(7)
Contribution margin
(114)
Gains in 2010 on sales of assets (reported in other income)
(52)
Higher depreciation reflecting the new lignite-fueled generation units and
ongoing investment in the legacy generation fleet (35)
Higher operating costs reflecting nuclear plant planned maintenance and the impact of
new lignite-fueled generation units (30)
Higher net interest expense driven by higher rates, higher amortization of debt costs
and lower capitalized interest (29)
Higher SG&A reflecting employee related expenses and information
technology costs
(15)
Lower retail bad debt expense reflecting improved collections and customer mix
30
Lower accrued interest on uncertain tax positions
15
All other -
net
8
Total change -
Competitive business
(222)
Regulated business:
Higher net revenues reflecting transmission rate and distribution tariff increases,
AMS surcharge and growth in points of delivery 46
Higher revenues from increased consumption primarily due to warmer weather
33
Higher depreciation reflecting infrastructure investment
(21)
Change in income taxes driven by 2010 reduction in interest accrued on uncertain tax
positions (20)
Higher transmission fees
(16)
Higher operations and maintenance expense due to employee related costs,
transportation and materials costs, and advanced metering and vegetation
management expenses
(11)
Higher net interest expense driven by average rates
(6)
All other –
net
(10)
Change in Regulated business (~80% owned by EFH Corp.)
(5)
Total change in EFH Corp. adjusted (non-GAAP) operating results
(227)
6 |
 EFH
Corp. Adjusted EBITDA (Non-GAAP) EFH
Corp.
Adjusted
EBITDA
(non-GAAP)
1
Q3
10 vs. Q3 11 and YTD 10 vs. YTD 11;
$ millions
Q3 11
Q3 10
1,599
1,592
1,076
1,109
517
476
TCEH
Oncor
Q3 and YTD performance was largely driven by the same key drivers impacting adjusted
(non-GAAP) operating results.
3%
9%
1
See Appendix for Regulation G reconciliations and definition. Includes $7
million, $6 million, $23 million and $22 million in Q3 10, Q3 11, YTD 10 and
YTD 11, respectively, of Corp. & Other Adjusted EBITDA.
YTD 11
YTD 10
4,031
4,157
2,739
2,940
1,270
1,194
3%
7%
6%
7 |
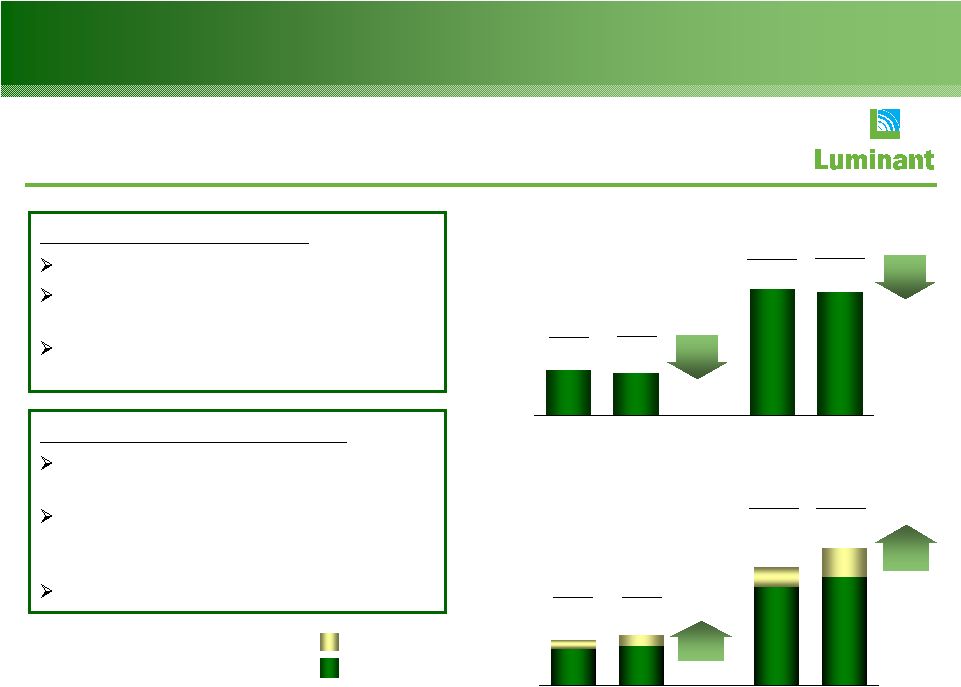 Luminant Operational Results
Coal-fueled generation; GWh
Sandow 5 & Oak Grove
Legacy coal-fueled plants
Q3 2011 Nuclear Plant Results
Solid safety performance
Lower generation due to unplanned
outages
Top decile industry performance for
reliability and cost
Q3 2011 Coal-Fueled Plant Results
New plants operated at ~95% capacity
factor for 0.9 TWh higher generation
Higher legacy coal-fueled generation due
to improved reliability and fewer
unplanned outages
Top quartile industry performance
1
Variance does not include generation from Sandow 5 and Oak Grove
1 & 2.
Q3 11
Q3 10
5,302
14,841
YTD 10
YTD 11
14,546
4,956
7%
QTR
3,691
YTD 11
Q3 10
15,445
16,473
12,100
40,743
45,096
Q3 11
YTD 10
2%
1
YTD
32,996
32,249
11,917
11,754
2%
YTD
Nuclear-fueled generation; GWh
8
1%
1
QTR
4,556
8,494 |
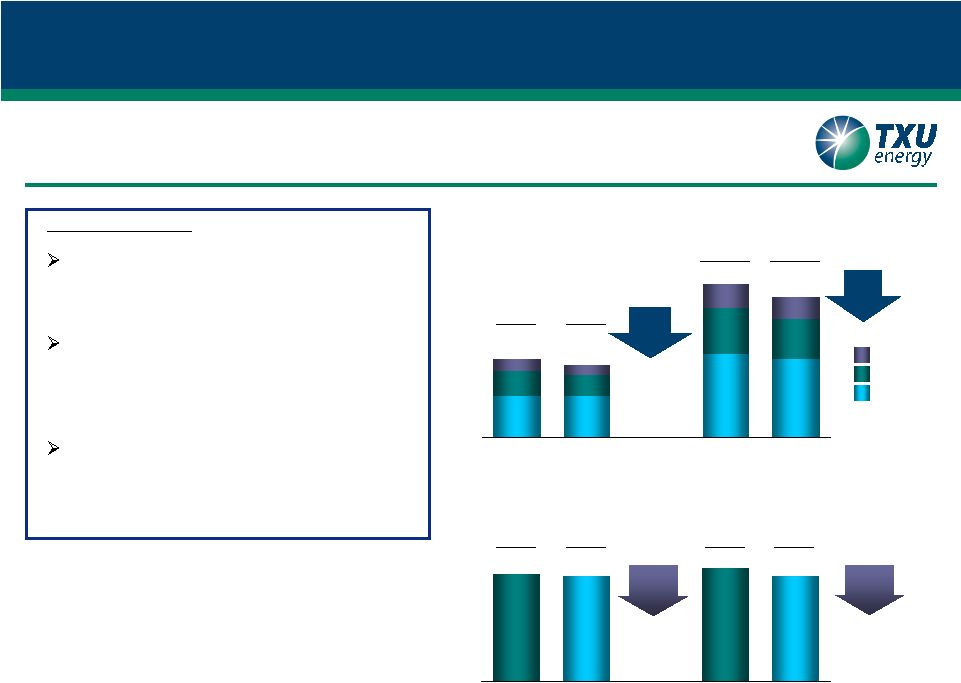  Q3 2011
Results Lower LCI volumes reflect
competitive intensity and TXU Energy
focus on margin discipline
Higher residential sales volumes
driven by warmer weather in Q3 11
compared to Q3 10 partially offset by
lower customer counts
Bad debt expense decreased by 44%
in Q3 11 compared to Q3 10 due to
improved collections initiatives and
customer mix
TXU Energy Operational Results
Total residential customers
End of period, thousands
Retail electricity sales volumes by customer class;
GWh
1,706
1,658
1
SMB –
small business
2
LCI -
large commercial and industrial
3
Last twelve months
YTD 10
SMB
1
LCI
2
Residential
Q3 10
16,184
41,170
Q3 10
Q2 11
8%
LTM
3
22,362
9,473
9,955
4,294
2,417
5,688
Q3 11
Q3 11
1,658
1,800
3%
QTR
23,040
11,738
6,392
9,586
3,445
2,116
38,005
15,147
Q3 11
YTD 11
8%
YTD
6%
QTR
9 |
 10
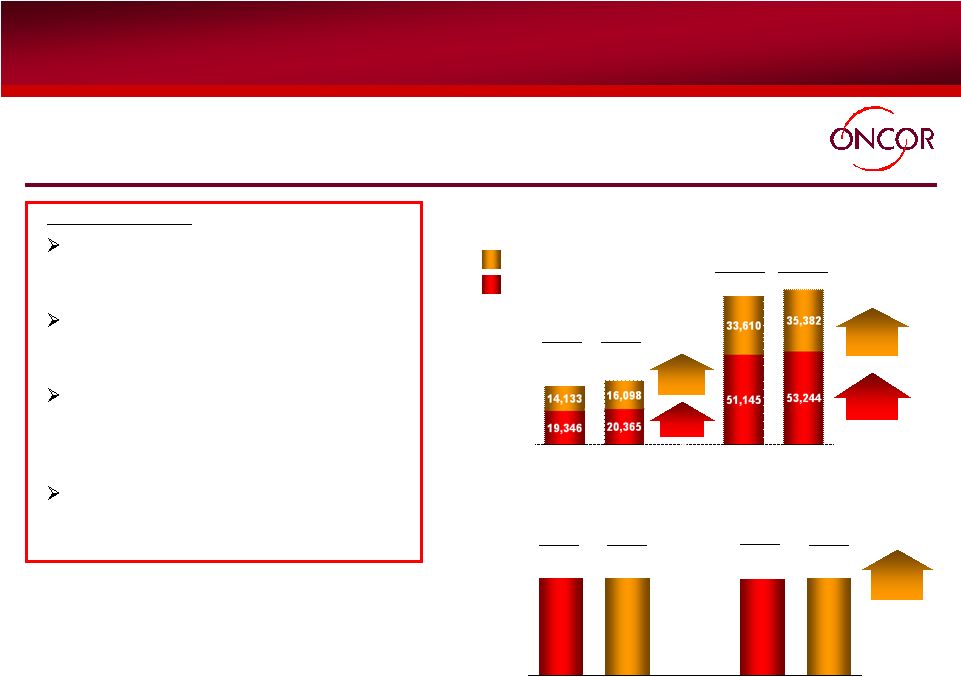
Oncor Operational Results
Electric energy billed volumes
4
; GWh
Q3 10
Q3 11
1
SMB –
small business; LCI –
large commercial and industrial
2
AMS –
Advanced Metering System
3
CREZ –
Competitive Renewable Energy Zone
4
On average, billed volumes are on an approximate 17-day calendar lag; therefore,
amounts shown reflect partial impacts from prior quarters
5
Last twelve months
Residential
SMB & LCI
1
3,167
3,196
1%
LTM
5
Electricity distribution points of delivery
End of period, thousands of meters
Q3 11
Q2 11
3,189
3,196
Q3 2011 Results
Higher volumes principally due to
warmer weather in Q3 11 compared
to Q3 10
Higher SMB & LCI
1
energy volumes
due to improved economy and
warmer weather
Execution of AMS
2
plan –
~609,000
advanced meters installed YTD 11;
over 2.1 million installed through
September 30, 2011
$689 million spent on CREZ3
through September 30, 2011; $373
million spent YTD 11
4%
YTD
5%
YTD
Q3 11
33,479
36,463
84,755
88,626
14%
QTR
Q3 10
YTD 10
YTD 11
5%
QTR |
 2,054
2,054
1,062
205
742
838
Facilities Limit
LOCs/Cash Borrowings
Availability
EFH Corp. Liquidity Management
As of September 30, 2011
11
Cash and Equivalents
TCEH Letter of Credit Facilities
TCEH Revolving Credit Facilities
742
3,116
EFH Corp. and TCEH continue to monitor capital market conditions
for opportunities to
ensure liquidity needs are met and to improve financial flexibility.
EFH Corp. (excluding Oncor) available liquidity
As of 9/30/11; $ millions
3,097 |
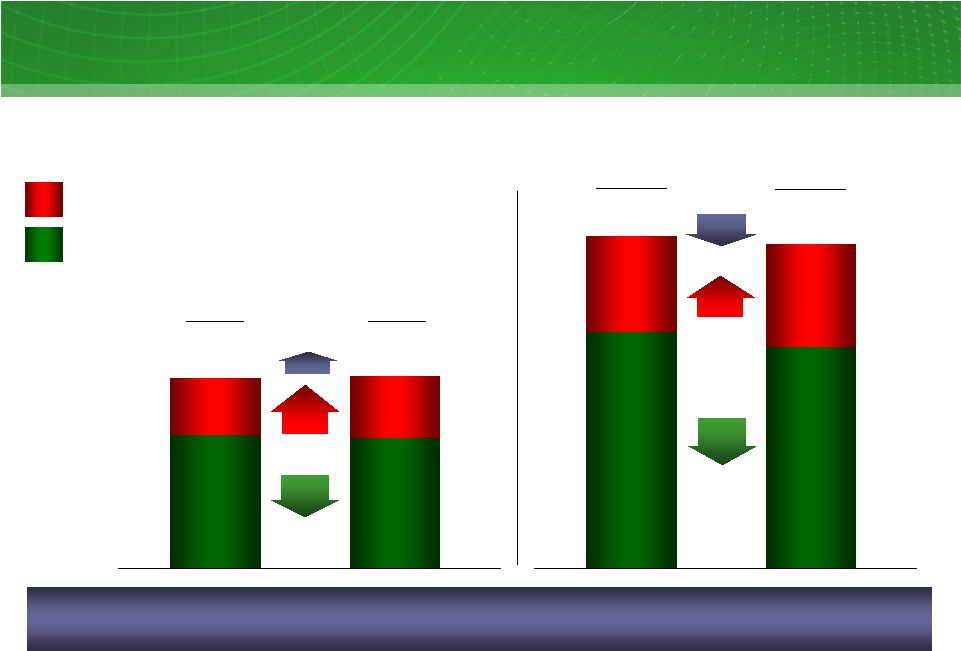
 Commodity Prices
Commodity
Units
Q3 11
Actual
Q3 10
Actual
YTD 11
Actual
BOY 11E
1
NYMEX gas price
2
$/MMBtu
$4.13
$4.29
$4.22
$3.80
HSC gas price
$/MMBtu
$4.10
$4.26
$4.17
$3.70
7x24 market heat rate (HSC)
3, 4
MMBtu/MWh
16.70
9.77
11.41
7.94
North Hub 7x24 power price
4
$/MWh
$68.63
$41.62
$47.63
$29.35
TCEH weighted avg. hedge price
5
$/MMBtu
$7.39
$7.67
$7.55
$7.60
Gulf Coast ultra-low sulfur diesel
$/gallon
$3.02
$2.08
$2.97
$2.78
PRB 8400 coal
$/ton
$11.23
$10.03
$11.01
$11.55
LIBOR interest rate
6
percent
0.47%
0.59%
0.45%
0.37%
Commodity prices
Q3 11, Q3 10, YTD 11 and BOY 11E; mixed measures
12
1
BOY 11 estimate based on commodity prices as of 09/30/11 for October 1, 2011
through December 31, 2011 2
Based on NYMEX forward curve
3
Based on ERCOT market clearing price for North Hub power for 2011 and ERCOT
market clearing price for North Zone for 2010 4
The prices in the table are actual prices. Excluding volatile power pricing where
average prices exceeded $100, related to the winter weather event in early February 2011 (
2
nd
and
3
rd
) and the record heat wave during summer 2011, North Hub 7X24 power prices averaged
approximately $35.80 and the 7X24 market heat rate averaged 8.55 MMBtu/MWh during
the first nine months of 2011.
5
Weighted average prices in the TCEH long-term natural gas hedging
program. Based on NYMEX Henry Hub prices of forward natural gas sales positions in the long-term hedging
program
(excluding the impact of offsetting purchases for rebalancing and pricing point
basis transactions). 6
The index for the settled value is a 6-month LIBOR rate.
|
 13
Factor
Measure
2011
2012
2013
2014
2015
Total or
Avg.
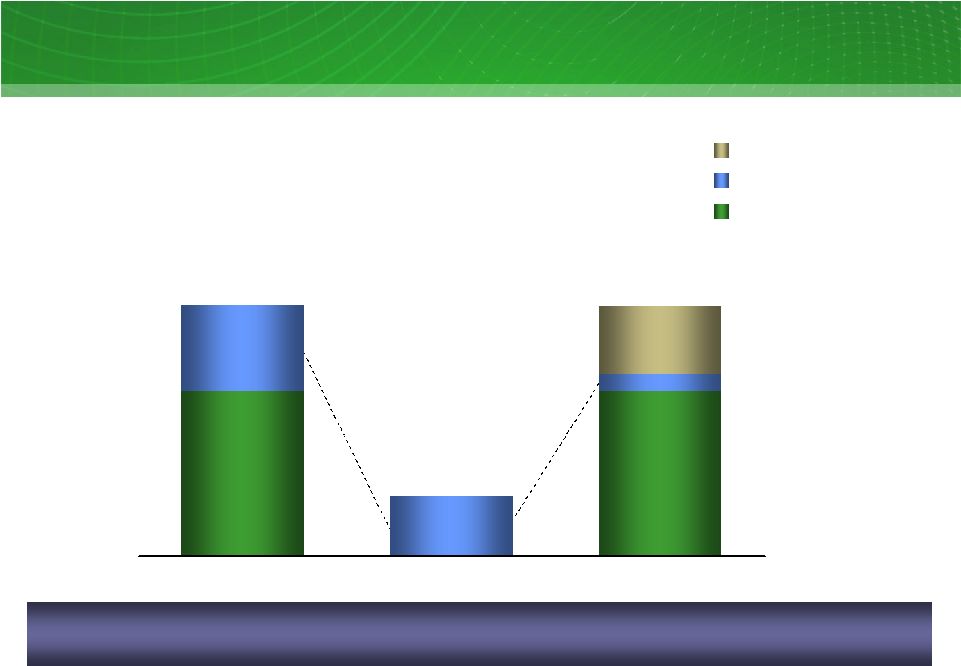
06/30/11
Natural gas hedges
mm MMBtu
~88
~383
~265
~149
~0
~885
Wtd. avg. hedge price
$/MMBtu
~$7.49
~$7.36
~$7.19
~$7.80
N/A
Natural gas prices
$/MMBtu
~$4.47
~$4.84
~$5.16
~$5.42
~$5.70
Cum. MtM gain at 06/30/11
1
$ billions
~$0.6
~$1.2
~$0.6
~$0.4
~$0
~$2.7
09/30/11
Natural gas hedges
2
mm MMBtu
~57
~331
~259
~149
~0
~796
Wtd. avg. hedge price
3
$/MMBtu
~$7.60
~$7.36
~$7.19
~$7.80
N/A
Natural gas prices
$/MMBtu
~$3.80
~$4.24
~$4.80
~$5.13
~$5.39
Cum. MtM gain at 09/30/11
1
$ billions
~$0.3
~$1.4
~$0.7
~$0.4
~$0
~$2.8
Q3 11 MtM (loss) gain
$ billions
~$(0.3)
~$0.2
~$0.1
~$0
~$0
~$0.1
13
Unrealized Mark-To-Market Impact Of Hedging
Unrealized mark-to-market impact of hedging program
09/30/11 vs. 6/30/11; mixed measures, pre-tax
The overall value of the hedge program remained relatively flat as transactions
maturing during the quarter were offset by increases in value in the forward
years of the program. 1
MtM values include the effects of all transactions in the long-term hedging
program including offsetting purchases (for re-balancing) and natural gas basis deals.
2
As
of
9/30/11,
2011
represents
October
1,
2011
through
December
31,
2011
volumes.
Where
collars
are
reflected,
the
volumes
are
estimated
based
on
the
notional
position
of
the
derivatives
to
provide
protection
against
downward
price
movements.
The
notional
volumes
for
collars
are
approximately
150
million
MMBtu,
which
corresponds
to
a
delta
position
of
approximately 120 million MMBtu in 2014.
3
Weighted
average
prices
are
based
on
NYMEX
Henry
Hub
prices
of
forward
natural
gas
sales
positions
in
the
long-term
hedging
program
(excluding
the
impact
of
offsetting
purchases
for
rebalancing
and
pricing
point
basis
transactions).
Where
collars
are
reflected,
sales
price
represents
the
collar
floor
price.
9/30/11
prices
for
2011
represent
October
1,
2011
through
December 31, 2011 values. |
 41
192
48
6
2
7
236
259
149
31
95
3
13
244
395
551
82
536
551
550
553
BAL 11
2012
2013
2014
2015
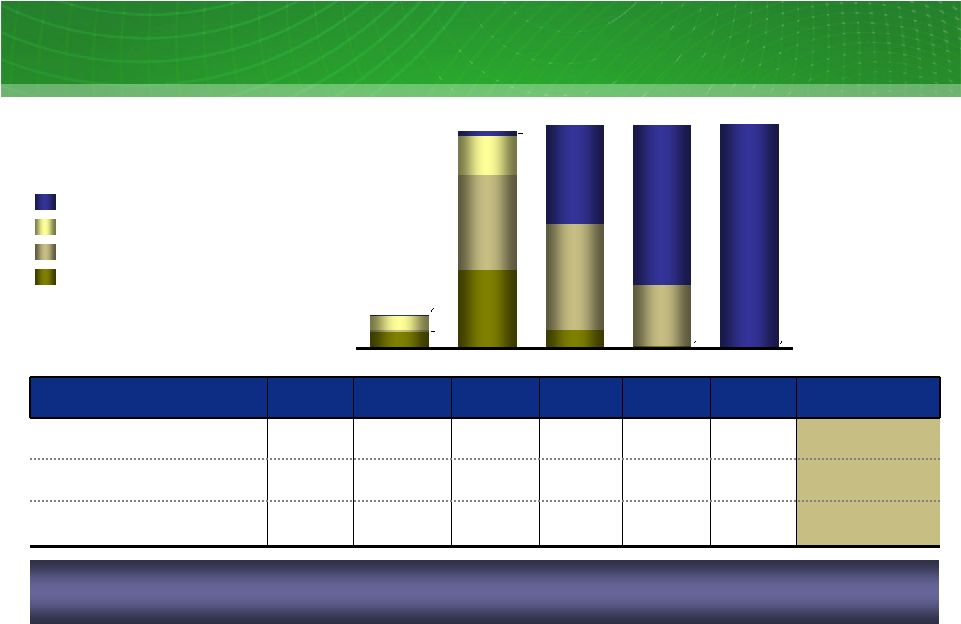
14
14
TCEH Natural Gas Exposure
TCEH Natural Gas Position
11-15
1
; million MMBtu
Hedges Backed by Asset First Lien
Open Position
Factor
Measure
BAL 11
2012
2013
2014
2015
Total or Average
Natural gas hedging program
million
MMBtu
~38
~331
~259
~149
~0
~777
TXUE and Luminant net positions
million
MMBtu
~41
~192
~48
~6
~2
~289
Overall estimated percent of
total NG position hedged
percent
~97%
~98%
~56%
~28%
~0%
~47%
TXUE and Luminant Net Positions²
TCEH has hedged approximately 47% of its estimated Henry Hub-based natural gas
price exposure from November 1, 2011 through December 31, 2015
3
.
Hedges Backed by CCP
1
As of 09/30/11. Balance of 2011 is from November 1, 2011 to December 31,
2011. Assumes conversion of electricity positions based on a ~8.0 heat rate with natural gas generally
being on the margin ~75-90% of the time (i.e. when other technologies are
forecast to be on the margin, no natural gas position is assumed to be
generated). 2012 - 2015 is inclusive
of the estimated effects of CSAPR as issued in July 2011 on generation.
2
Includes estimated retail/wholesale effects. 2011 position includes ~4 million
MMBtu of short gas positions associated with proprietary trading positions; excluding these positions, 2011
position is ~92% hedged.
3
On an average basis for such period and assuming an 8.0 market heat rate.
|
 15
15
15
EFH Corp. Adjusted EBITDA Sensitivities
Commodity
Percent Hedged at
September 30, 2011
Change
BOY 11E
Impact
$ millions
7X24 market heat rate (MMBtu/MWh)
2
~90
0.1 MMBtu/MWh
~1
NYMEX gas price ($/MMBtu)
>95
$1/MMBtu
~3
Texas gas vs. NYMEX Henry Hub price ($/MMBtu)
3,4
~90
$0.10/MMBtu
~1
Diesel ($/gallon)
5
~100
$1/gallon
~1
Base coal ($/ton)
6
~100
$2/ton
~1
Generation operations
Nuclear-
and coal / lignite-fueled generation (TWh)
N/A
1 TWh
~15
Retail operations
BOY 2011
Residential contribution margin ($/MWh)
5 TWh
$1/MWh
~5
Residential consumption
5 TWh
1%
~2
Business markets consumption
4 TWh
1%
~1
Impact on EFH Corp. Adjusted EBITDA
1
11E; mixed measures
The majority of 2011 commodity-related risks are significantly mitigated.
1
2011
estimate
based
on
commodity
positions
as
of
09/30/11,
net
of
long-term
hedges
and
wholesale/retail
effects,
excludes
gains
and
losses
incurred
prior
to
September
30,
2011.
See
Appendix for definition.
2
Simplified
representation
of
heat
rate
position
in
a
single
TWh
position.
In
reality,
heat
rate
impacts
are
differentiated
across
plants
and
respective
pricing
periods:
nuclear
and
coal-fueled
plants generation (linked primarily to changes in North Hub 7x24), natural gas
plants (primarily North Hub 5x16) and wind (primarily West Hub7x8). 3
Assumes
conversion
of
electricity
positions
based
on
a
~8.0
market
heat
rate
with
natural
gas
generally
being
on
the
margin
~75-90%
of
the
time
(i.e.,
when
coal
is
forecast
to
be
on
the
margin, no natural gas position is assumed to be generated).
4
The percentage hedged represents the amount of estimated natural
gas exposure based on Houston Ship Channel (HSC) gas price sensitivity as a proxy
for Texas gas price. 5
Includes positions related to fuel surcharge on rail transportation.
6
Excludes fuel surcharge on rail transportation. |
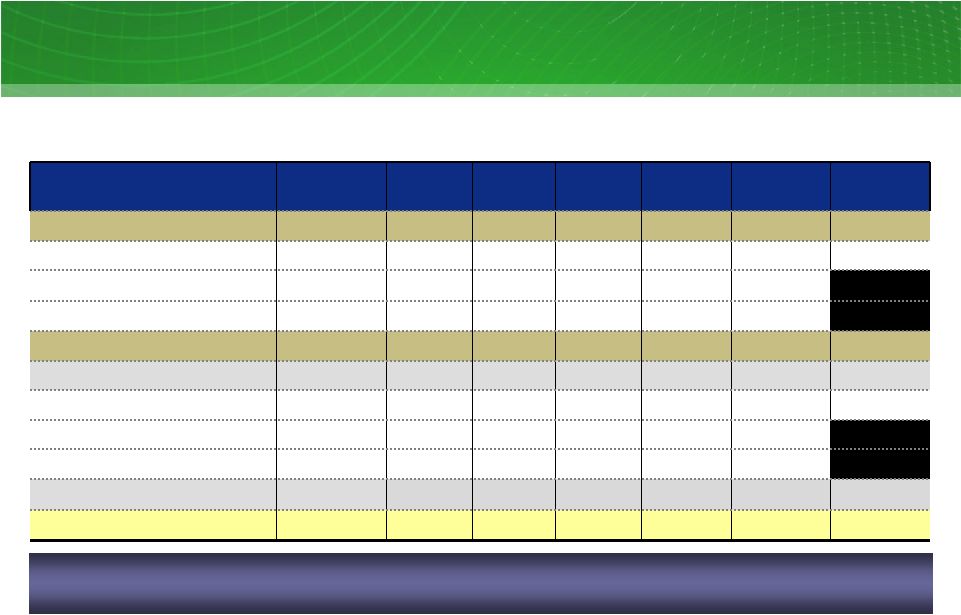
 EFH
Corp. Maturity Profile EFH Corp. debt maturities
1
(excluding Oncor), 2011-2021 and thereafter
As of 9/30/11; $ millions
16
2011
2012
2013
2014
2015
2016
2017
2018
2019
2020
2021+
427
46
100
4,261
3
11
4,510
267
3,343
1,661
15,647
3
5,000
TCEH-1
st
Lien
4
EFH Corp
EFCH
TCEH-LBO
EFIH-1
st
Lien
TCEH-Revolver
4
TCEH-Other /PCRBs
TCEH-2
nd
Lien
EFIH 2
nd
Lien
1
Includes amortization of the $15.4 billion Term Loan/DDTL facility beginning in Q4
2014 and excludes unamortized discounts and premiums. 2
Non-Extended Revolver and Extended Revolver capacities are $645 million due
October 2013 and $1,409 million due October 2016, respectively. 3
Excludes the Deposit Letter of Credit Loans maturing in 2014 and
2017.
4
2016 and 2017 maturity dates under the TCEH Senior Secured Credit Facilities are
subject to a “springing maturity” provision.
3,809
15,044
3,165
1,485
563
2,180
1,750
1,067
1,029
1,494
1,571
406
October 2011 transactions (excluded from chart below):
EFH exchange of $53 million of new EFH 11.25%/12.00%
Toggle Notes due 2017 for $65 million of EFH 5.55%
Series P Senior Notes due 2014
2
2 |
 17
Today’s Agenda
Q&A
Financial and Operational
Overview
Q3 2011 Review
John Young
President & CEO |
 18
18
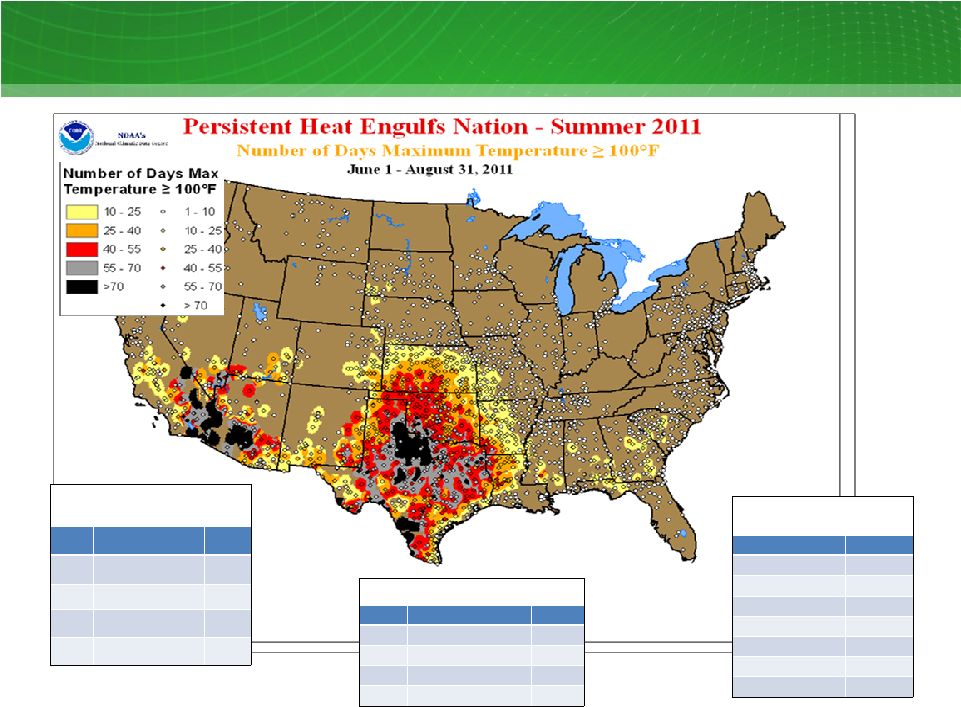
Summer Heat of 2011
DFW
Days Low >= 80
o
1
2011
55
2
1998
39
3
2008
27
4
2010
24
5
2006
23
DFW
Days>=105
o
Since 1998
2011
19
2000
10
1998
9
2006
6
1999
5
2008
5
2010
3
2003
2
DFW
Days >= 100
o
1
2011
70
2
1980
69
3
1998
56
4
1954
52
5
1956
48 |
 19
19
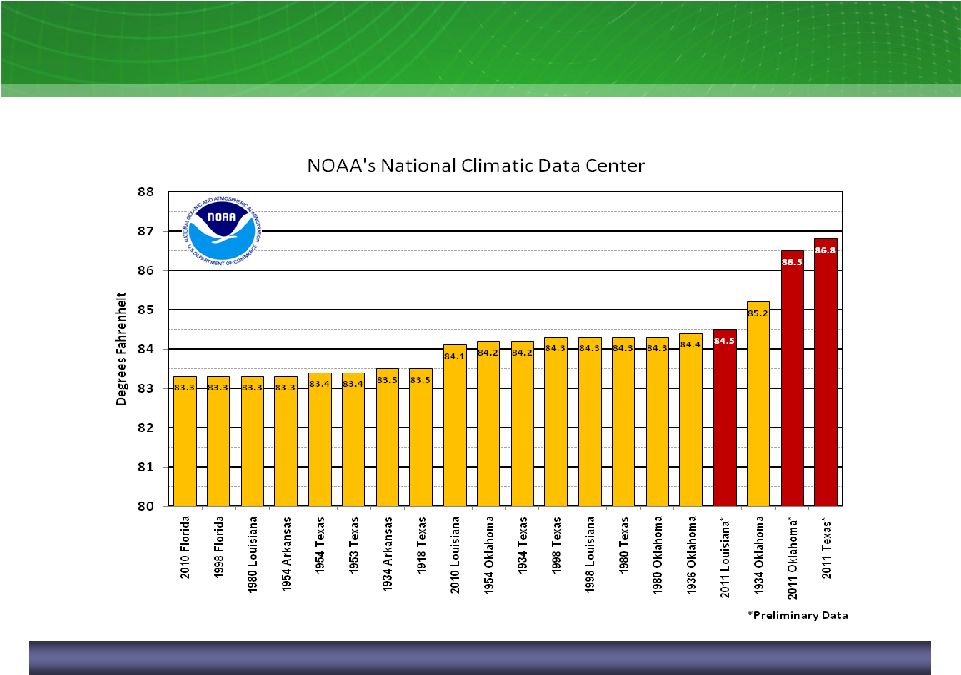
Warmest Statewide Summer Temperatures: 1895 -
2011
1
NOAA = National Oceanic and Atmospheric Administration
1
The 2011 Texas Summer was the hottest summer on record in the U.S.
|
 20
20
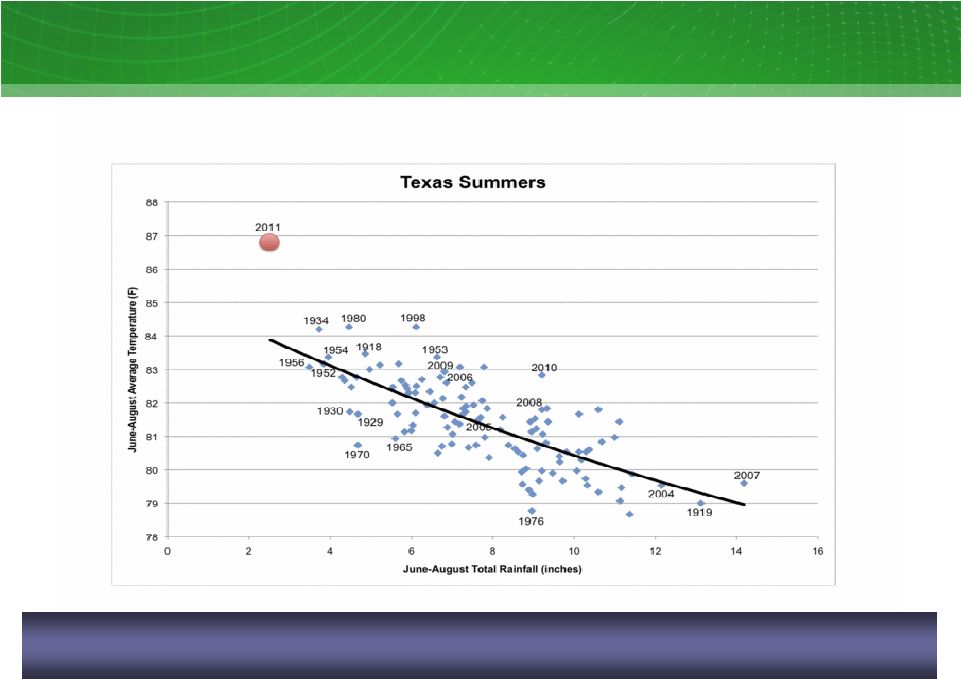
Historic Heat and Drought in 2011
As measured by both heat and by drought, Texas experienced
its worst summer on record in 2011
Source: John Nielsen-Gammon, Texas State Climatologist and Professor of
Atmospheric Sciences at Texas A&M University |
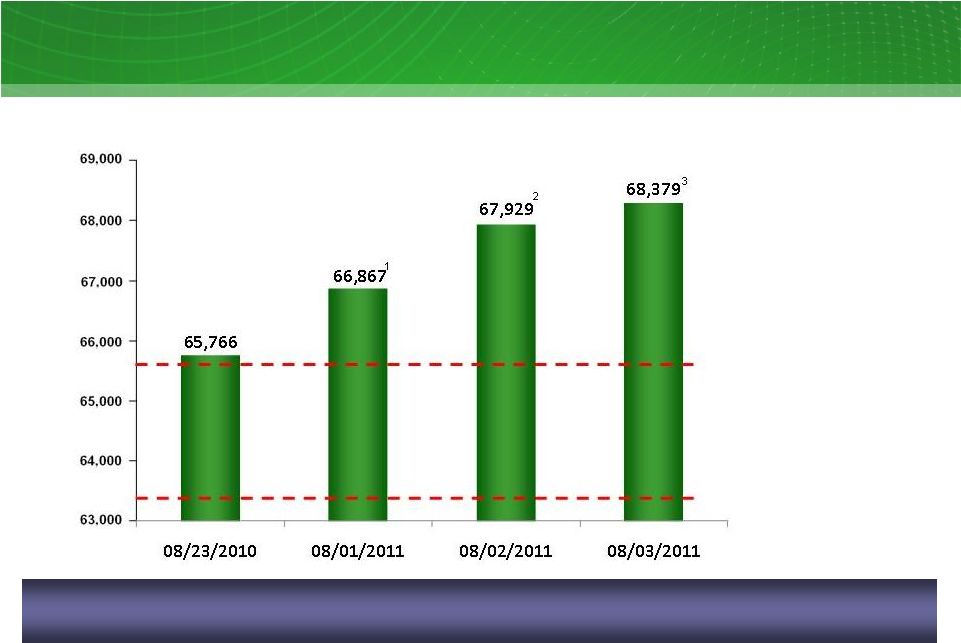 ERCOT Peak Demand Records
21
ERCOT demand records
MWs
1
Instantaneous peak demand occurred between hours 4 and 5 pm
2
Wind generation totaled ~1,500 MW or 2% during the peak hour per ERCOT; peak demand
occurred between hours 4 and 5 pm 3
Wind generation totaled ~2,000 MW or 3% during the peak hour per ERCOT; peak demand
occurred between hours 4 and 5 pm 4
Source: May 2011 Report on the Capacity, Demand, and Reserves in the ERCOT Region;
peak demand for integrated hour Record peak demand of 68,379 set on Aug 3, 2011
was 2,613 MW higher than the 2010 record peak demand set Aug 23, 2010
ERCOT 2011 Peak Demand
Estimate: 63,898
4
ERCOT 2012 Peak Demand
Estimate: 65,665
4 |
 64,418
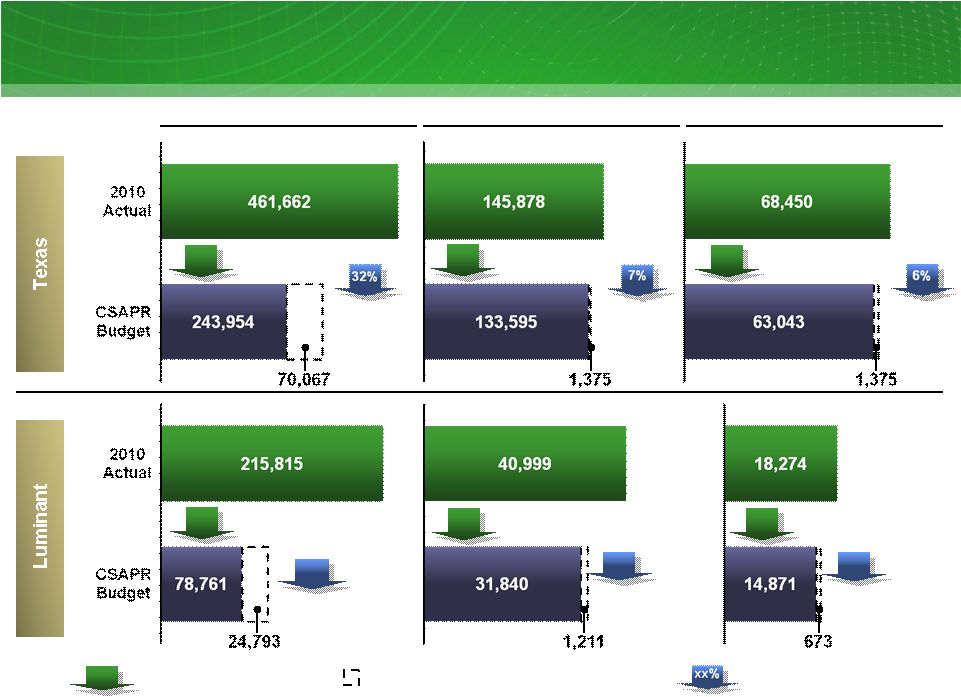
EPA Emissions Reductions Mandates
Under CSAPR
Annual SO
2
(Tons)
Annual NO
X
(Tons)
Seasonal NO
X
(Tons)
314,021
Increase Included in CSAPR Proposed Revised
% change in July 6 Final CSAPR
134,970
15,544
103,554
33,051
19%
% change in proposed revised
1
October 6, 2011 EPA proposed revisions to the CSAPR.
22
Reduction
of 9,159
Reduction
of 137,054
64%
Reduction
of 3,403
22%
19%
52%
15%
xx%
Reduction
of 112,261
Reduction
of 2,730
Reduction
of 7,948
Reduction
of 217,708
47%
Reduction
of 147,641
Reduction
of 12,283
8%
Reduction
of 10,908
Reduction
of 5,407
8%
Reduction
of 4,032 |
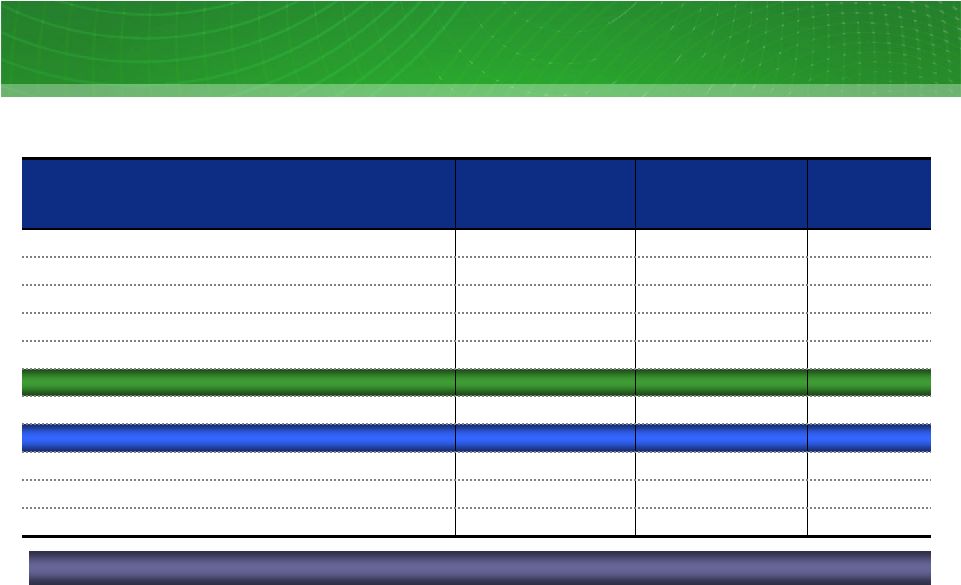
 23
Currently Installed
1
Environmental Control Equipment At
Luminant Coal Units
Coal Unit
Capacity
(MW)
FGD
(Scrubber)
2
Activated
Carbon
Injection³
ESP
4
SNCR
5
SCR
5
Bag-
house
4
Fuel Source
Oak Grove 1
800
Lignite
Oak Grove 2
800
Lignite
Sandow 4
557
Lignite
Sandow 5
580
Lignite
Martin Lake 1
750
Lignite/PRB
6
Martin Lake 2
750
Lignite/PRB
Martin Lake 3
750
Lignite/PRB
Monticello 1
565
Lignite/PRB
Monticello 2
565
Lignite/PRB
Monticello 3
750
Lignite/PRB
Big Brown 1
575
Lignite/PRB
Big Brown 2
575
Lignite/PRB
Currently installed
1
There is no assurance that the currently installed control equipment will satisfy
the requirements under any change to applicable law or any future Environmental Protection Agency or
Texas Commission on Environmental Quality regulations.
2
FGD refers to flue gas desulfurization systems that reduce SO2 emissions with
co-benefits of other emissions reductions. 3
Activated carbon injection systems reduce mercury emissions.
4
ESP refers to electro-static precipitation systems. ESP and bag-house
systems reduce particulate emissions with co-benefits of other emissions reductions.
5
SNCR refers to selective non-catalytic reduction systems. SCR refers to
selective catalytic reduction systems. Both systems reduce NOx emissions.
6
PRB refers to Powder River Basin coal transported to plants via
railcar. |
 24
Today’s Agenda
Q&A
Financial and Operational
Overview
Q3 2011 Review
EFH Corp. Senior Executive Team |
 25
Questions & Answers |
 26
Appendix –
Additional Slides and
Regulation G Reconciliations
Appendix |
 27
Financial Definitions
Measure
Definition
Adjusted (non-GAAP)
Operating Results
Net
income
(loss)
adjusted
for
items
representing
income
or
losses
that
are
not
reflective
of
underlying
operating
results.
These
items
include
unrealized
mark-to-market
gains
and
losses,
noncash
impairment
charges
and
other
charges,
credits
or
gains
that
are
unusual
or
nonrecurring.
EFH
uses
adjusted
(non-GAAP)
operating
results
as
a
measure
of
performance
and
believes
that
analysis
of
its
business
by
external
users
is
enhanced
by
visibility
to
both
net
income
(loss)
prepared
in
accordance
with
GAAP
and
adjusted
(non-GAAP)
operating
earnings
(losses).
Adjusted EBITDA
(non-GAAP)
EBITDA
adjusted
to
exclude
interest
income,
noncash
items,
unusual
items,
results
of
discontinued
operations
and
other
adjustments
allowable
under
the
EFH
senior
secured
notes
indenture.
Adjusted
EBITDA
plays
an
important
role
in
respect
of
certain
covenants
contained
in
this
indenture.
Adjusted
EBITDA
is
not
intended
to
be
an
alternative
to
GAAP
results
as
a
measure
of
operating
performance
or
an
alternative
to
cash
flows
from
operating
activities
as
a
measure
of
liquidity
or
an
alternative
to
any
other
measure
of
financial
performance
presented
in
accordance
with
GAAP,
nor
is
it
intended
to
be
used
as
a
measure
of
free
cash
flow
available
for
EFH’s
discretionary
use,
as
the
measure
excludes
certain
cash
requirements
such
as
interest
payments,
tax
payments
and
other
debt
service
requirements.
Because
not
all
companies
use
identical
calculations,
Adjusted
EBITDA
may
not
be
comparable
to
similarly
titled
measures
of
other
companies.
See
EFH’s
filings
with
the
SEC
for
a
detailed
reconciliation
of
EFH’s
net income prepared in accordance with GAAP to Adjusted EBITDA.
Competitive Business
Results
Refers to the combined results of the Competitive Electric segment and Corporate
& Other. Contribution Margin (non-
GAAP)
Operating
revenues
less
fuel,
purchased
power
costs,
and
delivery
fees,
plus
or
minus
net
gain
(loss)
from
commodity
hedging
and
trading activities, which on an adjusted (non-GAAP) basis, exclude unrealized
gains and losses. EBITDA
(non-GAAP)
Net income (loss) before interest expense and related charges, income tax expense
(benefit) and depreciation and amortization. GAAP
Generally accepted accounting principles.
Purchase Accounting
The
purchase
method
of
accounting
for
a
business
combination
as
prescribed
by
GAAP,
whereby
the
purchase
price
of
a
business
combination
is
allocated
to
identifiable
assets
and
liabilities
(including
intangible
assets)
based
upon
their
fair
values.
The
excess
of
the
purchase
price
over
the
fair
values
of
assets
and
liabilities
is
recorded
as
goodwill.
Depreciation
and
amortization
due
to
purchase
accounting
represents
the
net
increase
in
such
noncash
expenses
due
to
recording
the
fair
market
values
of
property,
plant
and
equipment,
debt
and
other
assets
and
liabilities,
including
intangible
assets
such
as
emission
allowances,
customer
relationships
and
sales
and
purchase
contracts
with
pricing
favorable
to
market
prices
at
the
date
of
the
Merger.
Amortization
is
reflected
in
revenues,
fuel,
purchased
power
costs
and
delivery
fees,
depreciation
and
amortization
and
interest
expense
in
the
income statement.
Regulated Business Results
Refers to the results of Oncor and the Oncor ring-fenced entities.
|
 Table
1: EFH Corp. Adjusted EBITDA Reconciliation Three and Nine Months Ended
September 30, 2010 and 2011 $ millions
Factor
Q3 10
Q3 11
YTD 10
YTD 11
Net loss attributable to EFH Corp.
(2,902)
(710)
(2,973)
(1,776)
Income tax (benefit) expense
370
(443)
336
(1,042)
Interest expense and related charges
1,018
1,523
3,092
3,467
Depreciation and amortization
352
379
1,043
1,119
EBITDA
(1,162)
749
1,498
1,768
Adjustments to EBITDA (pre-tax):
Oncor distributions/dividends
55
32
141
64
Interest income
-
-
(9)
(2)
Amortization of nuclear fuel
38
35
102
104
Purchase accounting adjustments
1
45
44
159
182
Impairment of assets and inventory write-down
2
1
428
3
429
Impairment of goodwill
4,100
-
4,100
-
Net gain on debt exchange offers
(1,023)
-
(1,166)
(25)
Equity in earnings of unconsolidated subsidiary
(118)
(113)
(240)
(235)
Unrealized net (gain) loss resulting from hedging transactions
(767)
(138)
(1,615)
247
Amortization of ”day one”
net loss on Sandow 5 power purchase agreement
(9)
-
(19)
-
Noncash compensation expense
3
-
5
13
8
Severance expense
-
49
3
54
Transition and business optimization costs
4
(1)
16
(2)
30
Transaction and merger expenses
5
13
9
37
27
Restructuring and other
6
(1)
-
(1)
74
Expenses incurred to upgrade or expand a generation station
7
-
-
100
100
EFH Corp. Adjusted EBITDA per Incurrence Covenant
1,171
1,116
3,104
2,825
Add back Oncor adjustments
421
483
1,053
1,206
EFH Corp. Adjusted EBITDA per Restricted Payments Covenant
1,592
1,599
4,157
4,031
1
Includes
amortization
of
the
intangible
net
asset
value
of
retail
and
wholesale
power
sales
agreements,
environmental
credits,
coal
purchase
contracts,
nuclear
fuel
contracts
and
power
purchase agreements and the stepped-up value of nuclear fuel. Also
includes certain credits and gains on asset sales not recognized in net income due to purchase accounting.
2
Impairment
of
assets
includes
impairment
of
emissions
allowances
and
certain
assets
relating
to
mining
operations
due
to
EPA
rule,
impairment
of
land
and
charges
related
to
the
cancelled
development of coal-fueled generation facilities.
3
Represents amounts recorded under stock-based compensation accounting standards
and excludes capitalized amounts.
4
Includes
certain
incentive
compensation
expenses,
systems
development
professional
fees
related
to
major
generation
operations
and
retail
billing
/customer
care
computer
applications and
costs relating to certain growth initiatives.
5
Includes
costs
related
to
the
2007
merger
and
abandoned
strategic
transactions,
the
Sponsor
Group
management
fee,
outsourcing
transition
costs
and
costs
related
to
certain
growth
initiatives.
6
Includes
net
third-party
fees
paid
in
connection
with
the
amendment
and
extension
of
the
TCEH
Senior
Secured
Facilities,
gains
on
termination
of
a
long-term
power
sales
contract
and
settlement of amounts due from a hedging/trading counterparty and reversal of
certain liabilities accrued in purchase accounting. 7
Reflects noncapital outage costs.
28 |
 Table
2: TCEH Adjusted EBITDA Reconciliation Three and Nine Months Ended September
30, 2010 and 2011 $ millions
Factor
Q3 10
Q3 11
YTD 10
YTD 11
Net loss
(3,690)
(709)
(3,646)
(1,660)
Income tax expense (benefit)
214
(375)
260
(874)
Interest expense and related charges
852
1,372
2,516
3,020
Depreciation and amortization
345
371
1,027
1,097
EBITDA
(2,279)
659
157
1,583
Adjustments to EBITDA (pre-tax):
Interest income
(23)
(20)
(65)
(66)
Amortization of nuclear fuel
38
35
102
104
Purchase accounting adjustments
1
33
32
124
147
Impairment of assets and inventory write down
2
-
427
1
427
Impairment of goodwill
4,100
-
4,100
-
Unrealized net (gain) loss resulting from hedging transactions
(767)
(138)
(1,615)
247
EBITDA amount attributable to consolidated unrestricted subsidiaries
-
(2)
-
(5)
Amortization of ”day one”
net loss on Sandow 5 power purchase agreement
(9)
-
(19)
-
Corp. depreciation, interest and income tax expense included in SG&A
4
4
9
11
Noncash compensation expense
-
5
11
8
Severance expense
-
50
3
52
Transition and business optimization costs
4
1
18
2
33
Transaction and merger expenses
5
9
9
29
28
Restructuring and other
6
2
(3)
1
70
Expenses incurred to upgrade or expand a generation station
7
-
-
100
100
TCEH Adjusted EBITDA per Incurrence Covenant
1,109
1,076
2,940
2,739
Expenses related to unplanned generation station outages
31
71
122
162
Pro forma adjustment for Oak Grove 2 reaching 70% capacity in Q2
2011
8
-
7
-
32
Other adjustments allowed to determine Adjusted EBITDA per Maintenance Covenant
9
10
-
19
8
TCEH Adjusted EBITDA per Maintenance Covenant
1,150
1,154
3,081
2,941
1
Includes amortization of the intangible net asset value of retail and wholesale
power sales agreements, environmental credits, coal purchase contracts, nuclear fuel contracts and power
purchase agreements and the stepped up value of nuclear fuel. Also includes
certain credits and gains on asset sales not recognized in net income due to purchase accounting.
2
Impairment of assets includes impairment of emissions allowances
and certain assets relating to mining operations due to EPA rule
and impairment of land.
3
Includes
expenses
recorded
under
stock-based
compensation
accounting
standards
and
excludes
capitalized
amounts.
4
Includes certain incentive compensation expenses, systems development professional
fees related to major generation operations and retail billing / customer care computer applications
and costs relating to certain growth initiatives.
5
Includes costs related to the 2007 merger and the Sponsor Group management
fee. 6
Includes net third-party fees paid in connection with the amendment and
extension of the TCEH Senior Secured Facilities, gains on termination of a long-term power sales contract and
settlement of amounts due from a hedging/trading counterparty, and reversal of
certain liabilities accrued in purchase accounting. 7
Reflects noncapital outage costs.
8
Represents the annualization of the of the actual six months ended September 30,
2011 EBITDA results for Oak Grove 2, which achieved the requisite 70% average capacity factor in the
second quarter 2011.
9
Primarily pre-operating expenses related to Oak Grove and Sandow 5 generation
facilities. 29
3 |
 Table
3: Oncor Adjusted EBITDA Reconciliation Three and Nine Months Ended September
30, 2010 and 2011 $ millions
Factor
Q3 10
Q3 11
YTD 10
YTD 11
Net income
149
144
304
302
Income tax expense
79
99
174
197
Interest expense and related charges
87
89
259
265
Depreciation and amortization
176
190
507
540
EBITDA
491
522
1,244
1,304
Interest income
(9)
(7)
(29)
(25)
Purchase accounting adjustments
1
(8)
(7)
(26)
(22)
Transition and business optimization costs and other
2
9
5
13
Oncor Adjusted EBITDA
476
517
1,194
1,270
1
Purchase accounting adjustments consist of amounts related to the accretion of an
adjustment (discount) to regulatory assets. 30 |