Attached files
| file | filename |
|---|---|
| 8-K - FORM 8-K - OCCIDENTAL PETROLEUM CORP /DE/ | form8k-20111027.htm |
| EX-99.3 - EXHIBIT 99.3 - OCCIDENTAL PETROLEUM CORP /DE/ | ex99_3-20111027.htm |
| EX-99.1 - EXHIBIT 99.1 - OCCIDENTAL PETROLEUM CORP /DE/ | ex99_1-20111027.htm |
| EX-99.2 - EXHIBIT 99.2 - OCCIDENTAL PETROLEUM CORP /DE/ | ex99_2-20111027.htm |
| EX-99.5 - EXHIBIT 99.5 - OCCIDENTAL PETROLEUM CORP /DE/ | ex99_5-20111027.htm |
EXHIBIT 99.4

Occidental Petroleum Corporation
Third Quarter 2011 Earnings Conference Call
October 27, 2011
Third Quarter 2011 Earnings Conference Call
October 27, 2011
1

2
Third Quarter 2011 Earnings - Highlights
Third Quarter 2011 Earnings - Highlights
• Core Results - $1.8 Billion vs. $1.2 Billion in 3Q10
– Core EPS $2.18 (diluted) vs. $1.48 in 3Q10.
• Net Income - $1.8 Billion vs. $1.2 Billion in 3Q10
– EPS $2.17 (diluted) vs. $1.46 in 3Q10.
• The small difference between net and core income is
due to discontinued operations.
due to discontinued operations.
2

3
($ in millions)
• Core Results for 3Q11 of $2.6 B vs. $1.8 B in 3Q10 and $2.6 B in 2Q11
– Higher volumes in 3Q11, compared to 2Q11, resulted in flat quarter-to-quarter income despite
lower product prices. The improvement in 3Q11 vs. 3Q10 was driven by higher production and
liquids prices.
lower product prices. The improvement in 3Q11 vs. 3Q10 was driven by higher production and
liquids prices.
Third Quarter 2011 Earnings - Oil & Gas
Segment Variance Analysis - 3Q11 vs. 3Q10
Segment Variance Analysis - 3Q11 vs. 3Q10
3

4
3Q11 3Q10
Reported Segment Earnings ($mm) $2,612 $1,757
WTI Oil Price ($/bbl) $89.76 $76.20
Brent Oil Price ($/bbl) $112.22 $76.41
NYMEX Gas Price ($/mcf) $4.28 $4.53
Oxy’s Realized Prices
Worldwide Oil ($/bbl) $97.24 $72.31
+ 34% year-over-year
Worldwide NGLs ($/bbl) $56.06 $39.70
+ 41% year-over-year
US Natural Gas ($/mcf) $4.23 $4.20
~ flat year-over-year
Third Quarter 2011 Earnings - Oil & Gas Segment
4

5
Third Quarter 2011 Earnings - Oil & Gas Volumes
3Q11 3Q10
Oil and Gas Sales Volumes (mboe/d) 743 713
Oil and Gas Production Volumes (mboe/d) 739 706
– Year-over-year increase of greater than 4.5% (2010 volumes included production
from Libya).
from Libya).
• The year-over-year volume increase reflects our continued focus on
production growth.
production growth.
• 3Q11 production was also more than 3% higher than 2Q11 volumes
of 715 mboe/d.
of 715 mboe/d.
• 3Q11 sales volumes were 743 mboe/d, compared to our guidance of
725 mboe/d.
725 mboe/d.
– The improvement resulted mainly from the higher domestic production and the
timing of liftings.
timing of liftings.
5

6
Third Quarter 2011 Earnings - Oil & Gas Production
Third Quarter 2011 Earnings - Oil & Gas Production
• US production was 436 mboe/d, representing the highest
ever domestic production volumes for the company,
compared to our guidance of 430 to 432 mboe/d.
ever domestic production volumes for the company,
compared to our guidance of 430 to 432 mboe/d.
• Our production in CA rose by 6 mboe/d compared to
2Q11, and contributed a large portion of the sequential
increase in our overall domestic production volumes.
2Q11, and contributed a large portion of the sequential
increase in our overall domestic production volumes.
• Latin America volumes were 30 mboe/d.
– Colombia volumes decreased from 2Q11 due to pipeline interruptions
caused by insurgent activity.
caused by insurgent activity.
6

7
Third Quarter 2011 Earnings - Oil & Gas Production
• In the Middle East region:
– We recorded no production in Libya.
– In Iraq, we produced 4 mboe/d.
– Yemen production was 28 mboe/d, slightly ahead of our
guidance.
guidance.
– In Oman, 3Q11 production was 79 mboe/d, an increase of
3 mboe/d over 2Q11 volumes.
3 mboe/d over 2Q11 volumes.
– In Qatar, 3Q11 production was 73 mboe/d, an increase of
5 mboe/d over 2Q11 volumes.
5 mboe/d over 2Q11 volumes.
• The increase reflected the results of the development program, as well
as maintenance issues that affected the second quarter volumes.
as maintenance issues that affected the second quarter volumes.
– In Dolphin and Bahrain combined, production increased
3 mboe/d from 2Q11 volumes.
3 mboe/d from 2Q11 volumes.
7

8
Third Quarter 2011 Earnings - Oil & Gas
Segment - Realized Prices and Differentials
Segment - Realized Prices and Differentials
Third Quarter 2011 Earnings - Oil & Gas
Segment - Realized Prices and Differentials
Segment - Realized Prices and Differentials
• 3Q11 realized prices declined for all our products from 2Q11:
– Worldwide crude oil realized price was $97.24 p/b, a decrease of 6%.
– Worldwide NGLs were $56.06 p/b, a decline of 3%.
– Domestic natural gas prices were about flat at $4.23 p/mcf.
• Differentials improved in 3Q11, resulting in realized oil prices
representing 108% of the average WTI and 87% of the average
Brent price.
representing 108% of the average WTI and 87% of the average
Brent price.
• About 60% of Oxy’s oil production tracks world oil prices and
40% is indexed to WTI. For example:
40% is indexed to WTI. For example:
– In CA our realized price was 114% of WTI and 91% of Brent in 3Q11.
– In Oman our average price was 117% of WTI and 93% of Brent.
• Price changes at current global prices affect our quarterly
earnings before income taxes by $38 mm for a $1.00 p/b change
in oil prices and $7 mm for a $1.00 p/b change in NGL prices. A
swing of $0.50 per mm BTUs in domestic gas prices affects
quarterly pre-tax earnings by about $34 mm.
earnings before income taxes by $38 mm for a $1.00 p/b change
in oil prices and $7 mm for a $1.00 p/b change in NGL prices. A
swing of $0.50 per mm BTUs in domestic gas prices affects
quarterly pre-tax earnings by about $34 mm.
8

9
Third Quarter 2011 Earnings - Oil & Gas
Segment - Cash Production Costs and Taxes
Segment - Cash Production Costs and Taxes
Third Quarter 2011 Earnings - Oil & Gas
Segment - Cash Production Costs and Taxes
Segment - Cash Production Costs and Taxes
• Oil and gas cash production costs were $12.36 per boe
for the first nine months of 2011, compared with last
year's twelve-month costs of $10.19 per boe.
for the first nine months of 2011, compared with last
year's twelve-month costs of $10.19 per boe.
– The cost increase reflects higher workover and maintenance
activity driven by our program to increase production at these
higher levels of oil prices.
activity driven by our program to increase production at these
higher levels of oil prices.
• Taxes other than on income, which are directly related to
product prices, were $2.29 per boe for the first nine
months of 2011, compared to $1.83 per boe for all of
2010.
product prices, were $2.29 per boe for the first nine
months of 2011, compared to $1.83 per boe for all of
2010.
• Total exploration expense was $39 mm in 3Q11.
9
10
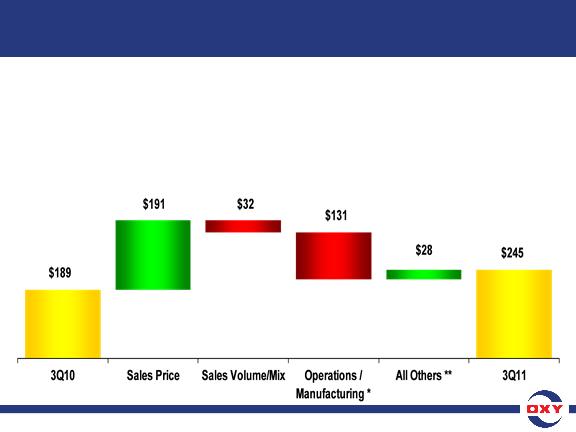
($ in millions)
*Higher feedstock costs
**Power sold to the grid during Texas power shortage
• Core Results for 3Q11 were $245 mm vs. $253 mm in 2Q11 and
$189 mm in 3Q10.
$189 mm in 3Q10.
– The year-over-year improvement reflects higher margins across most product lines. In
addition, during 3Q11, we temporarily idled certain production in our Texas plants and sold
power to the grid during the power shortage, resulting in an increase in the quarter’s earnings.
addition, during 3Q11, we temporarily idled certain production in our Texas plants and sold
power to the grid during the power shortage, resulting in an increase in the quarter’s earnings.
Third Quarter 2011 Earnings - Chemical
Segment Variance Analysis - 3Q11 vs. 3Q10
Segment Variance Analysis - 3Q11 vs. 3Q10
10

11
($ in millions)
• Core Results for 3Q11 were $77 mm vs. $187 mm in 2Q11 and
$163 mm in 3Q10.
$163 mm in 3Q10.
– The decreases from 2Q11 and 3Q10 earnings were due to losses from our Phibro unit both for
the quarter and year-to-date, partially offset by higher pipeline income and increased power
sales to the grid during 3Q11.
the quarter and year-to-date, partially offset by higher pipeline income and increased power
sales to the grid during 3Q11.
Third Quarter 2011 Earnings - Midstream
Segment Variance Analysis - 3Q11 vs. 3Q10
Segment Variance Analysis - 3Q11 vs. 3Q10
11

12
Third Quarter 2011 Earnings - Taxes
• The worldwide effective tax rate was 38% for 3Q11.
– Our higher proportionate domestic income brought us closer to
the US statutory rates.
the US statutory rates.
• Our 3Q11 US and foreign tax rates are included in the
“Investor Relations Supplemental Schedules.”
“Investor Relations Supplemental Schedules.”
12

13
Third Quarter 2011 Earnings -
Nine Months Results & Capital Spending
Nine Months Results & Capital Spending
Third Quarter 2011 Earnings -
Nine Months Results & Capital Spending
Nine Months Results & Capital Spending
YTD2011 YTD2010
• Core Income ($mm) $5,187 $3,377
• Core EPS (diluted) $6.37 $4.14
• Net Income ($mm) $5,137 $3,318
• EPS (diluted) $6.31 $4.07
• Cash flow from operations for 9 months YTD11 was
$8.6 billion.
$8.6 billion.
• Capital spending was $5.0 billion for YTD11 of which
$2.0 billion was spent in 3Q11.
$2.0 billion was spent in 3Q11.
– Year-to-date capital expenditures by segment were 83% in Oil and Gas,
14% in Midstream and the remainder in Chemicals.
14% in Midstream and the remainder in Chemicals.
13

14
Cash Flow
From
Operations
$8,600
From
Operations
$8,600
Beginning
Cash
$2,600
12/31/10
Cash
$2,600
12/31/10
Shah - $500
($ in millions)
Note: See attached GAAP reconciliation.
– Free cash flow from continuing operations after capex and dividends,
but before acquisition and debt activity, was about $2.6 billion.
but before acquisition and debt activity, was about $2.6 billion.
Third Quarter 2011 Earnings -
2011 YTD Cash Flow
2011 YTD Cash Flow
14

15
Third Quarter 2011 Earnings -
Net Acquisition Expenditures
Net Acquisition Expenditures
Third Quarter 2011 Earnings -
Net Acquisition Expenditures
Net Acquisition Expenditures
• Our net acquisition expenditures in the first nine months
were $1.5 billion, which are net of proceeds from the sale
of our Argentina operations.
were $1.5 billion, which are net of proceeds from the sale
of our Argentina operations.
• The acquisitions included the South Texas purchase,
properties in California and the Permian, and a payment
in connection with the signing of the Al Hosn project in
Abu Dhabi, which is the gas development of the Shah
field.
properties in California and the Permian, and a payment
in connection with the signing of the Al Hosn project in
Abu Dhabi, which is the gas development of the Shah
field.
– This payment was for Oxy’s share of development expenditures
incurred by the project prior to the date the final agreement was
signed.
incurred by the project prior to the date the final agreement was
signed.
15

16
Third Quarter 2011 Earnings -
Shares Outstanding, Debt and ROE
Shares Outstanding, Debt and ROE
Shares Outstanding (mm) YTD11 9/30/11
Weighted Average Basic 812.6
Weighted Average Diluted 813.3
Basic Shares Outstanding 811.2
Diluted Shares Outstanding 812.1
9/30/11 12/31/10
Debt/Capital 14% 14%
• During 3Q11, Oxy issued senior notes of $1.3 billion due in 2017 and
$900 million due in 2022 at a weighted average interest rate of 2.3%,
which brought the Company’s average effective borrowing rate
down to 3.2%.
$900 million due in 2022 at a weighted average interest rate of 2.3%,
which brought the Company’s average effective borrowing rate
down to 3.2%.
• Our annualized ROE for YTD11 was 20%.
16

17
Third Quarter 2011 Earnings -
Oxy’s Strategy
Oxy’s Strategy
• Oxy’s overriding goal is to maximize Total Shareholder Return.
• We believe this can be achieved through a combination of:
1. Growing our oil and gas production by 5% to 8% per year on
average over the long term;
average over the long term;
2. Allocating and deploying capital with a focus on achieving
well above cost-of-capital returns; and
well above cost-of-capital returns; and
3. Consistent dividend growth.
17

18
Third Quarter 2011 Earnings -
Oxy’s Strategy - Oil and gas production
Oxy’s Strategy - Oil and gas production
• The impact of our capital program and increase in drilling
activity have started to have a visible impact on our domestic
oil and gas production volumes.
activity have started to have a visible impact on our domestic
oil and gas production volumes.
• Compared to 2Q11, our domestic production increased by
about 6 mboe/d per month, compared to our guidance of
3 to 4 mboe/d.
about 6 mboe/d per month, compared to our guidance of
3 to 4 mboe/d.
– This increase resulted in domestic production of 436 mboe/d for 3Q11,
compared to the 430 to 432 mboe/d guidance we gave you.
compared to the 430 to 432 mboe/d guidance we gave you.
– 3Q11 domestic production is the highest US total production volume in
Oxy’s history, reflecting the highest ever volumes for liquids.
Oxy’s history, reflecting the highest ever volumes for liquids.
• On a year-over-year basis, our domestic production volumes
increased by 15%.
increased by 15%.
18

19
Third Quarter 2011 Earnings -
Oxy’s Strategy - Oil and gas production
Oxy’s Strategy - Oil and gas production
• Compared to the prior year, total company 3Q11 production of
739 mboe/d was affected by a 7% decline in our international
production.
739 mboe/d was affected by a 7% decline in our international
production.
– This reduction was the result of disruptions in the Middle East/North
Africa region, and the impact of higher oil prices on our PSCs.
Africa region, and the impact of higher oil prices on our PSCs.
• In our operations we experience disruptions affecting our
production.
production.
• Without these events our production would have been
10 to 15 mboe/d higher, which is more representative of our
assets’ current theoretical productive capacity.
10 to 15 mboe/d higher, which is more representative of our
assets’ current theoretical productive capacity.
• We believe our capital program will yield higher production
growth and reliability over time.
growth and reliability over time.
19

20
Third Quarter 2011 Earnings -
Oxy’s Strategy - Returns
Oxy’s Strategy - Returns
• ROE - Oxy’s annualized return on equity for the first nine
months of 2011 was 20%.
months of 2011 was 20%.
• ROCE - Oxy’s annualized return on capital employed for
the first nine months of 2011 was 18%.
the first nine months of 2011 was 18%.
• We continue to manage our capital program and
acquisition strategy to yield well above cost-of-capital
returns.
acquisition strategy to yield well above cost-of-capital
returns.
20

21
Third Quarter 2011 Earnings -
Oxy’s Strategy - Dividend growth
Oxy’s Strategy - Dividend growth
• Our ability to pay dividends is indicated by our free cash
flow generation.
flow generation.
• Free cash flow after interest, taxes and capital spending,
but before dividends, acquisitions and debt activity for the
first nine months of the year was $3.7 billion.
but before dividends, acquisitions and debt activity for the
first nine months of the year was $3.7 billion.
• Oxy’s annual dividend rate is currently $1.84 per share or
about $1.1 billion for the nine months of 2011.
about $1.1 billion for the nine months of 2011.
• Oxy has increased its dividends 10 times over the last
9 years, resulting in a compound annual dividend growth
rate of 15.6%.
9 years, resulting in a compound annual dividend growth
rate of 15.6%.
• In keeping with our philosophy to raise the dividend on a
consistent basis, the Board of Directors is expected to
consider a dividend increase at the February meeting.
consistent basis, the Board of Directors is expected to
consider a dividend increase at the February meeting.
21

22
Third Quarter 2011 Earnings -
4Q11 Outlook - US oil and gas production
4Q11 Outlook - US oil and gas production
• We expect 4Q11 oil and gas production to be as follows:
– Domestic volumes are expected to increase by about
3 to 4 mboe/d per month from the current quarterly average
level of 436 mboe/d.
3 to 4 mboe/d per month from the current quarterly average
level of 436 mboe/d.
– This should result in average 4Q11 production of about
442 to 444 mboe/d.
442 to 444 mboe/d.
– This would constitute a year-over-year domestic production
growth rate exceeding 10% and about a 6% per year production
growth rate going forward.
growth rate exceeding 10% and about a 6% per year production
growth rate going forward.
22

23
Third Quarter 2011 Earnings - 4Q11 Outlook
Domestic Asset Review - California
Domestic Asset Review - California
• For the year, we expect to drill and complete 154 shale wells
outside Elk Hills, compared to the 107 wells we had indicated
at the beginning of the year.
outside Elk Hills, compared to the 107 wells we had indicated
at the beginning of the year.
– Including Elk Hills, we expect to drill 195 shale wells for the year.
– We expect to drill and complete a total of 42 shale wells during 4Q11.
• Our experience has been that the 30-day initial production rate
for these wells is between 300 and 400 BOE per day.
for these wells is between 300 and 400 BOE per day.
• With respect to the shale wells outside Elk Hills, about 80% of
the BOE production is a combination of black oil and high-
value condensate.
the BOE production is a combination of black oil and high-
value condensate.
• The cost of drilling and completing the wells has been running
about $3.5 million per well, and we expect this to decline over
time.
about $3.5 million per well, and we expect this to decline over
time.
23

24
Third Quarter 2011 Earnings - 4Q11 Outlook
Domestic Asset Review - California
Domestic Asset Review - California
• Our conventional drilling program is progressing somewhat
better than planned.
better than planned.
• There has been no significant change in the status of
permitting issues in the state since our last call.
permitting issues in the state since our last call.
• We expect the current permitting levels to allow our program
to go forward at these levels and enable us to continue to
grow our production volumes in the state.
to go forward at these levels and enable us to continue to
grow our production volumes in the state.
• We expect the rig count to remain the same at 29.
24

25
Third Quarter 2011 Earnings - 4Q11 Outlook
Domestic Asset Review - Permian & Williston
Domestic Asset Review - Permian & Williston
• In the Permian operations:
– Our CO2 flood production is progressing according to plan.
– We expect our rig count to be about 24 in 4Q11.
– Our non-CO2 operations have stepped up their development
program but will not show significant production growth until
next year.
program but will not show significant production growth until
next year.
• In Williston:
– We are pursuing a development program with about 13 rigs
expected to be running in 4Q11.
expected to be running in 4Q11.
– Our production is growing as a result of the development
program and we expect the growth to continue.
program and we expect the growth to continue.
• Natural gas prices in the US continue to be weak. As a result,
we are considering cutting back our pure gas drilling in the
Midcontinent and possibly elsewhere.
we are considering cutting back our pure gas drilling in the
Midcontinent and possibly elsewhere.
25

26
Third Quarter 2011 Earnings - 4Q11 Outlook
International Oil and Gas
International Oil and Gas
• Internationally, we believe that once the current uncertainties
are behind us, including the resolution of the situation in
Libya and the achievement of a sustained development
program in Iraq, we will achieve production growth similar to
our domestic operations.
are behind us, including the resolution of the situation in
Libya and the achievement of a sustained development
program in Iraq, we will achieve production growth similar to
our domestic operations.
• We expect our 4Q11 international production to be about the
same as 3Q11 production, 4% higher than 2Q11, which
represented the low point of volumes during the year
following the situation in Libya.
same as 3Q11 production, 4% higher than 2Q11, which
represented the low point of volumes during the year
following the situation in Libya.
• Colombia volumes should be modestly higher than 3Q11,
assuming no further pipeline attacks.
assuming no further pipeline attacks.
26

27
Third Quarter 2011 Earnings - 4Q11 Outlook
International Oil and Gas
International Oil and Gas
• The Middle East region production is expected to be as
follows for 4Q11:
follows for 4Q11:
• At this point, we expect no significant production from Libya.
• Our joint venture partnerships are currently in the process of
resuming production, but production ramp-up will be
hampered in the near term by lack of vehicles and personnel
to address operational problems from the prolonged shut-in.
resuming production, but production ramp-up will be
hampered in the near term by lack of vehicles and personnel
to address operational problems from the prolonged shut-in.
• In Iraq, we expect production to be similar to the past quarter.
Going forward, we still are unable to reliably predict spending
levels, which determine production.
Going forward, we still are unable to reliably predict spending
levels, which determine production.
• In the remainder of the Middle East, we expect production to
be comparable to 3Q11 volumes.
be comparable to 3Q11 volumes.
27

28
Third Quarter 2011 Earnings -
4Q11 Outlook - Oil and Gas
4Q11 Outlook - Oil and Gas
• At quarter-end prices, we expect total production to
increase to around 745 mboe/d as a result of the 3 to 4
mboe/d per month coming from domestic production.
increase to around 745 mboe/d as a result of the 3 to 4
mboe/d per month coming from domestic production.
• We expect sales volumes to be around 740 mboe/d due
to the timing of liftings.
to the timing of liftings.
• A $5.00 change in global oil prices would impact our PSC
daily volumes by about 3 mboe/d.
daily volumes by about 3 mboe/d.
• We expect our total year capital expenditures to be about
$7.0 billion.
$7.0 billion.
• We expect exploration expense to be about $100 mm for
seismic and drilling for our exploration programs in
4Q11.
seismic and drilling for our exploration programs in
4Q11.
28

29
Third Quarter 2011 Earnings -
4Q11 Outlook - Chemicals & Taxes
4Q11 Outlook - Chemicals & Taxes
• The chemical segment earnings in 4Q11, historically the
weakest quarter, are expected to be about $100 mm.
weakest quarter, are expected to be about $100 mm.
– This reduction from the third quarter is due to seasonal
slowdowns in many markets such as construction, customers’
efforts to minimize inventories and a slowdown in exports.
slowdowns in many markets such as construction, customers’
efforts to minimize inventories and a slowdown in exports.
• We expect our combined worldwide tax rate in 4Q11 to
remain at about 38%.
remain at about 38%.
29

30
Third Quarter 2011 Earnings - Summary
Third Quarter 2011 Earnings - Summary
• Our 3Q11 core income of $2.18 per share was about
12% higher than the analysts’ consensus estimate.
12% higher than the analysts’ consensus estimate.
• Our 3Q11 oil and gas earnings of $2.6 billion were
essentially unchanged from 2Q11, despite a $6 p/b
decline in our average oil realizations.
essentially unchanged from 2Q11, despite a $6 p/b
decline in our average oil realizations.
• Our annualized return on equity was 20% for the first
nine months of 2011.
nine months of 2011.
• Our total oil and gas production of 739 mboe/d during
3Q11 grew more than 3% compared to 2Q11.
3Q11 grew more than 3% compared to 2Q11.
• Domestic oil and gas production volumes grew to
436 mboe/d in 3Q11 a 3% increase from 2Q11, and
above our earlier guidance of 430 to 432 mboe/d.
436 mboe/d in 3Q11 a 3% increase from 2Q11, and
above our earlier guidance of 430 to 432 mboe/d.
• Domestic volumes are expected to further increase
by about 3 to 4 mboe/d per month in 4Q11.
by about 3 to 4 mboe/d per month in 4Q11.
30

31
31