Attached files
| file | filename |
|---|---|
| 8-K - FORM 8-K - Encompass Health Corp | form8k-2011q3.htm |
| EX-99.1 - EXHIBIT 99.1 - Encompass Health Corp | exhibit99-1.htm |

Exhibit 99.2
Third Quarter 2011 Earnings Call
Supplemental Slides

Exhibit 99.2
The information contained in this presentation includes certain estimates, projections and other forward-
looking information that reflect our current outlook, views and plans with respect to future events, including
legislative and regulatory developments, strategy, capital expenditures, financial performance, and
business model. These estimates, projections and other forward-looking information are based on
assumptions that HealthSouth believes, as of the date hereof, are reasonable. Inevitably, there will be
differences between such estimates and actual events or results, and those differences may be material.
There can be no assurance that any estimates, projections or forward-looking information will be realized.
All such estimates, projections and forward-looking information speak only as of the date hereof.
HealthSouth undertakes no duty to publicly update or revise the information contained herein.
HealthSouth undertakes no duty to publicly update or revise the information contained herein.
You are cautioned not to place undue reliance on the estimates, projections and other forward-looking
information in this presentation as they are based on current expectations and general assumptions and
are subject to various risks, uncertainties and other factors, including those set forth in the Form 10-K for the
year ended December 31, 2010, our Form 10-Q for the quarters ended March 31, 2011, June 30, 2011, and
September 30, 2011, when filed, and in other documents we previously filed with the SEC, many of which
are beyond our control, that may cause actual events or results to differ materially from the views, beliefs
and estimates expressed herein.
Note Regarding Presentation of Non-GAAP Financial Measures
The following presentation includes certain “non-GAAP financial measures” as defined in Regulation G
under the Securities Exchange Act of 1934. Schedules are attached that reconcile the non-GAAP financial
measures included in the following presentation to the most directly comparable financial measures
calculated and presented in accordance with Generally Accepted Accounting Principles in the United
States. Our Form 8-K, dated October 27, 2011, to which the following supplemental slides are attached as
Exhibit 99.2, provides further explanation and disclosure regarding our use of non-GAAP financial measures
and should be read in conjunction with these supplemental slides.
Forward-Looking Statements
2

Exhibit 99.2
Table of Contents
3

Exhibit 99.2
Q3 2011 Summary (Q3 2011 vs. Q3 2010)
ü Revenue growth of 8.0%
― Inpatient revenue growth of 8.6%
§ Discharge growth 5.1%
• Strong same-store discharge growth of 4.0%
§ Revenue per discharge increase of 3.3%
ü Disciplined expense management and improved operating leverage
― SWB as a percent of revenue decreased 110 bps.
― Hospital-related expenses as a percent of revenue decreased by 10 bps.
|
Location
|
# of Beds
|
Transaction
|
Date
|
|
Bristol, VA
|
25
|
De Novo
|
Q3 2010
|
|
Houston, TX
|
50
|
Acquired new IRF
|
Q3 2010
|
4

Exhibit 99.2
Q3 2011 Summary (Q3 2011 vs. Q3 2010) (cont.)
ü Adjusted EBITDA (1) for the quarter of $110.5 million reflects growth of 15.2%.
ü Adjusted free cash flow (1) for the quarter of $32.4 million:
― Benefited from higher Adjusted EBITDA
― Benefited from the absence of a swap payment ($10.6 million in Q3 2010)
― Offset by approx. $16 million for timing of interest payments
― Offset by approx. $17 million increase in accounts receivable
• Medicare payment deferrals related to legal entity reorganizations
• Increases resulting from revenue growth
ü Earnings per share (2) were negatively impacted by an $18.5 million, or $0.20 per
share, increase in income tax expense mainly attributable to the release of the
valuation allowance in Q4 2010 (see table on slide 11).
share, increase in income tax expense mainly attributable to the release of the
valuation allowance in Q4 2010 (see table on slide 11).
(1) Reconciliation to GAAP provided on slides 31, 32, 34, and 37 - 38.
(2) Earnings per share from continuing operations attributable to HealthSouth
5
Expect full-year adjusted free cash flow to be at least $210 million
reflecting growth over full-year 2010 of at least 16%
reflecting growth over full-year 2010 of at least 16%

Exhibit 99.2
Q3 2011 Summary (Q3 2011 vs. Q3 2010) (cont.)
ü Completed the sale of five long-term acute care hospitals (LTCHs) for approx.
$117.5 million.
$117.5 million.
ü Additional capital structure enhancements
― Completed the retirement of the10.75% senior notes due 2016
ü TeamWorks Care Management implementation completed in all HealthSouth
hospitals
hospitals
ü Clinical information system (CIS) implementation completed in second hospital
― Pilot phase now complete
― System-wide rollout will begin in 2012
6
Leverage ratio reduced to 2.9x (1)
(1) Based on trailing four-quarter Adjusted EBITDA of $455.4 million; reconciliation to GAAP provided on slides 31, 32, 34, and 38.

Exhibit 99.2
HealthSouth Functional Outcomes Continue to Outpace Industry Average
HealthSouth Average
UDS Average*
FIM Gain
LOS Efficiency
* Average = Expected, Risk-adjusted
Source: UDSmr Database - On Demand Report: Q3 2011 Report
FIM Gain
Change in Functional
Independence
Measurement (based
Independence
Measurement (based
on an 18 point
assessment) from
admission to discharge.
assessment) from
admission to discharge.
LOS Efficiency
Functional gain divided
by length of stay.
by length of stay.
High-Quality Care
7

Exhibit 99.2
― Inpatient revenue growth of 8.6%
§ Discharge growth of 5.1%
• Strong same-store discharge growth of 4.0%
• Continued positive contribution from hospitals opened or acquired in the last 12 months
§ Revenue per discharge increased 3.3%
• Medicare (2.25%) and managed care price adjustments
• Q3 2010 impacted by initial Medicare enrollment period (1) at hospitals opened in 2010
• Improved patient outcomes
― Outpatient and other revenue benefited from $1.7 million in state provider taxes.
8
(1) We generally do not receive full reimbursement for the first 30 Medicare patients discharged from a new hospital.

Exhibit 99.2
Expenses (Q3 2011 vs. Q3 2010)
ü Disciplined expense management and improved operating leverage
― SWB as a percent of revenue decreased 110 bps.
§ Q3 2010 results impacted by the ramping up of new hospitals.
― Hospital-related expenses as a percent of revenue decreased 10 bps.
§ Improved operating leverage offset by higher bad debt expense in Q3 2011
9

Exhibit 99.2
Adjusted EBITDA Change
Q3 9 Months
+$14.6M +$45.8M
+15.2% +15.4%
•Revenue growth driven
by higher volumes and
price
by higher volumes and
price
•Disciplined expense
management and
improved operating
leverage
management and
improved operating
leverage
10

Exhibit 99.2
11
(1) Income from continuing operations attributable to HealthSouth
(2) Actual tax provision recorded for the period
(3) Cash income taxes for the 3 and 9 months ended September 30, 2011 were $1.7 million and $5.9 million, respectively.
(4) During Q3 2010 and 9 months 2010, the Company maintained a valuation allowance against substantially all of its deferred tax assets. A substantial portion of the valuation
allowance was released in Q4 2010.
allowance was released in Q4 2010.
(5) Includes an approx. $28 million, or $0.30 per share, benefit related to the Company’s settlement with the IRS for tax years 2007 and 2008 and a reduction in unrecognized tax
benefits due to the lapse of the statute of limitations for certain federal and state claims.
benefits due to the lapse of the statute of limitations for certain federal and state claims.
(6) The $6.5 million and $19.5 million dividends related to our convertible perpetual preferred stock in the 3 and 9 month periods ended September 30, 2011 and 2010, respectively,
must be subtracted from income from continuing operations when calculating basic earnings per share.
must be subtracted from income from continuing operations when calculating basic earnings per share.
(7) Diluted earnings per share on a GAAP basis are the same as basic earnings per share due to the antidilutive impact in each period presented.

Exhibit 99.2
• Adjusted free cash flow for the quarter was affected by:
– Benefited from higher Adjusted EBITDA
– Benefited from the absence of a swap payment ($10.6 million Q3 2010)
– Offset by approx. $16 million for the timing of interest payments
– Offset by approx. $17 million increase in accounts receivable
§ Medicare payment deferrals related to legal entity reorganizations
§ Increases resulting from revenue growth
12
Expect full-year adjusted free cash flow to be at least $210 million reflecting
growth over full-year 2010 of at least 16%
growth over full-year 2010 of at least 16%

Exhibit 99.2
(1) Based on 2008 and trailing four-quarter Adjusted EBITDA of $322.6 million and $455.4 million, respectively; reconciliation to GAAP provided
on slides 31 - 34 and 38.
on slides 31 - 34 and 38.
Debt and Liquidity
Liquidity
13
Credit Ratings

Exhibit 99.2
Debt Profile
14
$500
Revolver
L+225
September 30 , 2011 (3)
$276
Undrawn
Undrawn
2016
10% of the outstanding principal is
currently callable per annum at $103
currently callable per annum at $103
(1) Based on trailing four-quarter Adjusted EBITDA of $455.4 million; reconciliation to GAAP provided on slides 31, 32, 34, and 38.
(2) The credit agreement has a $200 million restricted payment basket for debt repayment and stock repurchases, which is subject to
an annual grower basket equal to 50% of excess cash flow plus certain other amounts including net cash proceeds from certain
equity issuances.
an annual grower basket equal to 50% of excess cash flow plus certain other amounts including net cash proceeds from certain
equity issuances.
(3) Does not include $387.4 million of convertible perpetual preferred stock and capital leases and other note payables.
Capital Structure Enhancements:
§Completed the retirement of the 10.75% notes due 2016
§Reduced total debt by $131 million during the quarter
§Leverage ratio reduced to 2.9x (1)
Debt Profile:
§Additional debt pre-payment opportunities and flexible covenants (2)
§No near-term maturities and well-spaced debt maturities
§Limited exposure to higher interest rates

Exhibit 99.2
Reinvesting Free Cash Flow
15
• Additional debt prepayment (revolver, term loan
and senior notes)
and senior notes)
• Growth in core business
• Bed expansions
• De novo hospitals
• Hospital acquisitions
• Acute care IRF unit acquisitions/consolidations
• Purchase properties under operating leases
• Lower capital cost
• Greater control of property, CON and/or license
• Share repurchase ($125 million authorization)
− Offset dilution from shares underlying convertible
preferred shares (13.1 million shares), shares issued in
settlement of securities litigation (5.0 million shares),
and shares issued as a result of the Company’s stock
incentive plan
preferred shares (13.1 million shares), shares issued in
settlement of securities litigation (5.0 million shares),
and shares issued as a result of the Company’s stock
incentive plan
• Cash dividends (one time or regular)

Exhibit 99.2
2011 Guidance - Adjusted EBITDA(1)
Original Guidance
Feb. 17, 2011
$440 million to $450
million (Inclusive of
12 months LTCH
Adjusted EBITDA)
million (Inclusive of
12 months LTCH
Adjusted EBITDA)
(1) Reconciliation to GAAP provided on slides 31, 32, 34, and 38.
Q4 2011 Considerations:
üTough discharge volume comps (5.9% discharge growth in Q4 2010)
üBad debt expense was $1.3 million, or 0.3% of revenue, in Q4 2010.
üMedicare pricing in Q4 2011 is expected to increase by approx. 1.6%.
üSWB benefited in Q4 2010 from a $3.3 million favorable adjustment related to workers’
compensation.
compensation.
16
July 27, 2011
$447 million to $453
million
million
May 18, 2011
$440 million to $450
million;
(The high end of, or
greater than)
million;
(The high end of, or
greater than)
Guidance effectively raised by the 2011
expected LTCH Adjusted EBITDA
($17.5 million EBITDA in 2010)
expected LTCH Adjusted EBITDA
($17.5 million EBITDA in 2010)
Reflects 9.9% to 11.1% growth over 2010
Oct. 27, 2011
$450 million to $455
million
million
Raised Guidance

Exhibit 99.2
2011 Guidance - EPS
|
ü The Adjusted EBITDA ($17.5 million in 2010) associated with the Company’s six LTCHs has been
reclassified to discontinued operations. |
Basic Earnings per Share from
Continuing Operations Attributable
to HealthSouth (1)
Continuing Operations Attributable
to HealthSouth (1)
$1.18 to $1.23
Considerations:
ü Includes $38.8 million, or $0.42 per share, loss (pre-tax) on early extinguishment of debt related
to the Company’s retirement of its 10.75% senior notes
to the Company’s retirement of its 10.75% senior notes
ü Includes an approx. $28 million, or $0.30 per share, benefit and assumes provision for income
tax of 38% to 40% for Q4 2011; cash taxes expected to be $5 million to $8 million.
tax of 38% to 40% for Q4 2011; cash taxes expected to be $5 million to $8 million.
ü $10.6 million, or $0.11 per share, gain (pre-tax) in government, class action, and related
settlements
settlements
ü The Company expects interest expense to be approx. $24 million in Q4 2011.
ü Assumes a basic share count of 93.3 million shares
(1) Income from continuing operations attributable to HealthSouth
17
Diluted earnings per share on a GAAP
basis are the same as basic earnings per
share due to the antidilutive impact in
the period.
basis are the same as basic earnings per
share due to the antidilutive impact in
the period.

Exhibit 99.2
|
|
(2) Income from continuing operations attributable to HealthSouth (reclassified for the 6 LTCHs moving to discontinued operations)
(3) Current period amounts in income tax provision; see slides 35 - 36.
(4) Total income tax provision for full-year 2010, including the reversal of a substantial portion of the Company's valuation allowance against deferred tax assets.
(5) Includes an approx. $28 million, or $0.30 per share, benefit related to the Company’s settlement with the IRS for tax years 2007 and 2008, and a reduction in
unrecognized tax benefits due to the lapse of the statute of limitations for certain federal and state claims; assumes 38% to 40% effective tax rate for Q4 2011.
unrecognized tax benefits due to the lapse of the statute of limitations for certain federal and state claims; assumes 38% to 40% effective tax rate for Q4 2011.
(6) The dividends related to our convertible perpetual preferred stock must be subtracted from income from continuing operations when calculating basic
earnings per share.
earnings per share.
18

Exhibit 99.2
(1) Reconciliation to GAAP provided on slide 37.
HealthSouth’s GAAP income statement will be affected by a
number of items that will not affect adjusted free cash flow:
number of items that will not affect adjusted free cash flow:
•Normalized GAAP tax rate resulting from the valuation
allowance reversal in Q4 2010.
allowance reversal in Q4 2010.
•Loss on early extinguishment of debt
Expect full-year adjusted free cash flow to be at least $210 million
reflecting growth over full-year 2010 of at least 16%
reflecting growth over full-year 2010 of at least 16%
19

Exhibit 99.2
Appendix

Exhibit 99.2
(1) Reconciliation to GAAP provided on slides 31 - 38.
(2) Exclusive of any E&Y recovery.
21
Business Model
• Adjusted EBITDA CAGR: 5-8% (1)
• Adjusted Free Cash Flow CAGR: 12-17% (1)

Exhibit 99.2
Income Tax Considerations
|
GAAP Considerations:
•As of 9/30/11, the Company had an ending balance of approx. $1.3 billion in federal
NOLs and a remaining valuation allowance of approx. $105 million, primarily related to state NOLs. •Expect effective tax rate of approx. 40% going forward
Future Cash Tax Payments:
•The Company expects to pay approx. $5 million to $8 million per year of income tax.
•The Company does not expect to pay significant federal income taxes for up to 7
years. •HealthSouth is not currently subject to an annual use limitation (“AUL”) under Internal
Revenue Code Section 382 (“Section 382”). A “change of ownership,” as defined by Section 382, would subject us to an AUL, which is equal to the market capitalization of the Company at the time of the “change of ownership” multiplied by the long-term tax exempt rate. |
22

Exhibit 99.2
HealthSouth’s volume growth has outpaced competitors’
(2) Includes consolidated HealthSouth inpatient rehabilitation hospitals classified as same store during that time period.
Our Historic Discharge Growth vs. Industry
4.7%
5.9%
5.9%
5.8%
5.9%
2.7%
2.5%
1.3%
23
• TeamWorks = standardized and
enhanced sales & marketing
enhanced sales & marketing
• Bed additions will help facilitate
continued organic growth
continued organic growth
UDS Industry Sites (1)
HLS Same Store (2)
5.1%
6.1%
7.8%
Yearly
Discharge 6.9% 5.6% 3.1%
Discharge 6.9% 5.6% 3.1%
Growth
2008 vs. 2009 vs. 2010 vs. Q110 vs. Q210 vs. Q310 vs. Q410
vs. Q111 vs. Q211 vs. Q311 vs.
2007 2008 2009 Q109 Q209 Q309 Q409 Q110 Q210 Q310
Quarterly Discharge Growth
Same Store
HealthSouth vs. Industry

Exhibit 99.2
Debt Schedule
(1) Based on 4 quarter trailing and 2010 Adjusted EBITDA of $455.4 million and $409.6 million, respectively; reconciliation to GAAP provided
on slides 31, 32, 34, and 38.
on slides 31, 32, 34, and 38.
24

Exhibit 99.2
Revenues & Expenses (9 Months)
25

Exhibit 99.2
26

Exhibit 99.2
Payment Sources (Percent of Revenue)
(1) Managed Medicare revenues represent ~ 7%, 8%, 7%, 8%, and 8% of total revenues for Q3 2011, Q3 2010, 9 Months 2011, and 9 Months
2010, Full Year 2010, respectively, and are included in “Managed care and other discount plans.”
2010, Full Year 2010, respectively, and are included in “Managed care and other discount plans.”
27
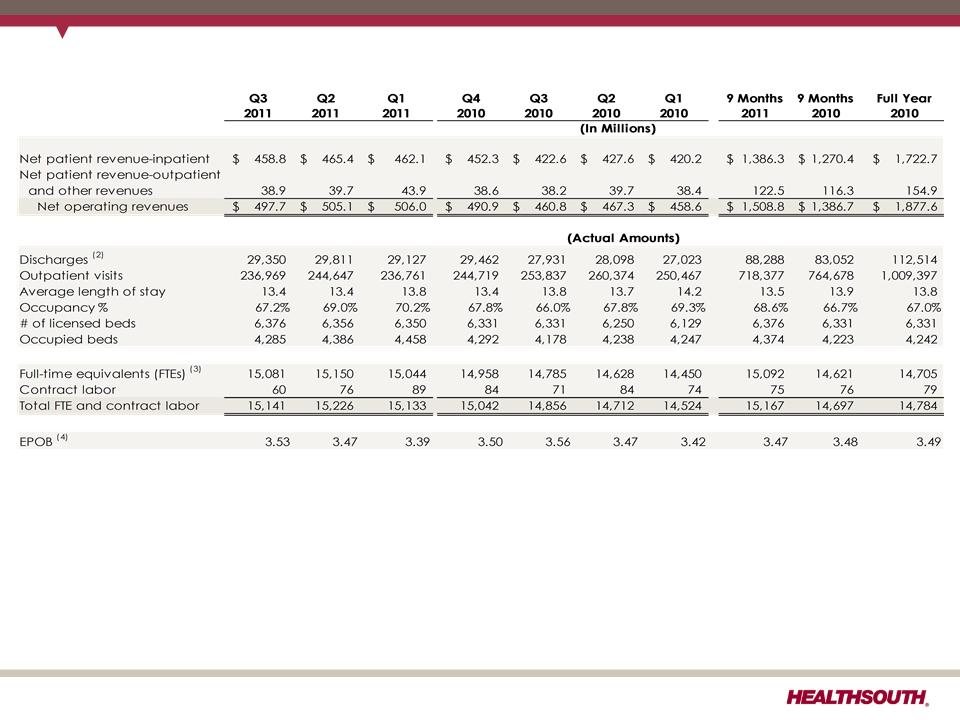
Exhibit 99.2
Operational and Labor Metrics (1)
(1) Numbers have been reclassified to reflect current continuing operations.
(2) Represents discharges from HealthSouth’s 94 consolidated hospitals in Q3 2011, Q2 2011, Q1 2011, Q4 2010 and Q3 2010, 92
consolidated hospitals in Q2 2010, and 90 consolidated hospitals prior to Q2 2010.
consolidated hospitals in Q2 2010, and 90 consolidated hospitals prior to Q2 2010.
(3) Excludes approximately 400 full-time equivalents, who are considered part of corporate overhead with their salaries and benefits
included in general and administrative expenses in the Company’s consolidated statements of operations. Full-time equivalents
included in the above table represent HealthSouth employees who participate in or support the operations of the Company’s
hospitals.
included in general and administrative expenses in the Company’s consolidated statements of operations. Full-time equivalents
included in the above table represent HealthSouth employees who participate in or support the operations of the Company’s
hospitals.
(4) Employees per occupied bed, or “EPOB,” is calculated by dividing the number of full-time equivalents, including an estimate of full-
time equivalents from the utilization of contract labor, by the number of occupied beds during each period. The number of
occupied beds is determined by multiplying the number of licensed beds by the Company’s occupancy percentage.
time equivalents from the utilization of contract labor, by the number of occupied beds during each period. The number of
occupied beds is determined by multiplying the number of licensed beds by the Company’s occupancy percentage.
28
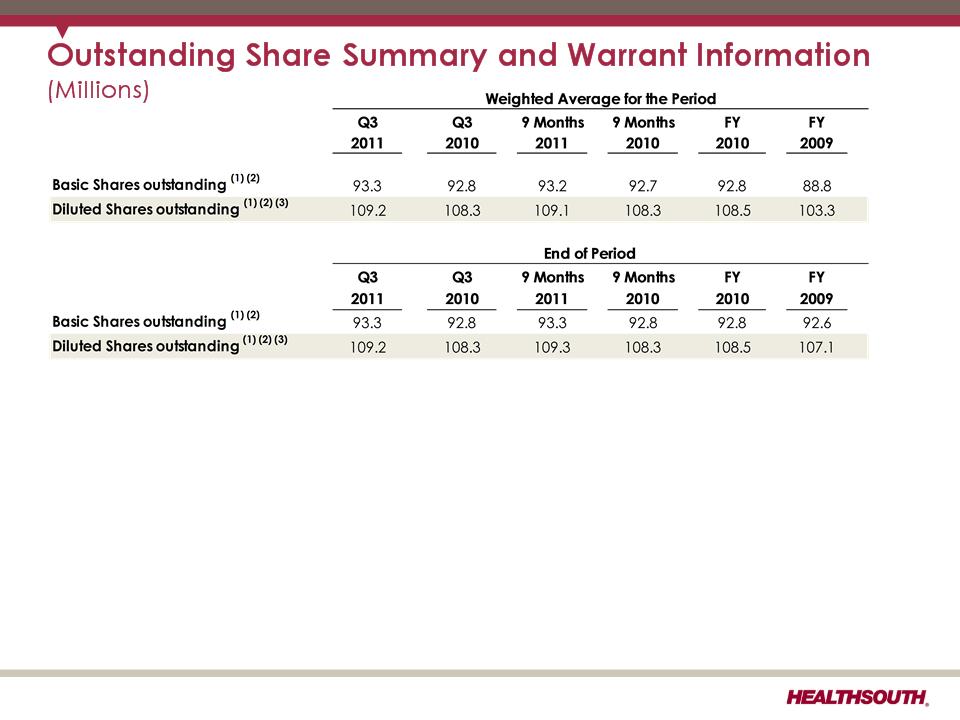
Exhibit 99.2
29
Notes:
(1) Does not include 2.0 million warrants issued in connection with a January 2004 loan repaid to Credit Suisse First Boston. In connection
with this transaction, we issued warrants to the lender to purchase two million shares of our common stock. Each warrant has a term
of ten years from the date of issuance (expire January 16, 2014) and an exercise price of $32.50 per share. The warrants were not
assumed exercised for dilutive shares outstanding because they were antidilutive in the periods presented.
(2) The agreement to settle our class action securities litigation received final court approval in January 2007. These shares of common
stock and warrants were issued on September 30, 2009. The 5.0 million of common shares are now included in the outstanding shares.
The warrants to purchase approx. 8.2 million shares of common stock at a strike price of $41.40 (expire January 17, 2017) were not
assumed exercised for the dilutive shares outstanding because they are anti-dilutive in the periods presented.
(3) The difference between the basic and diluted shares outstanding is primarily related to our convertible perpetual preferred stock
(13.1 million shares). The preferred stock is convertible, at the option of the holder, at any time into shares of common stock at an
initial conversion price of $30.50 per share, which is equal to an initial conversion rate of approximately 32.7869 shares of common
stock per share of preferred stock, subject to a specified adjustment. On or after July 20, 2011, we may cause the shares of preferred
stock to be automatically converted into shares of our common stock at the conversion rate then in effect if the closing price of our
common stock for 20 trading days within a period of 30 consecutive trading days ending on the trading day before the date we
give the notice of forced conversion exceeds 150% of the conversion price of the preferred stock.

Exhibit 99.2
Adjusted EBITDA (1) History
30

Exhibit 99.2
Reconciliation of Net Income to Adjusted EBITDA (1)(3)
(1) (2) (3) (4) - Notes on page 34
31

Exhibit 99.2
Reconciliation of Net Income to Adjusted EBITDA (1)(3)
(1) (2) (3) (4) - Notes on page 34.
32

Exhibit 99.2
Reconciliation of Net Income to Adjusted EBITDA (1) (3)
(1) (2) (3) (4) - Notes on page 34.
33

Exhibit 99.2
Reconciliation Notes for Slides 31-33
1. Adjusted EBITDA is a non-GAAP financial measure. The Company’s leverage ratio (total
consolidated debt to Adjusted EBITDA for the trailing four quarters) is, likewise, a non-
GAAP financial measure. Management and some members of the investment
community utilize Adjusted EBITDA as a financial measure and the leverage ratio as a
liquidity measure on an ongoing basis. These measures are not recognized in
accordance with GAAP and should not be viewed as an alternative to GAAP
measures of performance or liquidity. In evaluating Adjusted EBITDA, the reader should
be aware that in the future HealthSouth may incur expenses similar to the adjustments
set forth.
2. Per share amounts for each period presented are based on diluted weighted average
shares outstanding unless the amounts are antidilutive, in which case the per share
amount is calculated using the basic share count after subtracting the $6.5 million per
quarter dividend on the convertible perpetual preferred stock. The difference in shares
between the basic and diluted shares outstanding is primarily related to our
convertible perpetual preferred stock.
3. Adjusted EBITDA is a component of our guidance.
4. The dividends related to our convertible perpetual preferred stock must be subtracted
from income from continuing operations when calculating basic earnings per share.
from income from continuing operations when calculating basic earnings per share.
34

Exhibit 99.2
35

Exhibit 99.2
Reconciliation Notes for Slide 35
1. Adjusted income from continuing operations and Adjusted EBITDA are non-GAAP financial
measures. The Company’s leverage ratio (total consolidated debt to Adjusted EBITDA for the
trailing four quarters) is, likewise, a non-GAAP financial measure. Management and some
members of the investment community utilize adjusted income from continuing operations as
a financial measure and Adjusted EBITDA and the leverage ratio as liquidity measures on an
ongoing basis. These measures are not recognized in accordance with GAAP and should not
be viewed as an alternative to GAAP measures of performance or liquidity. In evaluating
these adjusted measures, the reader should be aware that in the future HealthSouth may
incur expenses similar to the adjustments set forth.
2. Per share amounts for each period presented are based on basic weighted average
common shares outstanding for all amounts except adjusted income from continuing
operations per diluted share, which is based on diluted weighted average shares
outstanding. The difference in shares between the basic and diluted shares outstanding is
primarily related to our convertible perpetual preferred stock.
3. Adjusted income from continuing operations per diluted share and Adjusted EBITDA are two
components of our historical guidance.
components of our historical guidance.
4. The Company’s credit agreement allows certain other items to be added to arrive at
Adjusted EBITDA, and there may be certain other deductions required.
Adjusted EBITDA, and there may be certain other deductions required.
36

Exhibit 99.2
Adjusted Free Cash Flow
(1) Maintenance capital expenditures are expected to be $10 to $15 million higher in 2011 than in 2010.
(2) Final swap payment of $10.9 million was made in March 2011.
37

Exhibit 99.2
Net Cash Provided by Operating Activities
38