Attached files
| file | filename |
|---|---|
| EX-99.1 - EXHIBIT 99.1 - Colfax CORP | v238079_ex99-1.htm |
| 8-K - 8-K CURRENT REPORT - Colfax CORP | v238079_8k.htm |

Third Quarter 2011 Earnings Call October 27, 2011

Q3 2011 Earnings Call 1 The following information contains forward - looking statements, including forward - looking statements within the meaning of the Private Securities Litigation Reform Act of 1995. Such forward - looking statements include, but are not limited to, statements concerning Colfax's plans, objectives, expectations and intentions and other statements that are not historical or current facts, including the expected effects of the proposed Charter acquisition, its anticipated benefits and the potential impact on our business. Forward - looking statements are based on Colfax's current expectations and involve risks and uncertainties that could cause actual results to differ materially from those expressed or implied in such forward - looking statements. Factors that could cause Colfax's results to differ materially from current expectations include, but are not limited to, factors detailed in Colfax's reports filed with the U.S. Securities and Exchange Commission including its 2010 Annual Report on Form 10 - K and its Quarterly Report on Form 10 - Q for the period ended September 30, 2011 under the caption “Risk Factors”. In addition, these statements are based on a number of assumptions that are subject to change. This presentation speaks only as of this date. Colfax disclaims any duty to update the information herein. Forward - Looking Statements

Q3 2011 Earnings Call 2 ▪ Adjusted net income of $16.3 million (37 cents per share) compared to $9.5 million (22 cents per share) in Q3 2010, an increase of 71.6%; Q3 2011 results include the positive 2 cent per share effect of currency translation ▪ Net sales of $170.3 million compared to $132.4 million in Q3 2010, an increase of 28.6% ▪ Adjusted operating income of $23.9 million compared to $15.6 million in Q3 2010, an increase of 53.2% ▪ Third quarter orders of $174.8 million compared to $124.1 million in Q3 2010, an increase of 40.9% ▪ Backlog of $373.4 million Q3 2011 Highlights

Q3 2011 Earnings Call 3 ▪ Adjusted net income of $40.5 million (91 cents per share) compared to $23.3 million (53 cents per share) for year to date 2010, an increase of 73.8%; 2011 results include the positive 6 cent per share effect of currency translation ▪ Net sales of $515.6 million compared to $375.3 million for year to date 2010, an increase of 37.4% ▪ Adjusted operating income of $62.8 million compared to $39.3 million for year to date 2010, an increase of 59.8% ▪ Year to date 2011 orders of $529.4 million compared to $399.2 million for year to date 2010, an increase of 32.6% Year to Date 2011 Highlights
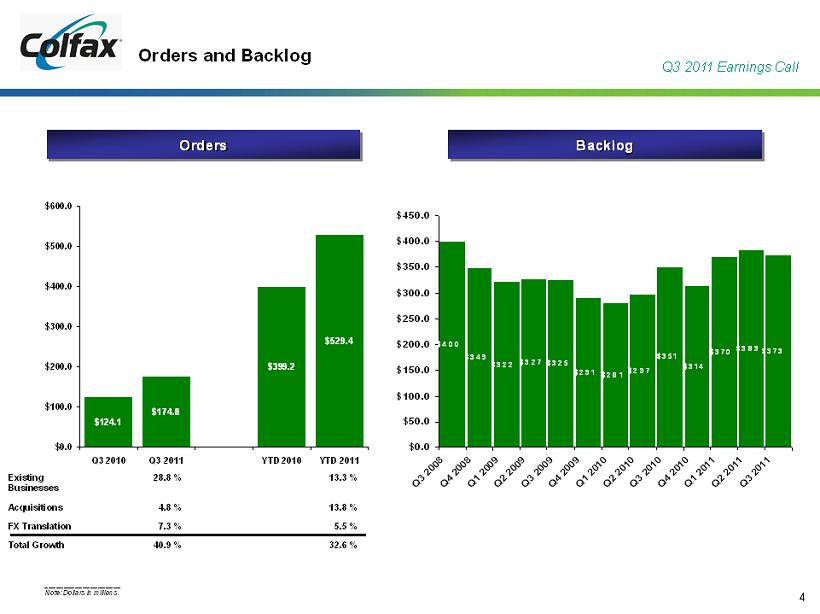
Q3 2011 Earnings Call 4 ____________________ Note: Dollars in millions. Orders Orders and Backlog Backlog $314 $370 $383 $373 $351 $297 $281 $291 $325 $327 $349 $400 $322 $0.0 $50.0 $100.0 $150.0 $200.0 $250.0 $300.0 $350.0 $400.0 $450.0 Q3 2008Q4 2008Q1 2009Q2 2009Q3 2009Q4 2009Q1 2010Q2 2010Q3 2010Q4 2010Q1 2011Q2 2011Q3 2011 $124.1 $174.8 $399.2 $529.4 $0.0 $100.0 $200.0 $300.0 $400.0 $500.0 $600.0 Q3 2010 Q3 2011 YTD 2010 YTD 2011 Existing Businesses 28.8 % 13.3 % Acquisitions 4.8 % 13.8 % FX Translation 7.3 % 5.5 % Total Growth 40.9 % 32.6 %
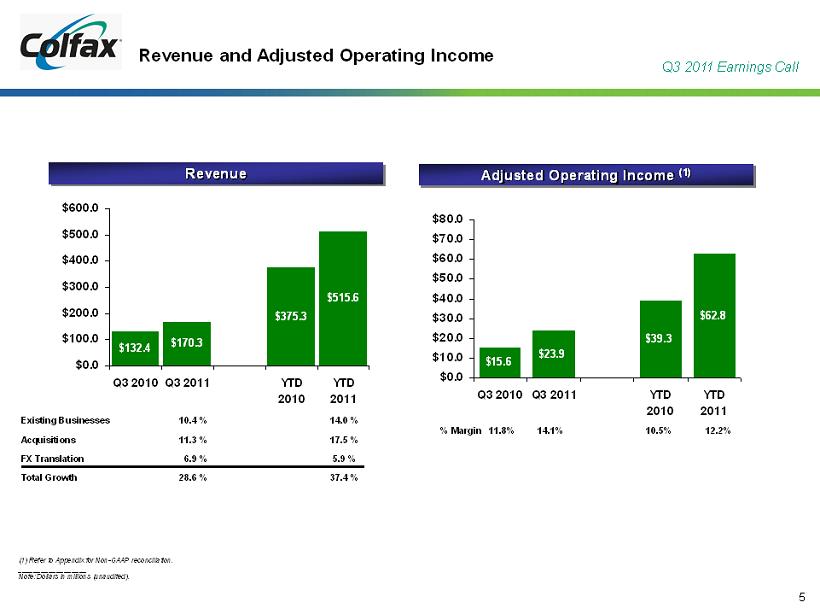
Q3 2011 Earnings Call 5 $15.6 $23.9 $39.3 $62.8 $0.0 $10.0 $20.0 $30.0 $40.0 $50.0 $60.0 $70.0 $80.0 Q3 2010 Q3 2011 YTD 2010 YTD 2011 Adjusted Operating Income (1) Revenue $132.4 $170.3 $375.3 $515.6 $0.0 $100.0 $200.0 $300.0 $400.0 $500.0 $600.0 Q3 2010Q3 2011 YTD 2010 YTD 2011 Existing Businesses 10.4 % 14.0 % Acquisitions 11.3 % 17.5 % FX Translation 6.9 % 5.9 % Total Growth 28.6 % 37.4 % Revenue and Adjusted Operating Income (1) Refer to Appendix for Non - GAAP reconciliation. __________________ Note: Dollars in millions (unaudited). % Margin 11.8% 14.1% 10.5% 12.2%

Q3 2011 Earnings Call 6 Q3 2011 Sales and Orders by End Market General Industrial 35% Oil & Gas 20% Power Generation 12% Defense 8% Commercial Marine 25% Total Growth (Decline) Organic Growth (Decline) Commercial Marine 26 % 14 % Oil & Gas 89 % 18 % Power Generation (8)% (11)% Defense 3 % 2 % General Industrial 31 % 17 % Total 29 % 10 % General Industrial 32% Commercial Marine 24% Oil & Gas 19% Power Generation 15% Defense 10% Sales: $170.3 million Orders: $174.8 million Total Growth Organic Growth Commercial Marine 95 % 76 % Oil & Gas 40 % 20 % Power Generation 39 % 36 % Defense 27 % 25 % General Industrial 22 % 10 % Total 41 % 29 %

Q3 2011 Earnings Call 7 YTD 2011 Sales and Orders by End Market General Industrial 34% Oil & Gas 23% Power Generation 11% Defense 7% Commercial Marine 25% Total Growth Organic Growth (Decline) Commercial Marine 29 % 18 % Oil & Gas 156 % 30 % Power Generation 1 % (1)% Defense 2 % 1 % General Industrial 27 % 16 % Total 37 % 14 % General Industrial 34% Commercial Marine 24% Oil & Gas 23% Power Generation 12% Defense 7% Sales: $515.6 million Orders: $529.4 million Total Growth (Decline) Organic Growth (Decline) Commercial Marine 47 % 35 % Oil & Gas 92 % 14 % Power Generation 12 % 11 % Defense (30)% (30)% General Industrial 27 % 16 % Total 33 % 13 %

Q3 2011 Earnings Call 8 Oil & Gas Market Perspective Highlights and Outlook ▪ Rosscor very robust enabling entry into new accounts ▪ Strong quoting activity in the market ▪ Projects increasing in size Colfax YTD 2011 Sales Split 23% O&G Colfax YTD 2011 Orders Split 23% O&G Sales & Orders Growth Q3 2011 vs. Q3 2010 YTD 2011 vs. YTD 2010 Total Organic Total Organic Sales 89% 18% 156% 30% Orders 40% 20% 92% 14%
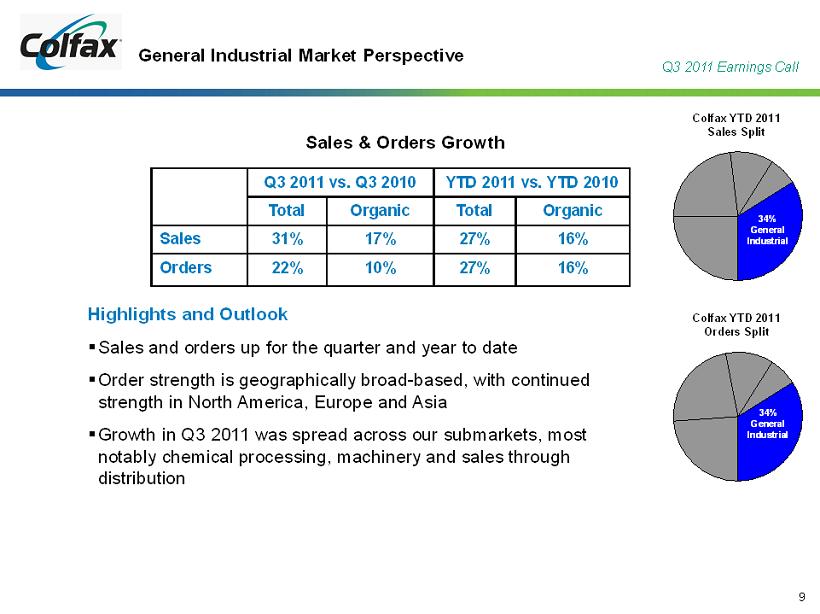
Q3 2011 Earnings Call 9 General Industrial Market Perspective Highlights and Outlook ▪ Sales and orders up for the quarter and year to date ▪ Order strength is geographically broad - based, with continued strength in North America, Europe and Asia ▪ Growth in Q3 2011 was spread across our submarkets, most notably chemical processing, machinery and sales through distribution Colfax YTD 2011 Sales Split Colfax YTD 2011 Orders Split 34% General Industrial 34% General Industrial Sales & Orders Growth Q3 2011 vs. Q3 2010 YTD 2011 vs. YTD 2010 Total Organic Total Organic Sales 31% 17% 27% 16% Orders 22% 10% 27% 16%

Q3 2011 Earnings Call 10 Power Generation Market Perspective Highlights and Outlook ▪ Sales decline due to decision to exit certain business in the Middle East ▪ Record orders for the quarter, including a large project in the Middle East, and growth in South America, the Middle East and Asia ▪ Large backlog of power infrastructure projects in emerging markets Colfax YTD 2011 Sales Split 11% Power Gen. Colfax YTD 2011 Orders Split 12% Power Gen. Sales & Orders Growth (Decline) Q3 2011 vs. Q3 2010 YTD 2011 vs. YTD 2010 Total Organic Total Organic Sales (8)% (11)% 1% (1)% Orders 39 % 36% 12% 11%

Q3 2011 Earnings Call 11 Defense Market Perspective Highlights and Outlook ▪ Sales and orders both increased during Q3 2011 ▪ Shipment and order activity continue to follow timing of specific ship programs (large orders are booked and delivered over multiple years) ▪ Two large orders booked this quarter: DDG 1000 program and another Virginia class submarine Colfax YTD 2011 Sales Split 7% Defense Colfax YTD 2011 Orders Split 7% Defense Sales & Orders Growth (Decline) Q3 2011 vs. Q3 2010 YTD 2011 vs. YTD 2010 Total Organic Total Organic Sales 3% 2% 2% 1% Orders 27% 25% (30)% (30)%

Q3 2011 Earnings Call 12 Commercial Marine Market Perspective Colfax YTD 2011 Sales Split 25% Comm. Marine Colfax YTD 2011 Orders Split 24% Comm. Marine Highlights and Outlook ▪ Sales and orders both increased during the quarter, orders for Q3 2010 were relatively weak ▪ Cancellations were $2 million in Q3 2011 vs. $4 million in Q3 2010; $5 million YTD 2011 vs. $10 million YTD 2010 ▪ End market performance continues to exceed our expectations Sales & Orders Growth Q3 2011 vs. Q3 2010 YTD 2011 vs. YTD 2010 Total Organic Total Organic Sales 26% 14% 29% 18% Orders 95% 76% 47% 35%

Q3 2011 Earnings Call 13 Charter Acquisition Rationale LAYS FOUNDATION FOR A LEADING MULTI - PLATFORM GLOBAL ENTERPRISE FINANCIALLY COMPELLING PROVIDES LONG - TERM VALUE CREATION OPPORTUNITIES ENHANCES BUSINESS PROFILE ACCELERATES GROWTH STRATEGY

Q3 2011 Earnings Call 14 Products & Applications: ESAB #2 global manufacturer of welding & cutting products; technology & innovation leader Developed Economies Emerging Markets 59% 41% GEOGRAPHIC EXPOSURE 1H 2011 LTM = £1.3b Foremarket Aftermarket 27% 73% AFTERMARKET REVENUES 1H 2011 LTM = £1.3b CONSUMABLES WELDING WELDING AUTOMATION PPE CUTTING GAS APPARATUS Source: Company filings

Q3 2011 Earnings Call 15 Products & Applications: Howden Leading global manufacturer of heavy - duty fans and compressors; energy, power and mining key drivers of revenue Foremarket Aftermarket AFTERMARKET REVENUES 1H 2011 LTM = £0.6b 60% 40% Developed Economies 50% Emerging Markets 50% GEOGRAPHIC EXPOSURE 1H 2011 LTM = £0.6b COOLING FAN PISTON COMPRESSOR CENTRIFUGAL FAN SCREW COMPRESSOR AXIAL FAN HEAT EXCHANGER Source: Company filings

Q3 2011 Earnings Call 16 Combined Strength: Enhances Business Profile Meaningful recurring revenue stream 1H 2011 LTM Pro - Forma = $3.5b Aftermarket 55% 45% Foremarket Considerable exposure to emerging markets 1H 2011 LTM Pro - Forma = $3.5b Emerging Markets 44% 56% Developed Markets Balance between short and long cycle businesses 1H 2011 LTM Pro - Forma = $3.5b 51% 49% Long Cycle Short Cycle Attractive business mix; strong secular growth drivers Source: Company filings

Q3 2011 Earnings Call 17 ▪ Strong balance sheet ▪ Debt of $75 million, principal payments of $10 million in 2011 ▪ Cash of $64 million ▪ $130 million available on revolver Strong Financial Condition

Q3 2011 Earnings Call 18 Refer to Appendix for Non - GAAP reconciliation and footnotes. __________________ Note: Dollars in millions. Income Statement Summary (Unaudited) Three Months Ended Change September 30, 2011 October 1, 2010 $ % Orders $ 174.8 $ 124.1 $ 50.7 40.9 % Sales $ 170.3 $ 132.4 $ 37.9 28.6 % Gross profit $ 60.7 $ 47.1 $ 13.6 28.9 % % of sales 35.6% 35.6% SG&A expense $ 41.0 $ 29.9 $ 11.1 37.1 % R&D expense 1.4 1.6 (0.2) -13% Operating expense $ 42.4 $ 31.5 $ 10.9 34.6 % % of sales 24.9% 23.8% Adjusted operating income $ 23.9 $ 15.6 $ 8.3 53.2 % % of sales 14.1% 11.8% Adjusted EBITDA $ 29.2 $ 19.5 $ 9.7 49.7 % % of sales 17.2% 14.7% Adjusted net income $ 16.3 $ 9.5 $ 6.8 71.6 % % of sales 9.6% 7.2% Adjusted net income per share $ 0.37 $ 0.22 $ 0.15 68.2 %

Q3 2011 Earnings Call 19 Refer to Appendix for Non - GAAP reconciliation and footnotes. __________________ Note: Dollars in millions. Income Statement Summary (Unaudited) Nine Months Ended Change September 30, 2011 October 1, 2010 $ % Orders $ 529.4 $ 399.2 $ 130.2 32.6 % Sales $ 515.6 $ 375.3 $ 140.3 37.4 % Gross profit $ 178.6 $ 131.8 $ 46.8 35.5 % % of sales 34.6% 35.1% SG&A expense $ 116.9 $ 87.8 $ 29.1 33.1 % R&D expense 4.5 4.7 (0.2) (4.3) Operating expense $ 121.4 $ 92.5 $ 28.9 31.2 % % of sales 23.5% 24.6% Adjusted operating income $ 62.8 $ 39.3 $ 23.5 59.8 % % of sales 12.2% 10.5% Adjusted EBITDA $ 80.2 $ 50.5 $ 29.7 58.8 % % of sales 15.6% 13.5% Adjusted net income $ 40.5 $ 23.3 $ 17.2 73.8 % % of sales 7.9% 6.2% Adjusted net income per share $ 0.91 $ 0.53 $ 0.38 71.7 %
Q3 2011 Earnings Call 20 Appendix

Q3 2011 Earnings Call 21 Colfax has provided financial information that has not been prepared in accordance with GAAP. These non - GAAP financial measures are adjusted net income, adjusted net income per share, adjusted operating income, earnings before interest, taxes depreciation and amortizati on (“EBITDA”), adjusted EBITDA, organic sales growth (decline) and organic order growth (decline). Adjusted net income, adjusted net income pe r share, adjusted operating income and adjusted EBITDA exclude asbestos liability and defense costs, asbestos coverage litigation expenses, res tru cturing and other related charges and, beginning in Q3 2011, charges related to the proposed Charter acquisition, to the extent they impact the pe riods presented. As we are currently anticipating a significant reduction in our 2011 adjusted - basis effective tax rate from 32% to 30.5%, the effec tive tax rates used to calculate adjusted net income and adjusted net income per share present income taxes are 30.5% and 28.2% for the year to date an d Q3 periods of 2011, respectively, in comparison to 32% for both the year to date and Q3 periods of 2010. Organic sales growth (decline) and or ganic order growth (decline) exclude the impact of acquisitions and foreign exchange rate fluctuations. These non - GAAP financial measures assist C olfax in comparing its operating performance on a consistent basis because, among other things, they remove the impact of legacy asbestos issues , C harter acquisition - related charges and items outside the control of its operating management team. Sales and order information by end market are estimates. We periodically update our customer groupings in order to refine th es e estimates. Disclaimer

Q3 2011 Earnings Call 22 ____________________ Note: Dollars in thousands. Non - GAAP Reconciliation (unaudited) September 30, 2011 October 1, 2010 September 30, 2011 October 1, 2010 EBITDA Net income 3,690$ 5,851$ 20,635$ 7,565$ Interest expense 1,218 1,544 4,507 5,075 Provision for income taxes 532 1,210 8,337 2,177 Depreciation and amortization 5,306 3,932 17,426 11,242 EBITDA 10,746$ 12,537$ 50,905$ 26,059$ EBITDA margin 6.3% 9.5% 9.9% 6.9% Adjusted EBITDA Net income 3,690$ 5,851$ 20,635$ 7,565$ Interest expense 1,218 1,544 4,507 5,075 Provision for income taxes 532 1,210 8,337 2,177 Depreciation and amortization 5,306 3,932 17,426 11,242 Charter acquisition-related costs 5,728 - 5,728 - Restructuring and other related charges 5,299 2,441 7,518 9,515 Asbestos liability and defense costs 4,391 2,202 7,644 4,179 Asbestos coverage litigation expenses 3,086 2,339 8,454 10,763 Adjusted EBITDA 29,250$ 19,519$ 80,249$ 50,516$ Adjusted EBITDA margin 17.2% 14.7% 15.6% 13.5% Three Months Ended Nine Months Ended

Q3 2011 Earnings Call 23 ____________________ Note: Dollars in thousands, except share data. Non - GAAP Reconciliation (unaudited) (1) As we are currently anticipating a significant reduction in our 2011 adjusted - basis effective tax rate from 32% to 30.5%, the ef fective tax rates used to calculate adjusted net income and adjusted net income per share present income taxes are 30.5% and 28.2% for the year to date an d Q3 periods of 2011, respectively, in comparison to 32% for both the year to date and Q3 periods of 2010. September 30, 2011 October 1, 2010 September 30, 2011 October 1, 2010 Adjusted Net Income and Adjusted Earnings per Share Net income 3,690$ 5,851$ 20,635$ 7,565$ Charter acquisition-related costs 5,728 - 5,728 - Restructuring and other related charges 5,299 2,441 7,518 9,515 Asbestos liability and defense costs 4,391 2,202 7,644 4,179 Asbestos coverage litigation expenses 3,086 2,339 8,454 10,763 Tax adjustment to effective rate (1) (5,865) (3,284) (9,449) (8,767) Adjusted net income 16,329$ 9,549$ 40,530$ 23,255$ Adjusted net income margin 9.6% 7.2% 7.9% 6.2% Weighted average shares outstanding - diluted 44,411,970 43,619,252 44,299,157 43,539,372 Adjusted net income per share 0.37$ 0.22$ 0.91$ 0.53$ Net income per share—diluted in accordance with GAAP 0.08$ 0.13$ 0.47$ 0.17$ Adjusted Operating Income Operating income 5,440$ 8,605$ 33,479$ 14,817$ Charter acquisition-related costs 5,728 - 5,728 - Restructuring and other related charges 5,299 2,441 7,518 9,515 Asbestos liability and defense costs 4,391 2,202 7,644 4,179 Asbestos coverage litigation expenses 3,086 2,339 8,454 10,763 Adjusted operating income 23,944$ 15,587$ 62,823$ 39,274$ Adjusted operating income margin 14.1% 11.8% 12.2% 10.5% Three Months Ended Nine Months Ended

Q3 2011 Earnings Call 24 ____________________ Note: Dollars in millions. Sales & Order Growth - (unaudited) $ % $ % $ % Nine months ended October 1, 2010 375.3$ 399.2$ 351.2$ Components of Change: Existing Businesses 52.6 14.0 % 53.2 13.3 % (17.3) (4.9)% Acquisitions 65.7 17.5 % 55.1 13.8 % 40.6 11.5 % Foreign Currency Translation 22.0 5.9 % 21.9 5.5 % (1.1) (0.3)% Total 140.3 37.4 % 130.2 32.6 % 22.2 6.3 % Nine months ended September 30, 2011 515.6$ 529.4$ 373.4$ $ % $ % Three months ended October 1, 2010 132.4$ 124.1$ Components of Change: Existing Businesses 13.8 10.4 % 35.7 28.8 % Acquisitions 14.9 11.3 % 6.0 4.8 % Foreign Currency Translation 9.2 6.9 % 9.0 7.3 % Total 37.9 28.6 % 50.7 40.9 % Three months ended September 30, 2011 170.3$ 174.8$ Sales Orders Sales Backlog at Period EndOrders