Attached files
| file | filename |
|---|---|
| 8-K - FORM 8-K - TrueBlue, Inc. | tbiq38k2011.htm |
| EX-99.1 - PRESS RELEASE OF THE COMPANY DATED OCTOBER 26, 2011 - TrueBlue, Inc. | tbiq38k2011ex991.htm |
q3investorpresentation

Q-3 2011Results
Cautionary Note About Forward-Looking Statements: 2 This document contains “forward-looking statements” within the meaning of the Private Securities Litigation Reform Act of 1995. Words such as “may,” “will,” “should,” “expects,” “intends,” “projects,” “plans,” “believes,” “estimates,” “targets,” “anticipates,” and similar expressions are used to identify these forward-looking statements. Examples of forward-looking statements include statements relating to our future financial condition and operating results, as well as any other statement that does not directly relate to any historical or current fact. Forward-looking statements are based on our current expectations and assumptions, which may not prove to be accurate. These statements are not guarantees and are subject to risks, uncertainties, and changes in circumstances that are difficult to predict. Many factors could cause actual results to differ materially and adversely from these forward-looking statements. Examples of such factors can be found in our reports filed with the SEC, including the information under the heading „Risk Factors‟ in our Annual Report on Form 10-K for the year ended Dec. 31, 2010. Any forward-looking statement speaks only as of the date on which it is made, and we assume no obligation to update or revise any forward-looking statement, whether as a result of new information, future events, or otherwise, except as required by law.
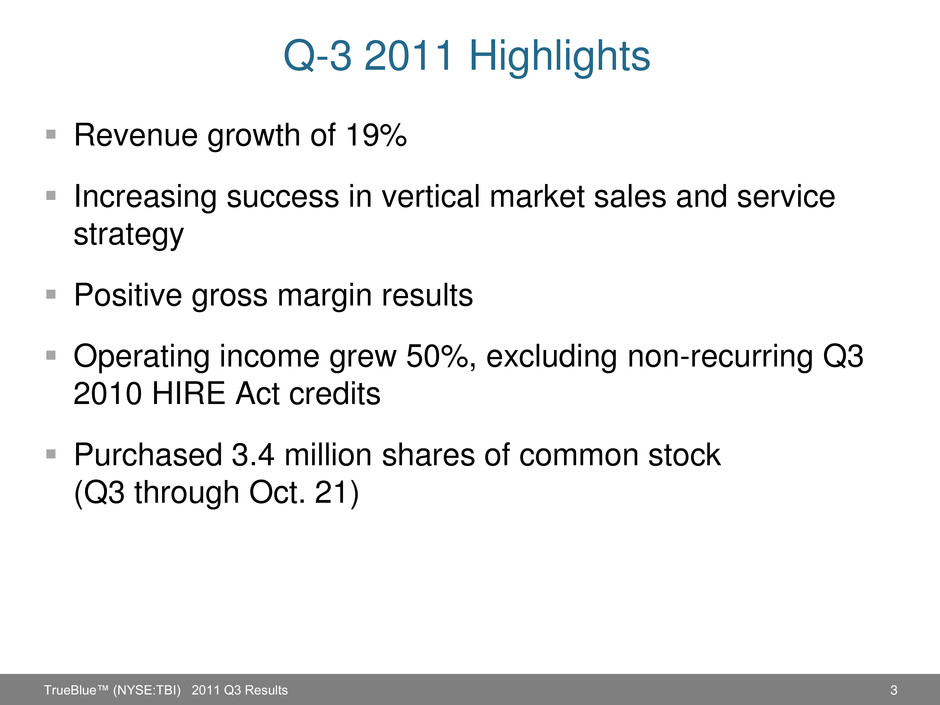
3 Q-3 2011 Highlights Revenue growth of 19% Increasing success in vertical market sales and service strategy Positive gross margin results Operating income grew 50%, excluding non-recurring Q3 2010 HIRE Act credits Purchased 3.4 million shares of common stock (Q3 through Oct. 21) TrueBlue™ (NYSE:TBI) 2011 Q3 Results
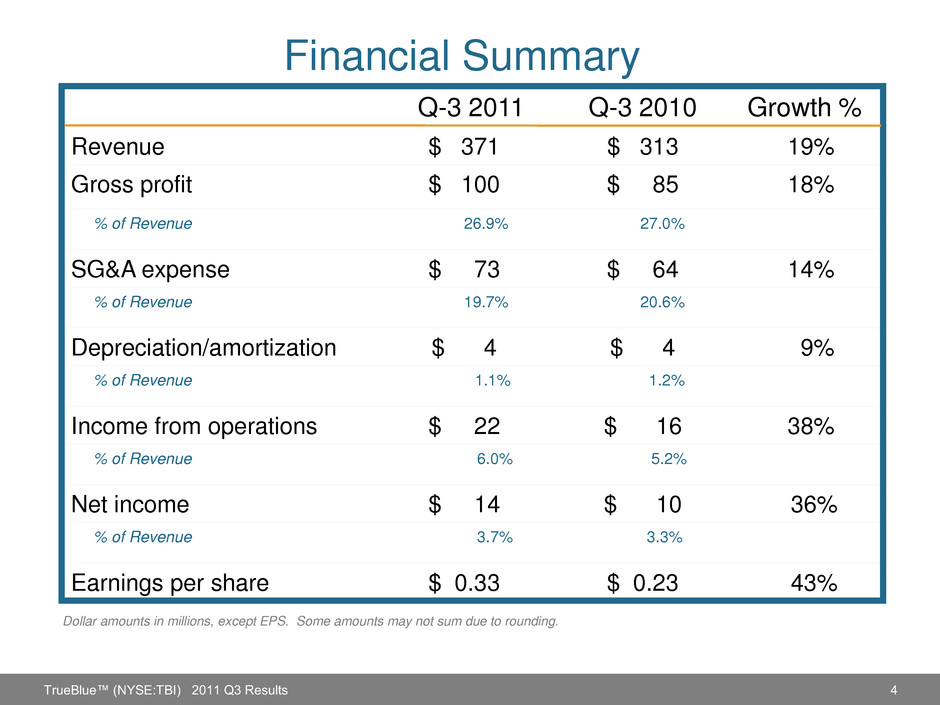
4 Financial Summary Q-3 2011 Q-3 2010 Growth % Revenue $ 371 $ 313 19% Gross profit $ 100 $ 85 18% % of Revenue 26.9% 27.0% SG&A expense $ 73 $ 64 14% % of Revenue 19.7% 20.6% Depreciation/amortization $ 4 $ 4 9% % of Revenue 1.1% 1.2% Income from operations $ 22 $ 16 38% % of Revenue 6.0% 5.2% Net income $ 14 $ 10 36% % of Revenue 3.7% 3.3% Earnings per share $ 0.33 $ 0.23 43% TrueBlue™ (NYSE:TBI) 2011 Q3 Results Dollar amounts in millions, except EPS. Some amounts may not sum due to rounding.
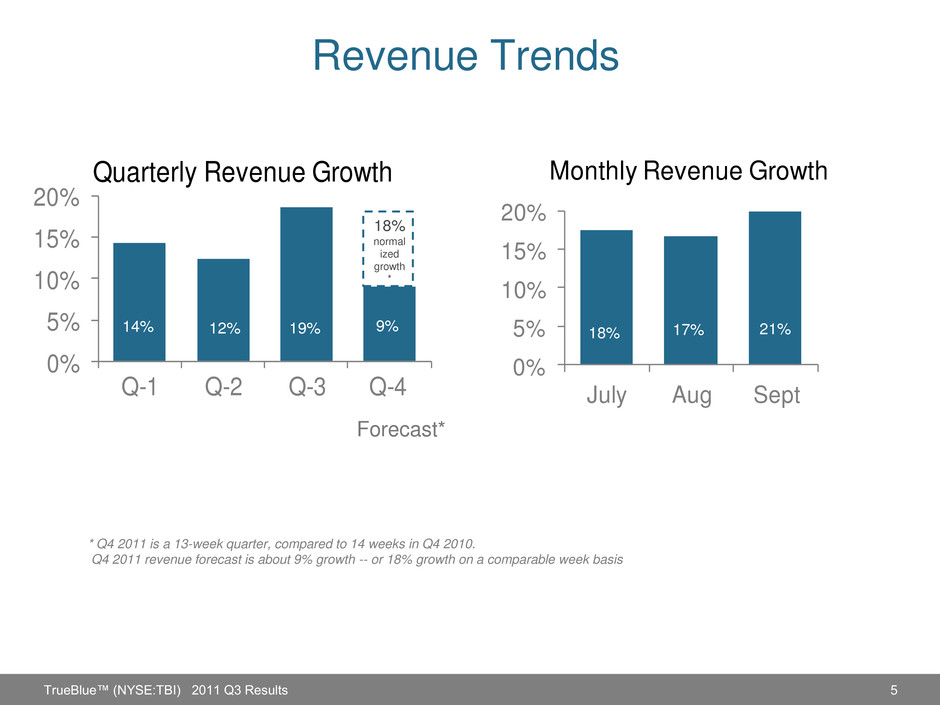
Revenue Trends 0% 5% 10% 15% 20% July Aug Sept Monthly Revenue Growth 0% 5% 10% 15% 20% Q-1 Q-2 Q-3 Q-4 Quarterly Revenue Growth TrueBlue™ (NYSE:TBI) 2011 Q3 Results 12% 21% 17% 18% 5 14% 19% 9% Forecast* 18% normal ized growth * * Q4 2011 is a 13-week quarter, compared to 14 weeks in Q4 2010. Q4 2011 revenue forecast is about 9% growth -- or 18% growth on a comparable week basis
6 Vertical Market Strategy Dedicated sales leaders with expertise in the specific industries we serve Specialized national sales and service teams deliver tailored solutions to our national customers Industry selling and service Best Practices used by branch staff to serve local customers better Strong customer relationships and loyalty from the local to national level TrueBlue™ (NYSE:TBI) 2011 Q3 Results
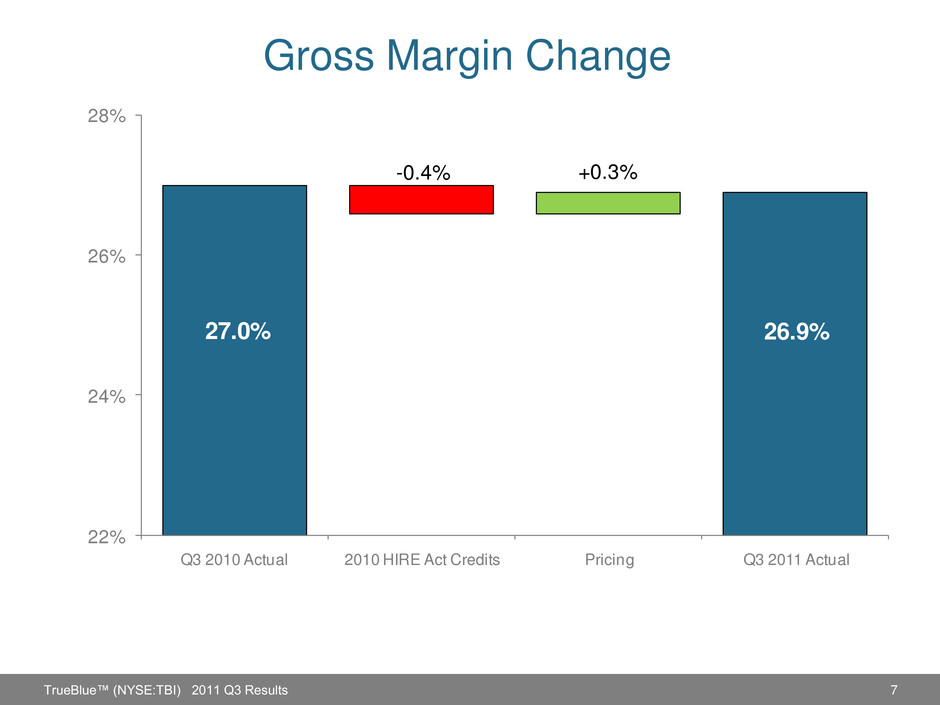
7 Gross Margin Change TrueBlue™ (NYSE:TBI) 2011 Q3 Results 22% 24% 26% 28% Q3 2010 Actual 2010 HIRE Act Credits Pricing Q3 2011 Actual 27.0% 26.9% +0.3%-0.4%
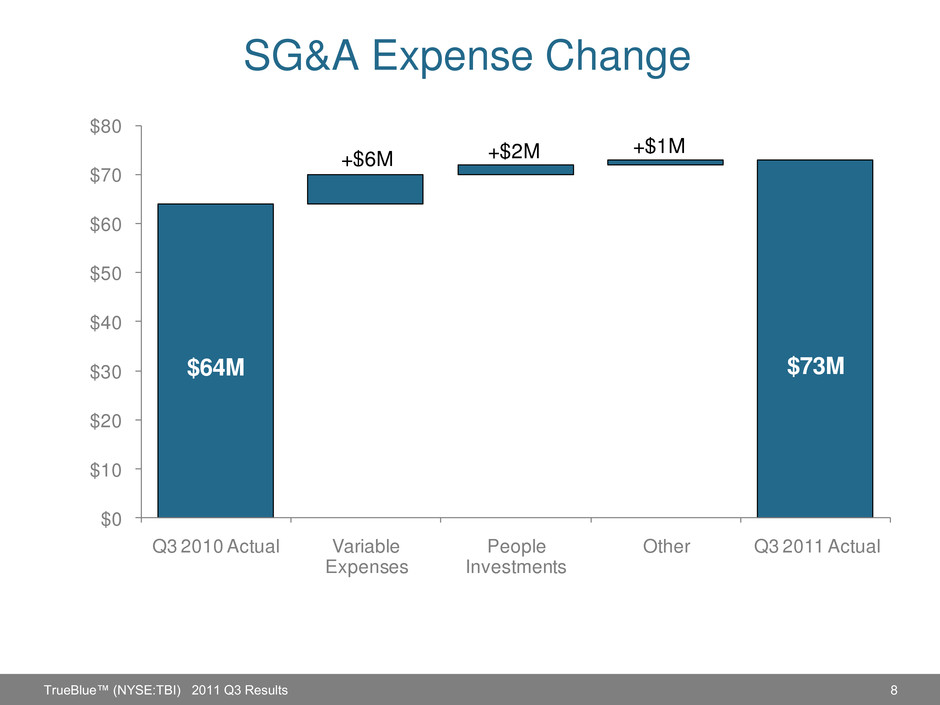
8 SG&A Expense Change TrueBlue™ (NYSE:TBI) 2011 Q3 Results $0 $10 $20 $30 $40 $50 $60 $70 $80 Q3 2010 Actual Variable Expenses People Investments Other Q3 2011 Actual +$6M $64M +$2M +$1M $73M
9 Closing Comments Expect strong revenue growth in Q4 13-week Q4 2011 revenue forecast is 9% growth, compared to 14-week Q4 2010—18% revenue growth on a comparable week basis Continued focus on strengthening vertical market capabilities Balanced approach to revenue growth and expense control TrueBlue™ (NYSE:TBI) 2011 Q3 Results
