Attached files
| file | filename |
|---|---|
| 8-K - FORM 8-K - EXELON GENERATION CO LLC | d246710d8k.htm |
| EX-99.1 - PRESS RELEASE AND EARNINGS RELEASE ATTACHMENTS - EXELON GENERATION CO LLC | d246710dex991.htm |
 Earnings Conference Call
3
rd
Quarter 2011
October 26, 2011
Exhibit 99.2 |
 Cautionary Statements Regarding
Forward-Looking Information
2
Except for the historical information contained herein, certain of the matters discussed in this
communication constitute “forward-looking statements” within the meaning of the
Securities Act of 1933 and the Securities Exchange Act of 1934, both as amended by the Private
Securities Litigation Reform Act of 1995. Words such as “may,” “will,”
“anticipate,” “estimate,” “expect,” “project,” “intend,” “plan,”
“believe,” “target,” “forecast,” and words and terms of similar
substance used in connection with any discussion of future plans, actions, or events identify
forward-looking statements. These forward-looking statements include, but are not limited to, statements regarding
benefits of the proposed merger of Exelon Corporation (Exelon) and Constellation Energy Group, Inc.
(Constellation), integration plans and expected synergies, the expected timing of completion of
the transaction, anticipated future financial and operating performance and results, including
estimates for growth. These statements are based on the current expectations of management of Exelon and
Constellation, as applicable. There are a number of risks and uncertainties that could cause actual
results to differ materially from the forward-looking statements included in this
communication regarding the proposed merger. For example, (1) the companies may be unable to
obtain shareholder approvals required for the merger; (2) the companies may be unable to obtain regulatory approvals
required for the merger, or required regulatory approvals may delay the merger or result in the
imposition of conditions that could have a material adverse effect on the combined company or
cause the companies to abandon the merger; (3) conditions to the closing of the merger may not
be satisfied; (4) an unsolicited offer of another company to acquire assets or capital stock of Exelon or Constellation
could interfere with the merger; (5) problems may arise in successfully integrating the businesses of
the companies, which may result in the combined company not operating as effectively and
efficiently as expected; (6) the combined company may be unable to achieve cost-cutting
synergies or it may take longer than expected to achieve those synergies; (7) the merger may involve unexpected costs,
unexpected liabilities or unexpected delays, or the effects of purchase accounting may be different
from the companies’ expectations; (8) the credit ratings of the combined company or its
subsidiaries may be different from what the companies expect; (9) the businesses of the
companies may suffer as a result of uncertainty surrounding the merger; (10) the companies may not realize the values expected
to be obtained for properties expected or required to be divested; (11) the industry may be subject to
future regulatory or legislative actions that could adversely affect the companies; and (12)
the companies may be adversely affected by other economic, business, and/or competitive
factors. Other unknown or unpredictable factors could also have material adverse effects on future results,
performance or achievements of Exelon, Constellation or the combined company. |
 3
Cautionary Statements Regarding
Forward-Looking Information (Continued)
Discussions of some of these other important factors and assumptions are contained in Exelon’s
and Constellation’s respective filings with the Securities and Exchange Commission (SEC),
and available at the SEC’s website at www.sec.gov, including: (1) Exelon’s 2010
Annual Report on Form 10-K in (a) ITEM 1A. Risk Factors, (b) ITEM 7. Management’s Discussion and Analysis of
Financial Condition and Results of Operations and (c) ITEM 8. Financial Statements and Supplementary
Data: Note 18; (2) Exelon’s Quarterly Report on Form 10-Q for the quarterly
period ended September 30, 2011 (to be filed on October 26, 2011) in (a) Part II, Other
Information, ITEM 1A. Risk Factors, (b) Part 1, Financial Information, ITEM 2. Management’s Discussion and Analysis of
Financial Condition and Results of Operations and (c) Part I, Financial Information, ITEM 1. Financial
Statements: Note 13; (3) Constellation’s 2010 Annual Report on Form 10-K in (a)
ITEM 1A. Risk Factors, (b) ITEM 7. Management’s Discussion and Analysis of Financial
Condition and Results of Operations and (c) ITEM 8. Financial Statements and Supplementary Data: Note 12;
and (4) Constellation’s Quarterly Report on Form 10-Q for the quarterly period ended June 30,
2011 in (a) Part II, Other Information, ITEM 1A. Risk Factors and ITEM 5. Other Information,
(b) Part I, Financial Information, ITEM 2. Management’s Discussion and Analysis of
Financial Condition and Results of Operations and (c) Part I, Financial Information, ITEM 1. Financial Statements: Notes
to Consolidated Financial Statements, Commitments and Contingencies. These risks, as well as other
risks associated with the proposed merger, are more fully discussed in the definitive joint
proxy statement/prospectus included in the Registration Statement on Form S-4 that Exelon
filed with the SEC and that the SEC declared effective on October 11, 2011 in connection with the proposed
merger. In light of these risks, uncertainties, assumptions and factors, the forward-looking
events discussed in this communication may not occur. Readers are cautioned not to place undue
reliance on these forward-looking statements, which speak only as of the date of this
communication. Neither Exelon nor Constellation undertake any obligation to publicly release any revision to its forward-
looking statements to reflect events or circumstances after the date of this communication.
In connection with the proposed merger between Exelon and Constellation, Exelon filed with the
SEC a Registration Statement on Form S-4 that included the definitive joint proxy
statement/prospectus. The Registration Statement was declared effective by the SEC on October
11, 2011. Exelon and Constellation mailed the definitive joint proxy statement/prospectus to their respective security
holders on or about October 12, 2011. WE URGE INVESTORS AND SECURITY HOLDERS TO READ THE DEFINITIVE
JOINT PROXY STATEMENT/PROSPECTUS AND ANY OTHER RELEVANT DOCUMENTS FILED WITH THE SEC, BECAUSE
THEY CONTAIN IMPORTANT INFORMATION about Exelon, Constellation and the proposed merger.
Investors and security holders may obtain copies of all documents filed with the SEC free of
charge at the SEC's website, www.sec.gov. In addition, a copy of the definitive joint proxy
statement/prospectus may be obtained free of charge from Exelon Corporation, Investor Relations, 10 South
Dearborn Street, P.O. Box 805398, Chicago, Illinois 60680-5398, or from Constellation Energy
Group, Inc., Investor Relations, 100 Constellation Way, Suite 600C, Baltimore, MD 21202.
Additional Information and Where to Find it |
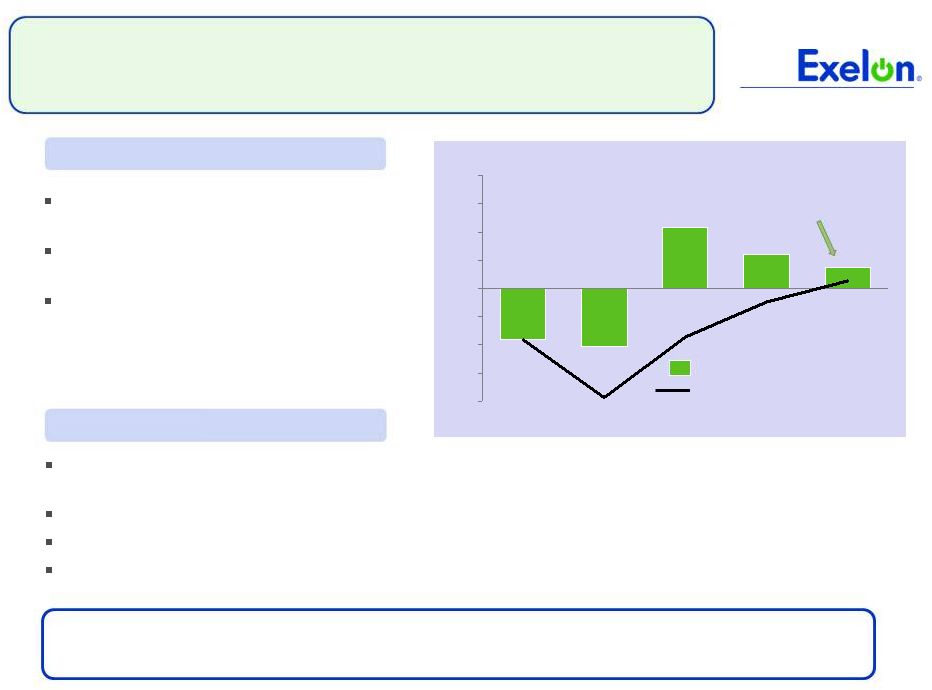
 4
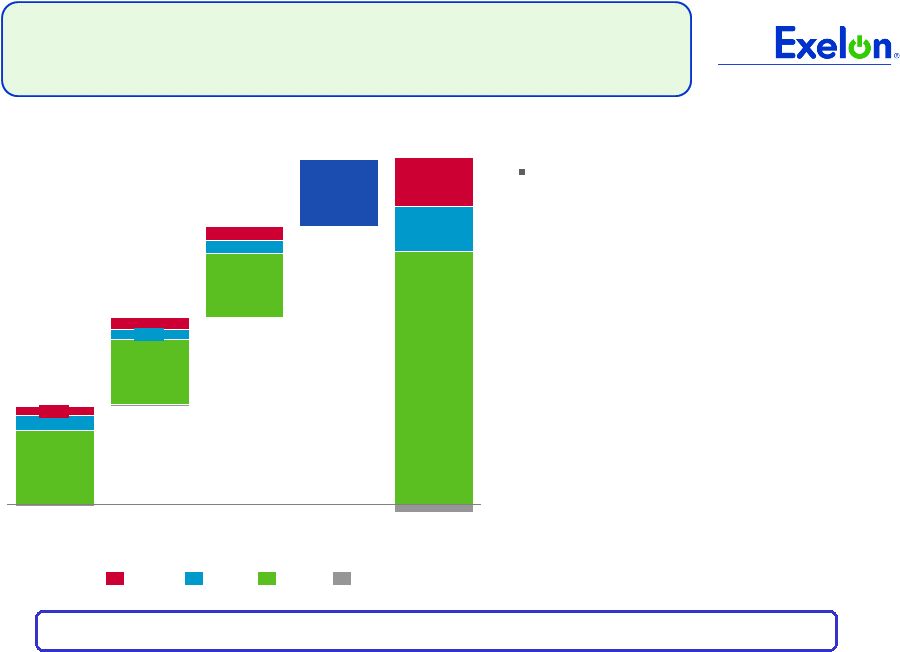
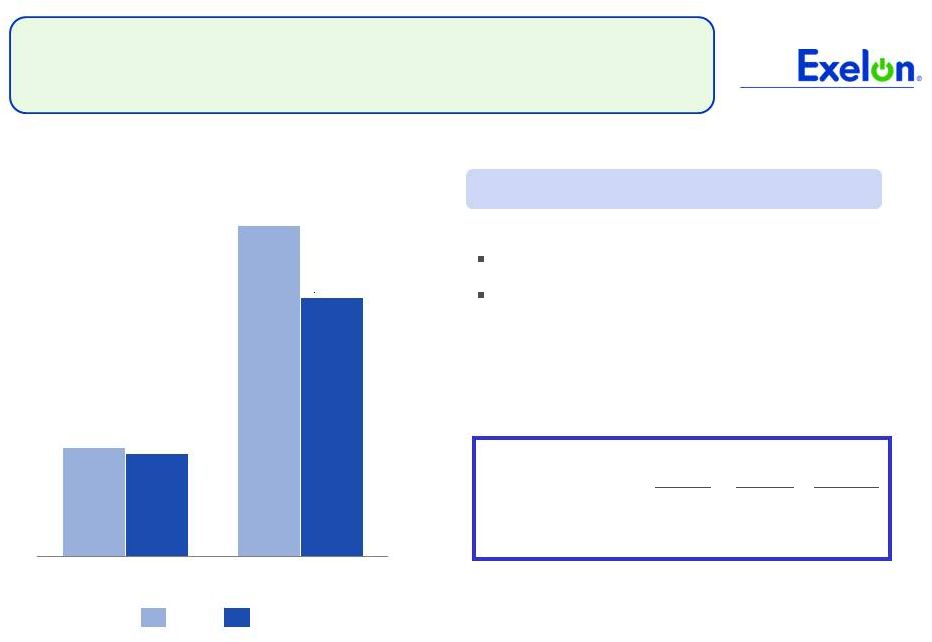
2011 Operating Earnings Guidance
3Q 2011 operating earnings of
$1.12 per share
•
Exceeded guidance range of $1.00 -
$1.10 per share for the quarter
•
Continued operational excellence at
Exelon Nuclear with a 95.8%
capacity factor
•
Texas contributed $0.10 per share to
third quarter earnings
•
$(0.08) per share of incremental
storm costs at ComEd and PECO
compared to 3Q 2010
Reaffirming
operating
earnings
guidance
for
2011
of
$4.05
-
$4.25/share
(1)
$4.05 -
$4.25
$2.95 -
$3.10
$0.55 -
$0.65
$0.50 -
$0.60
$1.12
$0.79
$0.16
$0.17
$1.05
$0.79
$0.13
$0.15
$1.17
$0.90
$0.19
$0.11
HoldCo
ExGen
PECO
ComEd
Q1
Actual
Q2
Actual
Q3
Actual
Q4
2011
Guidance
(1)
(1)
Refer to Earnings Release Attachments for additional details and to the Appendix for a reconciliation
of adjusted (non-GAAP) operating EPS to GAAP EPS.
(2)
Earnings guidance for OpCos may not add up to consolidated EPS guidance. |
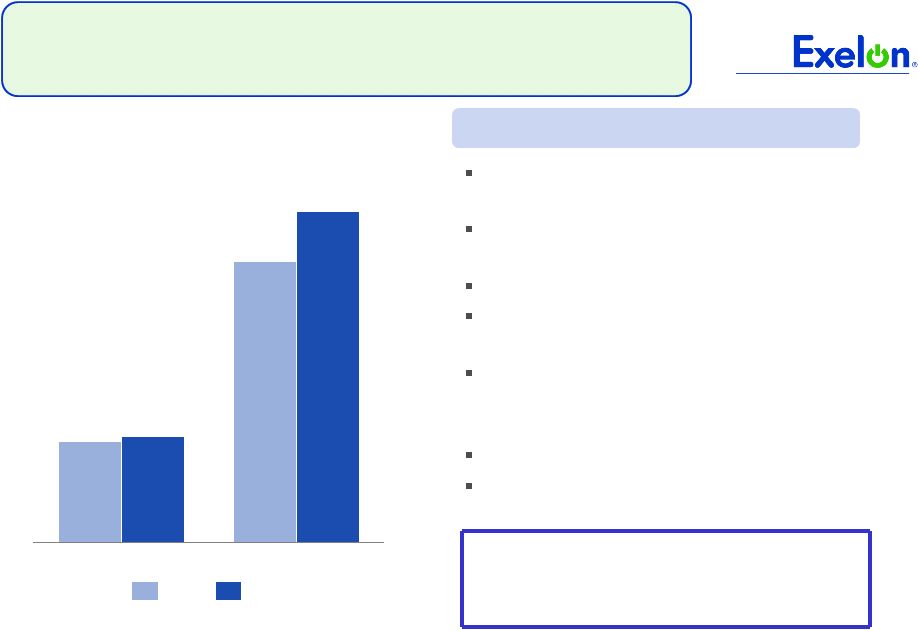
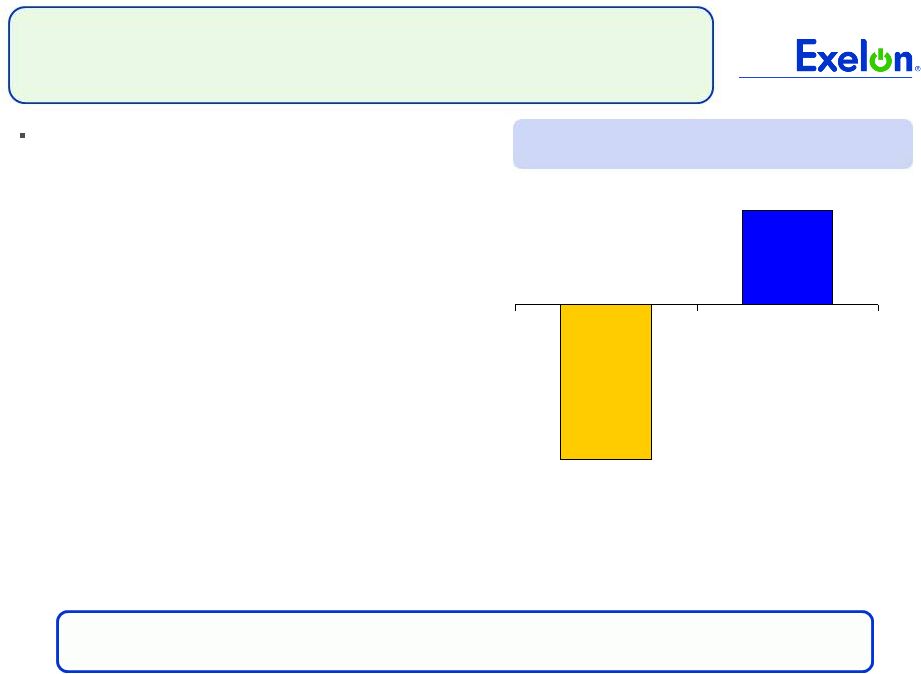
  5
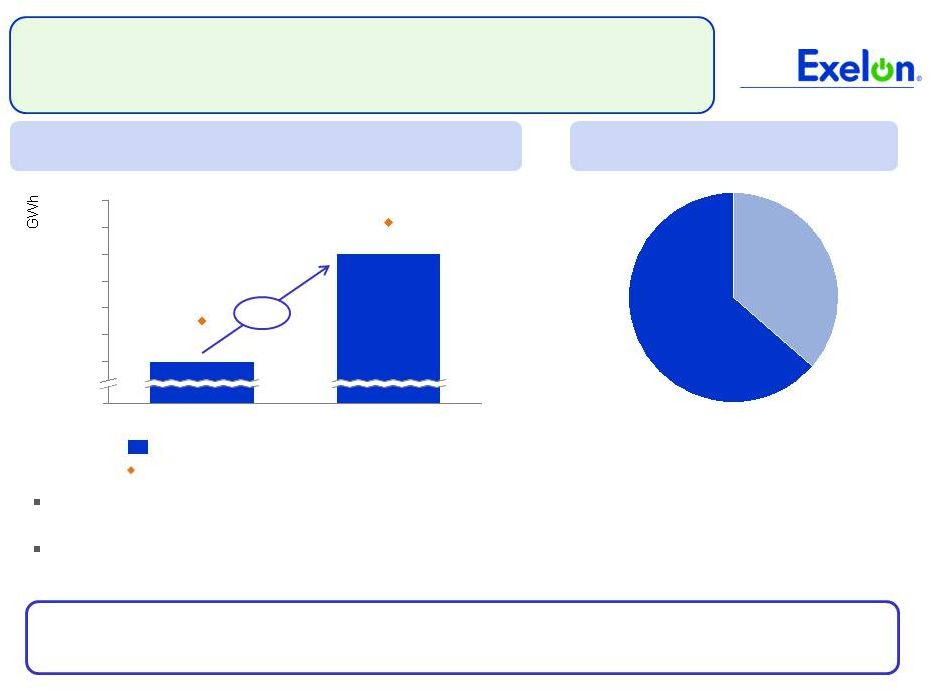
Exelon Texas Performance in Q3
(1)
Includes ERCOT generation from LaPorte, Wolf Hollow, Frontier, Handley and Mountain
Creek. PPAs or tolls sold by Exelon are excluded from both generation and capacity.
Intermediate
2,210
Peaking
1,262
ERCOT fossil capacity ~ 3,472 MW
Our Texas generation assets are well positioned from a location and dispatch
standpoint to take advantage of price volatility
Exelon’s portfolio management approach in Texas utilized a mix of forward and
spot sales based on its market views to capture value
2,000
0
2,600
2,500
2,400
2,300
2,200
2,100
Q3 2011
$107
2,403
Q3 2010
$49
ERCOT North Real Time On Peak Average ($/MWh)
Exelon ERCOT Total Generation
Exelon’s exceptional financial performance in Texas is a result of increased
generation and our ability to capture value through the hedging program
ERCOT Generation and On Peak Power Prices
Q3
2011
vs.
Q3
2010
(1)
ERCOT Fossil Generation Capacity
by Type (MW)
(1)
1,998
+20% |
 6
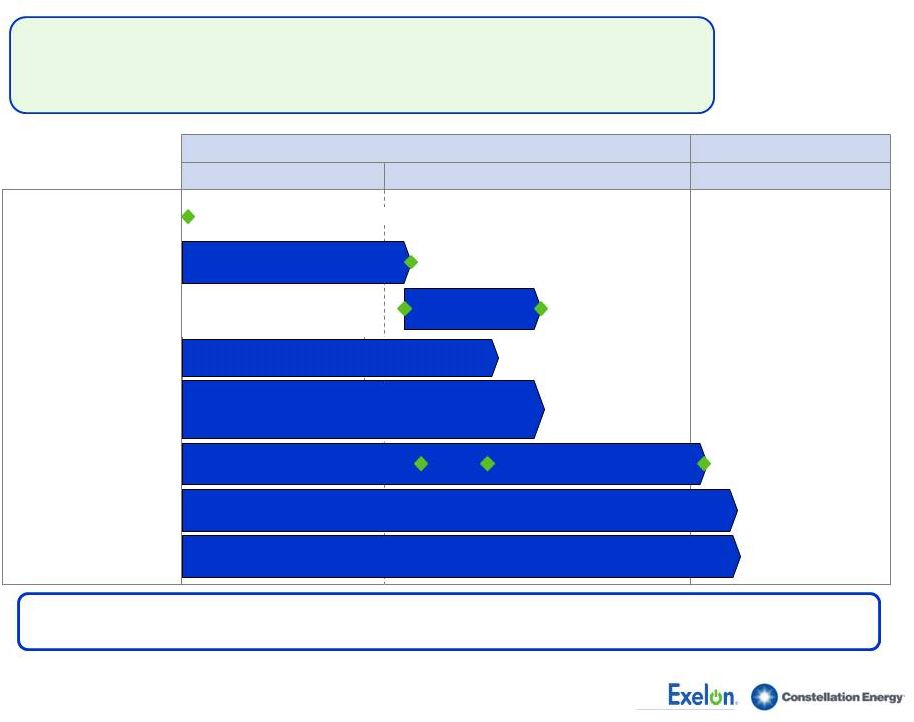
On Track for Merger Close in Early 2012
New York PSC
FERC
January 5, 2012
Statutory deadline
Shareholder vote
Shareholder vote
November 17, 2011
Maryland PSC
SEC
NRC
Texas PUC
Secured approval from Texas PUC on August 3, 2011
DOJ
Approvals
Record Date
October 7, 2011
Joint proxy statement declared effective
October 11, 2011
Rebuttal testimony filed
October 12, 2011
Evidentiary hearings begin
October 31, 2011
FERC order expected by
November 16, 2011
Filed merger approval application related filings on
May 20, 2011. Settlement agreement filed with PJM
Market Monitor on October 11, 2011
Filed for indirect transfer of Constellation Energy licenses on May 12, 2011
Submitted HSR filing on May 31, 2011 for review under U.S. antitrust laws and
certified compliance with second request
Q4
Q3
Q1
2012
2011
Regulatory proceedings are progressing as planned and we are on
track to
close in early 2012
Expect decision in Q4 2011
Note : On September 26
2011, the Department of Public Utilities in Massachusetts concluded that it does
not have jurisdiction over the proposed transaction between Exelon and
Constellation. th |
 -400
-300
-200
-100
0
100
200
300
400
2015E
2014E
2013E
2012E
2011E
7
Antelope Valley Solar Ranch One (AVSR 1)
(1) Based on alternating current (AC).
Net Equity Cash Flows
($ millions)
Equity Payback
Cumulative Equity Cash Flows
Annual Equity Cash Flows
230-MW
(1)
solar
photovoltaic
(PV) facility
in Los Angeles County
First portion of plant to come on line in
October 2012; fully operational in 2013
25-year PPA with Pacific Gas & Electric
ensures certainty in cash flows
Summary
Financials
This investment diversifies ExGen’s portfolio by expanding to a new market,
securing
stable
cash
flows
and
increasing
renewable
energy
under
our
control
All-in cost of up to $1.36B; up to $646M of a non-recourse loan guaranteed
by U.S. Department of Energy’s Loan Programs Office
Exelon
to
invest
up
to
$713M
through
2013
–
funded
with
cash
and
short-term
debt
Free cash flow accretive beginning in 2013; EBITDA run-rate of ~$75M per year
once fully operational Expect to recover investment by 2015, largely driven
by investment tax credits and other lax benefits |
 EPA
Regulations Will Move Forward Despite Delay Attempts
8
Proposed Rule issued in March 2011
•
Rule provides regulatory certainty to
industry
•
Stakeholder comments provided to EPA in
August 2011
Final Rule expected in December 2011
Compliance starting in late 2014/early 2015
Final Rule issued in July 2011
•
Rule provides template for future NOx
and SO2 reductions
Modest changes proposed in October 2011
•
Some state emission budgets modified
•
Assurance provision moved to 2014
Compliance start remains January 2012
Impact in PJM
~10 GW
Coal Retirements
Announced to date
~15 GW
EXC Estimate of
Coal Retirements
Cost of environmental upgrades and higher net
ACRs influenced supplier bidding behavior in the
PY 2014-2015 auction
~1,800 MW reduction in offered coal capacity vs.
prior year auction
~7,000 MW reduction in cleared coal capacity vs.
prior year auction
(2)
(1) Includes retirements announced by Duke, that will be part of
PJM starting in 2012.
(2) Expected coal retirements through 2015.
(1)
Air Toxics Rule
Cross-State Air Pollution Rule
PJM May 2011 RPM Auction
PJM Retirements
EPA and the industry are moving forward with implementation of forthcoming
environmental regulations |
 9
(1) Refer to the Earnings Release Attachments for additional details and to the
Appendix for a reconciliation of adjusted (non-GAAP) operating EPS to GAAP EPS.
(2) Outage days exclude Salem.
Note: PPA = Power Purchase Agreement; T&D = Transmission and Distribution
$2.10
$0.75
$2.47
$0.79
YTD
3Q
2011
2010
Outage Days
(2)
3Q10
3Q11
Refueling
19
33
Non-refueling
19
3
Higher margins due to expiration of the
PECO PPA: $0.27
Favorable market/portfolio conditions in the
South: $0.10
Unfavorable capacity pricing: $(0.14)
Higher O&M costs, including planned
nuclear refueling outages: $(0.08)
Higher income tax due to reduced
manufacturing deduction as a result of T&D
repairs: $(0.04)
Higher nuclear fuel costs: $(0.02)
Higher depreciation expense: $(0.02)
Key Drivers –
3Q11 vs. 3Q10
(1)
Exelon Generation
Operating EPS Contribution |
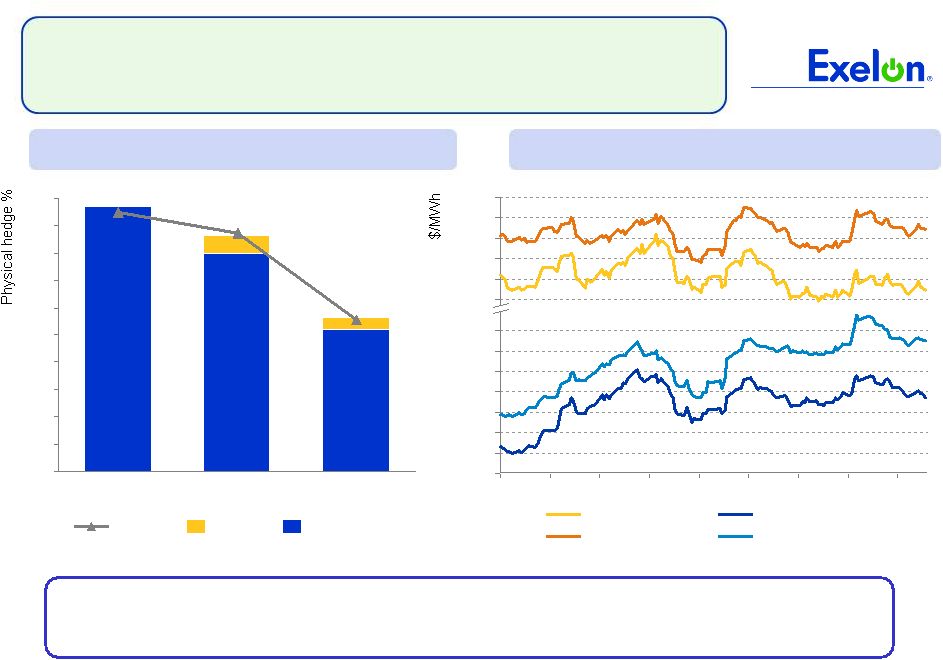 10
Exelon Generation Hedging Program
Exelon
continued
to
make
sales
during
Q3
to
capture
higher
power
prices
driven
by expanding heat rates and environmental rules
$50.00
$49.00
$48.00
$47.00
$46.00
$45.00
$37.00
$36.00
$32.00
$34.00
$33.00
$35.00
$31.00
$30.00
9/18
8/28
8/7
7/17
6/26
6/5
5/15
4/24
4/1
0%
10%
20%
30%
40%
50%
60%
70%
80%
90%
100%
2013
2012
2011
NI Hub ATC 2013
NI Hub ATC 2012
West Hub ATC 2013
West Hub ATC 2012
Underlying
Options
Ratable
98%
86%
57%
Physical Hedge %
PJM West Hub & NI Hub ATC Prices |
 11
ComEd Operating EPS Contribution
(1) Refer to the Earnings Release Attachments for additional details and to the
Appendix for a reconciliation of adjusted (non-GAAP) operating EPS to GAAP EPS.
3Q10
Actual
Actual
Normal
Heating Degree-Days
70 147 110
Cooling Degree-Days
854 785 624
3Q11
Increased storm costs: $(0.06)
Electric distribution rates: $0.04
Key Drivers –
3Q11 vs. 3Q10
(1)
YTD
3Q
2011
2010
$0.55
$0.18
$0.43
$0.17 |
 12
(1) Refer to the Earnings Release Attachments for additional details and to the
Appendix for a reconciliation of adjusted (non-GAAP) operating EPS to GAAP EPS.
Note: CTC = Competitive Transition Charge; T&D = Transmission and
Distribution $0.51
$0.19
$0.47
$0.16
YTD
3Q
2010
2011
3Q10
Actual Actual Normal
Heating
Degree-Days 0 18
36 Cooling Degree-Days
1,212 1,109 939
3Q11
2010 CTC collections, net of amortization
expense: $(0.08)
Increased storm costs: $(0.02)
Electric and gas distribution rates: $0.03
Lower income tax due to T&D tax repairs
deduction: $0.04
PECO Operating EPS Contribution
Key Drivers –
3Q11 vs. 3Q10
(1) |
  2011
Projected Sources and Uses of Cash (1)
Excludes counterparty collateral activity.
(2)
Cash Flow from Operations primarily includes net cash flows provided by operating
activities and net cash flows used in investing activities other than capital expenditures.
(3)
Assumes 2011 dividend of $2.10/share. Dividends are subject to declaration by the
Board of Directors. (4)
Includes $375 million in Nuclear Uprates, $250 million for Exelon Wind spend and
$200 million for Solar / Antelope Valley Solar Ranch One. (5)
Represents new business, smart grid/smart meter investment and transmission growth
projects. (6)
Excludes PECO’s $225 million Accounts Receivable (A/R) Agreement with Bank of
Tokyo. PECO’s A/R Agreement was extended in accordance with its terms through August 31, 2012.
(7)
“Other”
includes proceeds from options and expected changes in short-term debt.
(8) Includes cash flow activity from Holding Company, eliminations, and
other corporate entities. ($ millions)
Exelon
(8)
Beginning Cash Balance
(1)
$800
Cash Flow from Operations
(2)
800
725
3,450
4,850
CapEx (excluding Nuclear Fuel, Nuclear Uprates, Exelon
Wind, Utility Growth CapEx and Solar CapEx)
(750)
(350)
(850)
(2,000)
Nuclear Fuel
n/a
n/a
(1,050)
(1,050)
Dividend
(3)
(1,400)
Nuclear Uprates, Exelon Wind and Solar
(4)
n/a
n/a
(825)
(825)
Wolf Hollow Acquisition
n/a
n/a
(300)
(300)
Antelope Valley Solar Ranch One Acquisition
n/a
n/a
(75)
(75)
Utility Growth CapEx
(5)
(275)
(125)
n/a
(400)
Net Financing (excluding Dividend):
Debt Issuances
(6)
1,200
--
--
1,200
Federal Financing Bank Loan
n/a
n/a
125
125
Planned Debt Retirements
(550)
(250)
--
(800)
Other
(7)
--
(75)
150
275
Ending Cash Balance
(1)
$400
13 |
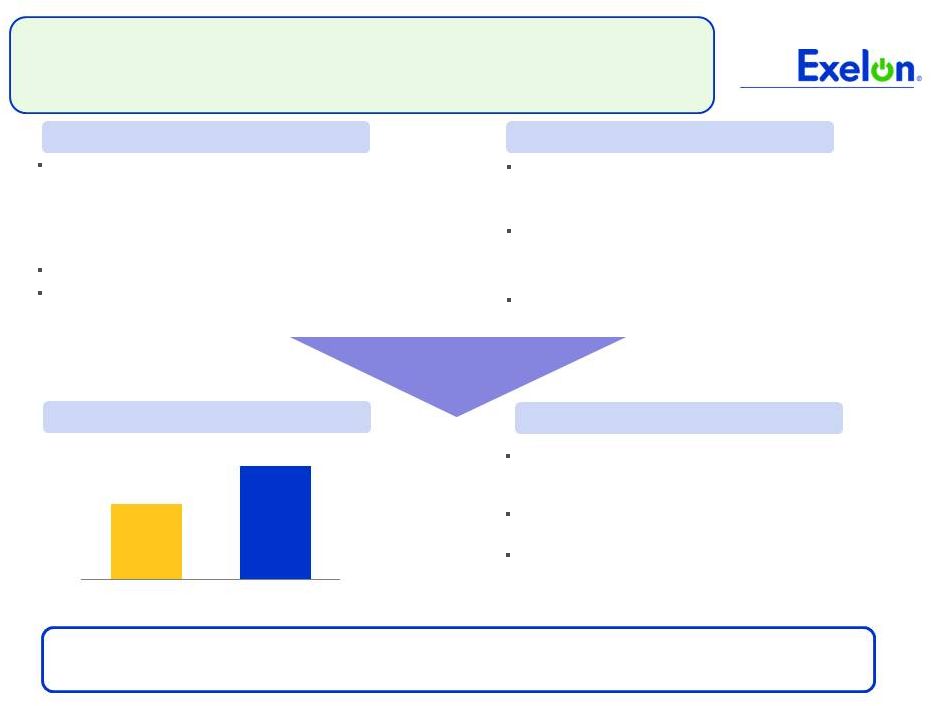
 14
Investment strategy achieved positive 2011 YTD
returns in a very challenging market environment due
to effectiveness of asset allocations and hedging
strategy :
•
Diversified asset allocation
•
Liability hedge
•
Pension plans are 83% funded as of September 30,
2011
•
Anticipate no substantial changes to contribution plan
S&P 500
Exelon
Pension
Fund Assets
-8.7%
5.3%
Pension Funds Performance
2011 YTD Returns at 9/30/2011
o
Decreased equity investments and
increased investment in fixed income
securities and alternative investments
o
The liability hedge has offset more than
50% of the pension liability increase caused
by lower interest rates
Exelon’s pension investment strategy has effectively dampened the volatility
of plan assets and plan funded status |
  15
Exelon Generation Hedging Disclosures
(as of September 30, 2011) |
 16
Important Information
The following slides are intended to provide additional information regarding the hedging
program at Exelon Generation and to serve as an aid for the purposes of modeling Exelon
Generation’s gross margin (operating revenues less purchased power and fuel expense). The
information on the following slides is not intended to represent earnings guidance or a forecast
of future events. In fact, many of the factors that ultimately will determine Exelon
Generation’s actual gross margin are based upon highly variable market factors outside of
our control. The information on the following slides is as of September 30, 2011. We
update this information on a quarterly basis. Certain
information on the following slides is based upon an internal simulation model that incorporates
assumptions regarding future market conditions, including power and commodity prices, heat rates,
and demand conditions, in addition to operating performance and dispatch characteristics of our
generating fleet. Our simulation model and the assumptions therein are subject to
change. For example, actual market conditions and the dispatch profile of our generation
fleet in future periods will likely differ – and may differ significantly – from the
assumptions underlying the simulation results included in the slides. In addition, the
forward- looking information included in the following slides will likely change over time due
to continued refinement of our simulation model and changes in our views on future market
conditions. |
 17
Power Team utilizes several product types
and channels to market
•
Wholesale and retail sales
•
Block products
•
Load-following products
and load auctions
•
Put/call options
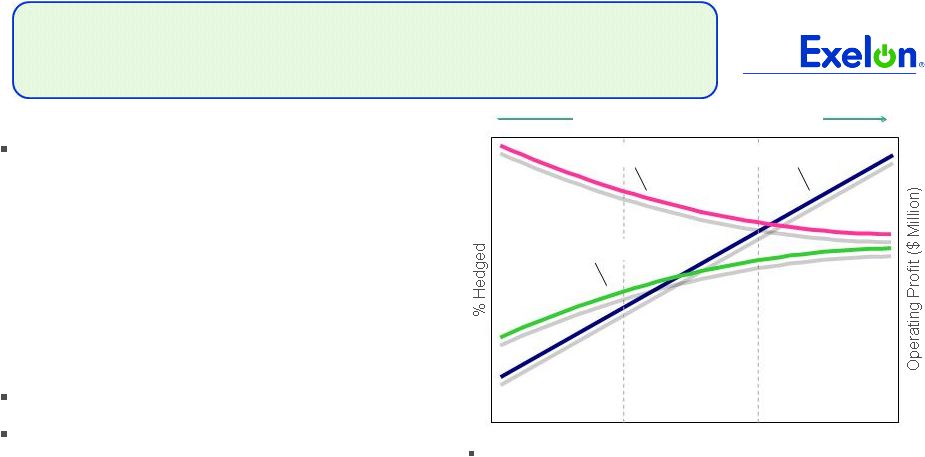
Exelon’s hedging program is designed to
protect the long-term value of our
generating fleet and maintain an
investment-grade balance sheet
•
Hedge enough commodity risk to meet future cash
requirements if prices drop
•
Consider: financing policy (credit rating objectives,
capital structure, liquidity); spending (capital and
O&M); shareholder value return policy
Consider market, credit, operational risk
Approach to managing volatility
•
Increase hedging as delivery approaches
•
Have enough supply to meet peak load
•
Purchase fossil fuels as power is sold
•
Choose hedging products based on generation
portfolio
–
sell
what
we
own
•
Heat rate options
•
Fuel products
•
Capacity
•
Renewable credits
Portfolio Management Objective
Align Hedging Activities with Financial Commitments
% Hedged
High End of Profit
Low End of Profit
Open Generation
with LT Contracts
Portfolio
Optimization
Portfolio
Management
Portfolio Management Over Time |
 18
Percentage of Expected
Generation Hedged
•
How many equivalent MW have been
hedged at forward market prices; all hedge
products used are converted to an
equivalent average MW volume
•
Takes ALL
hedges into account whether
they are power sales or financial products
Equivalent MWs Sold
Expected Generation
=
Our normal practice is to hedge commodity risk on a ratable basis
over the three years leading to the spot market
•
Carry operational length into spot market to manage forced outage and
load-following risks
•
By
using
the
appropriate
product
mix,
expected
generation
hedged
approaches
the
mid-90s percentile as the delivery period approaches
•
Participation in larger procurement events, such as utility auctions, and some
flexibility in the timing of hedging may mean the hedge program is not
strictly ratable from quarter to quarter
Exelon Generation Hedging Program |
 19
2011
2012
2013
Estimated Open Gross Margin ($ millions)
(1)(2)
$5,600
$5,150
$5,900
Reference Prices
(1)
Henry Hub Natural Gas ($/MMBtu)
NI-Hub ATC Energy Price ($/MWh)
PJM-W ATC Energy Price ($/MWh)
ERCOT
North
ATC
Spark
Spread
($/MWh)
(3)
$4.11
$33.61
$45.07
$11.58
$4.24
$33.69
$45.46
$4.32
$4.80
$36.49
$48.45
$4.69
Exelon Generation Open Gross Margin and
Reference Prices
(1)
Based on September 30, 2011 market conditions.
(2)
Gross margin is defined as operating revenues less fuel expense and purchased power
expense, excluding the impact of decommissioning and other incidental revenues. Open
gross margin is estimated based upon an internal model that is developed by
dispatching our expected generation to current market power and fossil fuel prices. Open gross margin
assumes
there
is
no
hedging
in
place
other
than
fixed
assumptions
for
capacity
cleared
in
the
RPM
auctions
and
uranium
costs
for
nuclear power plants. Open gross margin
contains assumptions for other gross margin line items such as various ISO bill and
ancillary revenues and costs and PPA capacity revenues and payments. The estimation of open
gross margin incorporates management discretion and modeling assumptions that are
subject to change. (3)
ERCOT North ATC spark spread using Houston Ship Channel Gas, 7,200 heat rate, $2.50
variable O&M. |
 20
2011
2012
2013
Expected Generation
(GWh)
(1)
166,300
169,600
166,100
Midwest
98,500
98,300
96,100
Mid-Atlantic
56,500
56,800
56,100
South & West
11,300
14,500
13,900
Percentage of Expected Generation Hedged
(2)
97-100%
85-88%
56-59%
Midwest
97-100
85-88
56-59
Mid-Atlantic
96-99
88-91
57-60
South & West
94-97
68-71
49-52
Effective Realized Energy Price
($/MWh)
(3)
Midwest
$43.00
$41.00
$40.00
Mid-Atlantic
$56.50
$50.00
$50.50
South & West
$6.00
$1.00
$0.00
Generation Profile
(1)
Expected generation represents the amount of energy estimated to be generated or purchased through
owned or contracted for capacity. Expected generation is based upon a simulated dispatch
model that makes assumptions regarding future market conditions, which are calibrated to market quotes for power, fuel, load following products, and options.
Expected generation assumes 12 refueling outages in 2011 and 10 refueling outages in 2012 and 2013 at
Exelon-operated nuclear plants and Salem. Expected generation assumes capacity
factors of 93.1%, 93.5% and 93.3% in 2011, 2012 and 2013 at Exelon-operated nuclear plants. These estimates of expected generation in 2012 and 2013 do
not represent guidance or a forecast of future results as Exelon has not completed its planning or
optimization processes for those years. (2)
Percent of expected generation hedged is the amount of equivalent sales divided by the expected
generation. Includes all hedging products, such as wholesale and retail sales of power,
options, and swaps. Uses expected value on options. Reflects decision to permanently retire Cromby Station and Eddystone Units 1&2 as of May 31, 2011.
(3)
Effective realized energy price is representative of an all-in hedged price, on a per MWh basis,
at which expected generation has been hedged. It is developed by considering the energy
revenues and costs associated with our hedges and by considering the fossil fuel that has been purchased to lock in margin. It excludes uranium costs and RPM capacity
revenue, but includes the mark-to-market value of capacity contracted at prices other than RPM
clearing prices including our load obligations. It can be compared with the reference
prices used to calculate open gross margin in order to determine the mark-to-market value of Exelon Generation's energy hedges.
|
 21
Gross Margin Sensitivities with Existing Hedges ($ millions)
(1)
Henry Hub Natural Gas
+ $1/MMBtu
-
$1/MMBtu
NI-Hub ATC Energy Price
+$5/MWH
-$5/MWH
PJM-W ATC Energy Price
+$5/MWH
-$5/MWH
Nuclear Capacity Factor
+1% / -1%
2011
$5
$(5)
$5
$(5)
$5
$(5)
+/-
$10
2012
$65
$(30)
$70
$(50)
$40
$(35)
+/-
$45
2013
$305
$(265)
$210
$(205)
$145
$(140)
+/-
$50
Exelon Generation Gross Margin Sensitivities
(with Existing Hedges)
(1)
Based on September 30, 2011 market conditions and hedged position. Gas price
sensitivities are based on an assumed gas-power relationship derived from an
internal model that is updated periodically.
Power prices sensitivities are derived by adjusting the power price assumption
while keeping all other prices inputs constant. Due to correlation of the
various assumptions, the hedged gross margin impact calculated by aggregating individual sensitivities may not be equal to the
hedged gross margin impact calculated when correlations between the various
assumptions are also considered. |
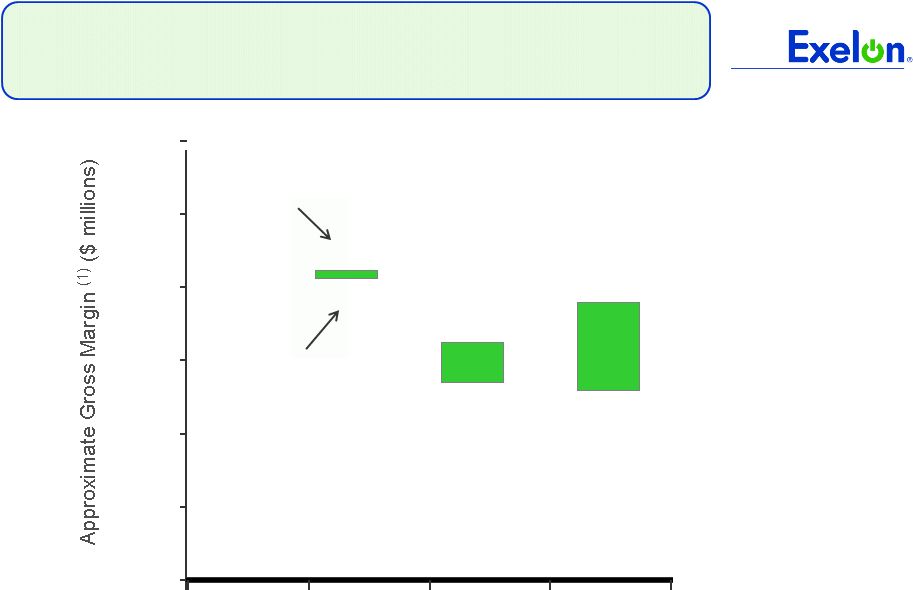 22
$5,700
$6,200
$3,000
$4,000
$5,000
$6,000
$7,000
$8,000
$9,000
2011
2012
2013
$5,500
$6,900
Exelon Generation Gross Margin Upside / Risk
(with Existing Hedges)
95% case
5% case
$7,150
$7,050
(1)
Represents an approximate range of expected gross margin, taking into account hedges in place, between
the 5th and 95th percent confidence levels assuming all unhedged supply is sold into the spot
market. Approximate gross margin ranges are based upon an internal simulation model and are subject to change based upon market inputs, future
transactions and potential modeling changes. These ranges of approximate gross margin in 2012 and 2013
do not represent earnings guidance or a forecast of future results as Exelon has not completed
its planning or optimization processes for those years. The price distributions that generate this range are calibrated to market quotes for power, fuel,
load following products, and options as of September 30, 2011. |
 23
Midwest
Mid-Atlantic
South & West
Step 1
Start
with
fleetwide
open
gross
margin
$5.60 billion
Step 2
Determine
the
mark-to-market
value
of
energy hedges
98,500GWh * 98% *
($43.00/MWh-$33.61MWh)
= $0.91 billion
56,500GWh * 97% *
($56.50/MWh-$45.07MWh)
= $0.63 billion
11,300GWh * 95% *
($6.00/MWh-$11.58MWh)
= $(0.06) billion
Step 3
Estimate
hedged
gross
margin
by
adding open gross margin to mark-to-
market value of energy hedges
Open gross
margin:
MTM value of energy hedges:
Estimated hedged gross
margin: $5.60
billion $0.91billion
+
$0.63billion
+
$(0.06)
billion
$7.08 billion
Illustrative Example
of Modeling Exelon Generation 2011 Gross Margin
(with Existing Hedges) |
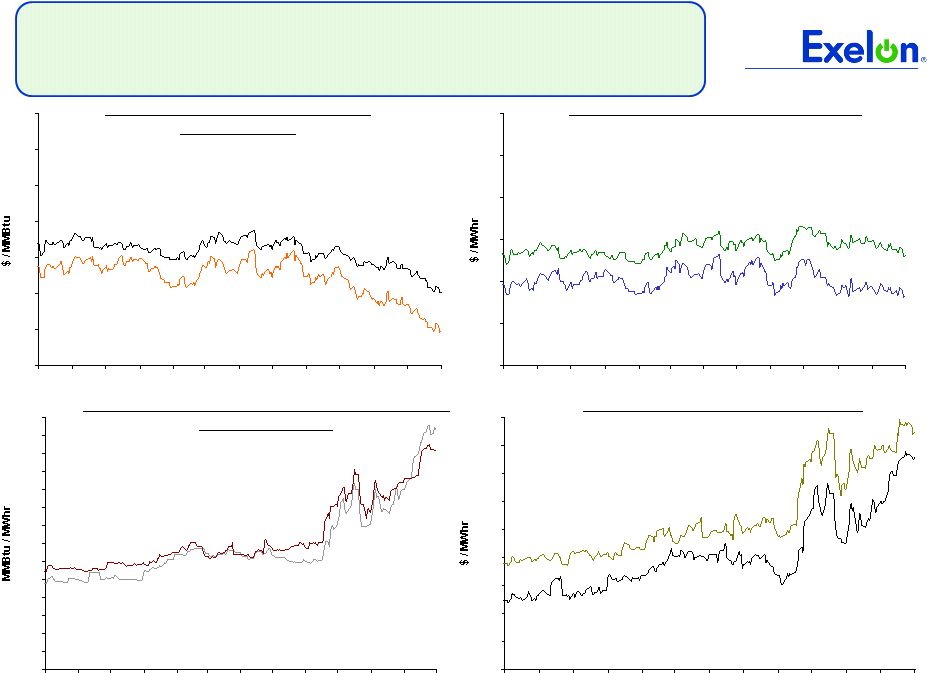
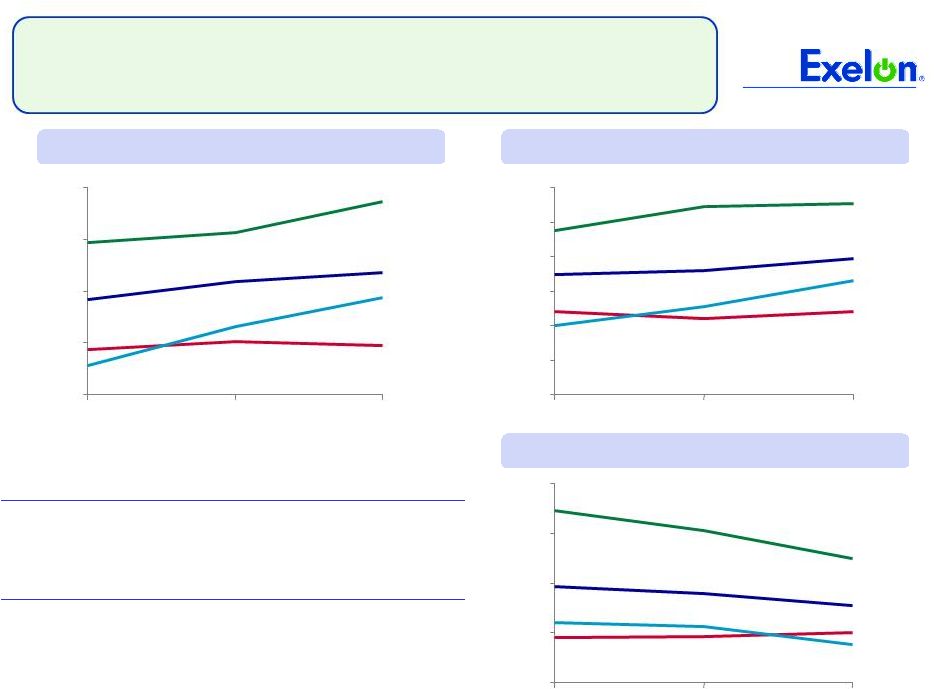
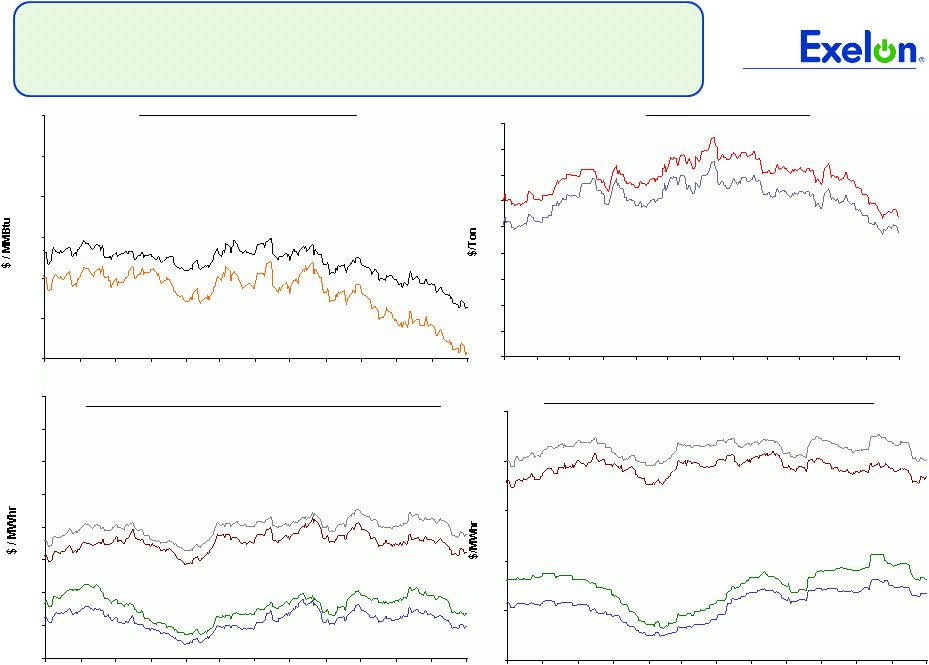 Market Price Snapshot
Forward NYMEX Natural Gas
PJM-West and Ni-Hub On-Peak Forward Prices
PJM-West and Ni-Hub Wrap Forward Prices
2012
$4.07
2013 $4.62
Rolling
12
months,
as
of
October
20
2011.
Source:
OTC
quotes
and
electronic
trading
system.
Quotes
are
daily.
Forward NYMEX Coal
2012
$74.25
2013
$77.25
2012 Ni-Hub $39.86
2013 Ni-Hub
$41.73
2013 PJM-West $53.74
2012 PJM-West
$51.14
2012 Ni-Hub
$26.79
2013 Ni-Hub
$28.24
2013 PJM-West
$40.19
2012 PJM-West
$38.43
24
4.0
4.5
5.0
5.5
6.0
6.5
7.0
10/10
11/10
12/10
1/11
2/11
3/11
4/11
5/11
6/11
7/11
8/11
9/11
10/11
35
40
45
50
55
60
65
70
75
10/10
11/10
12/10
1/11
2/11
3/11
4/11
5/11
6/11
7/11
8/11
9/11
10/11
50
55
60
65
70
75
80
85
90
95
10/10
11/10
12/10
1/11
2/11
3/11
4/11
5/11
6/11
7/11
8/11
9/11
10/11
20
25
30
35
40
45
10/10
11/10
12/10
1/11
2/11
3/11
4/11
5/11
6/11
7/11
8/11
9/11
10/11
th |
 4.5
5.5
6.5
7.5
8.5
9.5
10.5
11.5
12.5
13.5
10/10
11/10
12/10
1/11
2/11
3/11
4/11
5/11
6/11
7/11
8/11
9/11
10/11
8.2
8.4
8.6
8.8
9.0
9.2
9.4
9.6
9.8
10.0
10.2
10.4
10.6
10.8
11.0
10/10
11/10
12/10
1/11
2/11
3/11
4/11
5/11
6/11
7/11
8/11
9/11
10/11
35
40
45
50
55
60
65
10/10
11/10
12/10
1/11
2/11
3/11
4/11
5/11
6/11
7/11
8/11
9/11
10/11
3.5
4.0
4.5
5.0
5.5
6.0
6.5
7.0
10/10
11/10
12/10
1/11
2/11
3/11
4/11
5/11
6/11
7/11
8/11
9/11
10/11
Market Price Snapshot
2013
10.64
2012
10.89
2012
$43.23
2013
$48.04
2012
$3.97
2013
$4.51
Houston Ship Channel Natural Gas
Forward Prices
ERCOT North On-Peak Forward Prices
ERCOT North On-Peak v. Houston Ship Channel
Implied Heat Rate
2012
$12.07
2013
$12.96
ERCOT North On Peak Spark Spread
Assumes a 7.2 Heat Rate, $1.50 O&M, and $.15 adder
25
Rolling
12
months,
as
of
October
20
2011.
Source:
OTC
quotes
and
electronic
trading
system.
Quotes
are
daily.
th |
  26
Appendix |
 Maryland PSC Review Schedule
(Case No. 9271)
27
Significant Events
Date of Event
Filing of Application
May 25, 2011
Intervention Deadline
June 24, 2011
Prehearing Conference
June 28, 2011
Filing of Staff, Office of People Counsel and Intervenor Testimony
September 16, 2011*
Filing of Rebuttal Testimony
October 12, 2011*
Filing of Surrebuttal Testimony
October 26, 2011
Status Conference
October 28, 2011
Evidentiary Hearings
October 31, 2011 -
November 18, 2011
Public Comment Hearings
November 29, December 1 &
December 5, 2011
Filing of Initial Briefs
December 1, 2011
Filing of Reply Briefs
December 15, 2011
Decision Deadline
January 5, 2012
* Initial
intervenor
testimony
with
respect
to
market
power
was
due
on
September
23
for
all
parties except for the
Independent Market
Monitor
and
rebuttal
testimony
with
respect
to
market
power
was
due
on
October
17
.
rd
th |
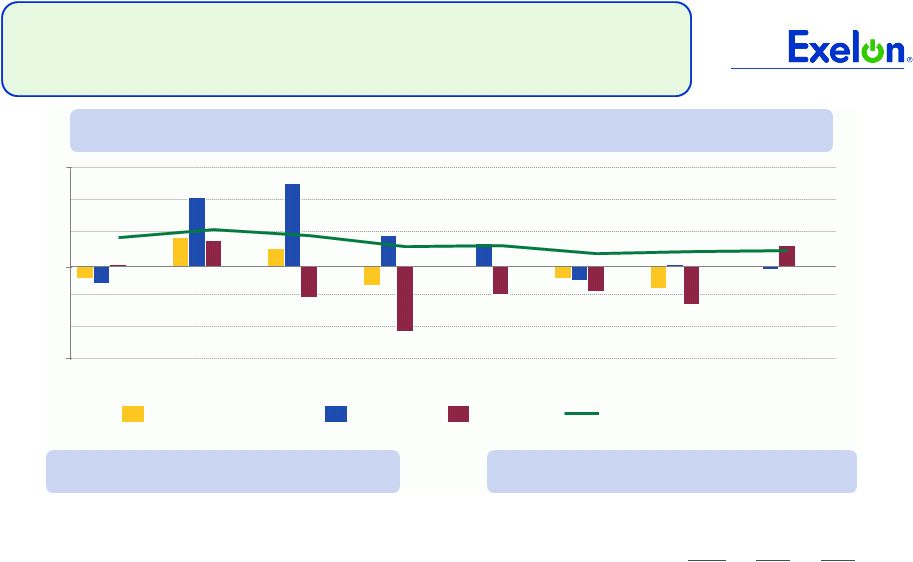 ComEd
Load Trends Weather-Normalized Load Year-over-Year
28
4Q11
3Q11
2Q11
1Q11
4Q10
3Q10
2Q10
1Q10
Gross Metro Product
Residential
Large C&I
All Customer Classes
Chicago
U.S.
Unemployment rate
(1)
2011 annualized growth in
gross
domestic/metro
product
(2)
Note: C&I = Commercial & Industrial
Key Economic Indicators
Weather-Normalized Load
2010
3Q11 2011E
Average Customer Growth
0.2%
0.5%
0.5%
Average Use-Per-Customer
(1.4)%
(2.9)%
(1.7)%
Total Residential
(1.2)%
(2.4)% (1.2)%
Small C&I
(0.6)%
(2.2)%
(0.8)%
Large C&I
2.6%
0.1%
0.1%
All Customer Classes
0.2%
(1.4)%
(0.6)%
(1)
Source: U.S. Dept. of Labor (September 2011) and Illinois
Department of Employment Security (September 2011)
(2) Source: Global Insight (August 2011)
-6%
-4%
-2%
0%
2%
4%
6%
9.1%
1.6%
10.5%
1.0% |
 29
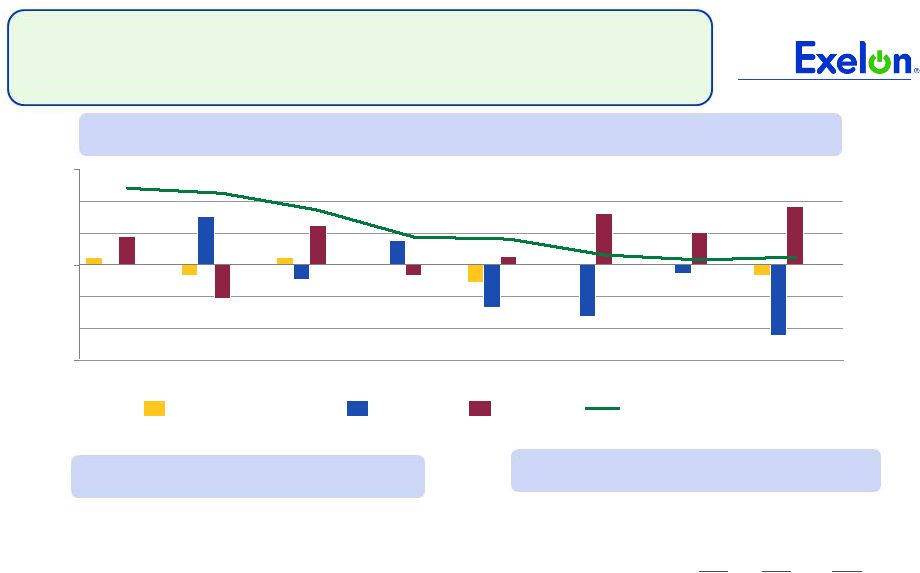
PECO Load Trends
Weather-Normalized Load
Note: C&I = Commercial & Industrial
4Q11
3Q11
2Q11
1Q11
4Q10
3Q10
2Q10
1Q10
Gross Metro Product
Residential
Large C&I
All Customer Classes
Philadelphia
U.S.
Unemployment rate
(1)
9.0%
9.1%
2011 annualized growth in
gross domestic/metro product
(2)
0.7%
1.6% 2010
3Q11 2011E
Average Customer Growth
0.3%
0.3%
0.3%
Average Use-Per-Customer
0.3%
1.8%
1.9%
Total Residential
0.5%
2.1%
2.3%
Small C&I
(1.9)%
(3.2)%
(1.0)%
Large C&I
0.8%
(0.6)%
(2.7)%
All Customer Classes
0.1%
(0.1)%
(0.5)%
(1)
Source:
U.S.
Dept.
of
Labor
data
(September
2011)
–
US
U.S.
Dept.
of
Labor
prelim.
data
(August
2011)
–
Philadelphia
(2) Source: Global Insight (August 2011)
Weather-Normalized Load Year-over-Year
Key Economic Indicators
-6%
-4%
-2%
0%
2%
4%
6% |
 Sufficient Liquidity
($ millions)
Exelon
(3)
Aggregate Bank Commitments
(1)
$1,000
$600
$5,600
$7,700
Outstanding Facility Draws
--
--
--
--
Outstanding Letters of Credit
(1)
(1)
(122)
(131)
Available Capacity Under Facilities
(2)
999
599
5,478
7,569
Outstanding Commercial Paper
--
--
(28)
(356)
Available Capacity Less Outstanding
Commercial Paper
$999
$599
$5,450
$7,213
Available Capacity Under Bank Facilities as of October 21, 2011
Exelon bank facilities are largely untapped
(1) Excludes commitments from Exelon’s Community and Minority Bank
Credit Facility (2) Available Capacity Under Facilities represents the
unused bank commitments under the borrower’s credit agreements net of outstanding letters of credit and facility draws. The
amount of commercial paper outstanding does not reduce the available capacity under
the credit agreements. (3) Includes Exelon Corp’s $500M credit
facility, letters of credit and commercial paper outstanding. 30
|
 31
Key Credit Metrics
(1)
See slide 32 for reconciliations to GAAP.
(2)
Current senior unsecured ratings for Exelon and Exelon Generation and senior
secured ratings for ComEd and PECO as of October 14, 2011.
(3)
Moody’s placed Exelon and Generation under review for a possible downgrade
after the proposed merger with Constellation Energy was announced. S&P
and Fitch affirmed ratings of Exelon and subsidiaries after the proposed
merger was announced. (4)
FFO/Debt Target Range reflects Generation FFO/Debt in addition to the debt
obligations of Exelon Corp. Range represents FFO/Debt to maintain current
ratings at current business risk. Moody’s Credit
Ratings
(2) (3)
S&P Credit
Ratings
(2) (3)
Fitch Credit
Ratings
(2) (3)
FFO / Debt
Target
Range
Exelon:
Baa1
BBB-
BBB+
ComEd:
Baa1
A-
BBB+
15-18%
PECO:
A1
A-
A
15-18%
Generation:
A3
BBB
BBB+
30-35%
(4)
Exelon
PECO
ComEd
2011E
2010A
2009A
Exelon
PECO
ComEd
2011E
2010A
2009A
Exelon
PECO
ComEd
2011E
2010A
2009A
FFO/Debt
(1)
Interest Coverage
(1)
Debt to Cap
(1)
40%
50%
60%
70%
80%
0X
2X
4X
6X
8X
10X
12X
10%
20%
30%
40%
50%
ExGen/
Corp
ExGen/
Corp
ExGen/
Corp |
 32
Exelon Consolidated Metric Calculations and Ratios
(1)
Includes changes in A/R, Inventories, A/P and other accrued expenses, option
premiums, counterparty collateral and income taxes. Impact to FFO is
opposite of impact to cash flow (2)
Reflects retirement of variable interest entity + change in restricted cash
(3)
Reflects
net
capacity
payment
–
interest
on
PV
of
PPAs
(using
weighted
average
cost
of
debt)
(4)
Reflects
employer
contributions
–
(service
costs
+
interest
costs
+
expected
return
on
assets),
net
of
taxes at 35%
(5)
Reflects
operating
lease
payments
–
interest
on
PV
of
future
operating
lease
payments
(using
weighted average cost of debt)
(6)
Includes AFUDC / capitalized interest
(7)
Reflects PV of net capacity purchases (using weighted average cost of debt)
$ in millions
(8)
Reflects unfunded status, net of taxes at 35%
(9)
Reflects PV of minimum future operating lease payments (using weighted average cost
of debt) (10)
Nuclear decommissioning trust fund balance > asset retirement obligation.
No debt imputed (11)
Includes accrued interest less securities qualifying for hybrid treatment (50% debt
/ 50% equity) (12)
Reflects interest on PV of minimum future operating lease payments (using weighted
average cost of debt)
(13)
Reflects interest on PV of PPAs (using weighted average cost of debt)
(14)
Includes
AFUDC
/
capitalized
interest
and
interest
on
securities
qualifying
for
hybrid
treatment
(50%
debt / 50% equity)
(15)
Includes interest on securities qualifying for hybrid treatment (50% debt / 50%
equity) FFO / Debt Coverage =
FFO (a)
Adjusted Debt (b)
FFO Interest Coverage =
FFO (a) + Adjusted Interest (c)
Adjusted Interest (c)
Adjusted Capitalization (e) =
Adjusted Debt (b) + Adjusted Equity (d)
=
32,606
Rating Agency Debt Ratio =
Adjusted Debt (b)
Adjusted Capitalization (e)
32%
7.2x
58%
=
=
=
2010A Credit Metrics
Exelon 2010 YE Adjustments
FFO Calculation
2010 YE
Source -
2010 Form 10-K (.pdf version)
Net Cash Flows provided by Operating Activities
5,244
Pg 159 -
Stmt. of Cash Flows
+/-
Change in Working Capital
644
Pg 159 -
Stmt. of Cash Flows
(1)
-
PECO Transition Bond Principal Paydown
(392)
Pg 174 -
Stmt. of Cash Flows
(2)
+ PPA Depreciation Adjustment
207
Pg 295 -
Commitments and Contingencies
(3)
+/-
Pension/OPEB Contribution Normalization
448
Pg 268-269 -
Post-retirement Benefits
(4)
+ Operating Lease Depreciation Adjustment
35
Pg 299 -
Commitments and Contingencies
(5)
+/-
Decommissioning activity
(143)
Pg 159-
Stmt. of Cash Flows
+/-
Other Minor FFO Adjustments
(6)
(54)
= FFO (a)
5,989
Debt Calculation
Long-term Debt (incl. Current Maturities and A/R agreement)
12,828
Pg 161 -
Balance Sheet
Short-term debt (incl. Notes Payable / Commercial Paper)
-
Pg 161 -
Balance Sheet
-
PECO Transition Bond Principal Paydown
-
N/A -
no debt outstanding at year-end
+ PPA Imputed Debt
1,680
Pg
295
-
Commitments
and
Contingencies
(7)
+ Pension/OPEB Imputed Debt
3,825
Pg
268
-
Post-retirement
benefits
(8)
+ Operating Lease Imputed Debt
428
Pg
299
-
Commitments
and
Contingencies
(9)
+ Asset Retirement Obligation
-
Pg
261-267
-
Asset
Retirement
Obligations
(10)
+/-
Other Minor Debt Equivalents
(11)
84
= Adjusted Debt (b)
18,845
Interest Calculation
Net Interest Expense
817
Pg
158
-
Statement
of
Operations
-
PECO Transition Bond Interest Expense
(22)
Pg
182
-
Significant
Accounting
Policies
+ Interest on Present Value (PV) of Operating Leases
29
Pg
299
-
Commitments
and
Contingencies
(12)
+ Interest on PV of Purchased Power Agreements (PPAs)
99
Pg
295
-
Commitments
and
Contingencies
(13)
+/-
Other Minor Interest Adjustments
(14)
37
= Adjusted Interest (c)
960
Equity Calculation
Total Equity
13,563
Pg 161 -
Balance Sheet
+ Preferred Securities of Subsidaries
87
Pg 161 -
Balance Sheet
+/-
Other Minor Equity Equivalents
(15)
111
= Adjusted Equity (d)
13,761 |
 33
3Q GAAP EPS Reconciliation
NOTE: All amounts shown are per Exelon share and represent contributions to
Exelon's EPS. Amounts may not add due to rounding. Three Months Ended
September 30, 2010 ExGen
ComEd
PECO
Other
Exelon
2010 Adjusted (non-GAAP) Operating Earnings (Loss) Per Share
$0.75
$0.18
$0.19
$(0.01)
$1.11
2007 Illinois electric rate settlement
0.00
-
-
-
0.00
Mark-to-market impact of economic hedging activities
0.14
-
-
-
0.14
Unrealized gains related to nuclear decommissioning trust funds
0.09
-
-
-
0.09
Retirement of fossil generating units
(0.02)
-
-
-
(0.02)
Emission allowances impairment
(0.05)
-
-
-
(0.05)
3Q 2010 GAAP Earnings (Loss) Per Share
$0.91
$0. 18
$0.19
$(0.01)
$1.27
Three Months Ended September 30, 2011
ExGen
ComEd
PECO
Other
Exelon
2011 Adjusted (non-GAAP) Operating Earnings (Loss) Per Share
$0.79
$0.17
$0.16
$0.01
$1.12
Mark-to-market impact of economic hedging activities
(0.08)
-
-
-
(0.08)
Unrealized losses related to nuclear decommissioning trust funds
(0.12)
-
-
-
(0.12)
Asset retirement obligation
(0.03)
-
0.00
-
(0.02)
Retirement of fossil generating units
(0.00)
-
-
-
(0.00)
Constellation acquisition costs
(0.00)
(0.00)
(0.00)
(0.01)
(0.02)
AVSR 1 acquisition costs
(0.01)
-
-
-
(0.01)
Wolf Hollow acquisition
0.03
-
-
-
0.03
3Q 2011 GAAP Earnings (Loss) Per Share
$0.58
$0.17
$0.16
$(0.00)
$0.90 |
 34
YTD GAAP EPS Reconciliation
NOTE: All amounts shown are per Exelon share and represent contributions to
Exelon's EPS. Amounts may not add due to rounding. Nine Months Ended
September 30, 2010 ExGen
ComEd
PECO
Other
Exelon
2010 Adjusted (non-GAAP) Operating Earnings (Loss) Per Share
$2.10
$0.55
$0.51
$(0.06)
$3.10
2007 Illinois electric rate settlement
(0.01)
-
-
-
(0.01)
Mark-to-market impact of economic hedging activities
0.25
-
-
-
0.25
Unrealized gains related to nuclear decommissioning trust funds
0.04
-
-
-
0.04
Non-cash charge resulting from health care legislation
(0.04)
(0.02)
(0.02)
(0.02)
(0.10)
Non-cash remeasurement of income tax uncertainties
0.10
(0.16)
(0.03)
(0.01)
(0.10)
Retirement of fossil generating units
(0.05)
-
-
-
(0.05)
Emission allowances impairment
(0.05)
-
-
-
(0.05)
YTD 2010 GAAP Earnings (Loss) Per Share
$2.34
$0.37
$0.46
$(0.09)
$3.08
Nine Months Ended September 30, 2011
ExGen
ComEd
PECO
Other
Exelon
2011 Adjusted (non-GAAP) Operating Earnings (Loss) Per Share
$2.47
$0.43
$0.47
$(0.03)
$3.34
Mark-to-market impact of economic hedging activities
(0.34)
-
-
-
(0.34)
Unrealized losses related to nuclear decommissioning trust funds
(0.07)
-
-
-
(0.07)
Retirement of fossil generating units
(0.04)
-
-
-
(0.04)
Asset retirement obligation
(0.03)
-
0.00
-
(0.02)
Constellation acquisition costs
(0.00)
(0.00)
(0.00)
(0.03)
(0.04)
AVSR 1 acquisition costs
(0.01)
-
-
-
(0.01)
Non-cash charge resulting from Illinois tax rate change legislation
(0.03)
(0.01)
-
(0.00)
(0.04)
Wolf Hollow acquisition
0.03
-
-
-
0.03
Recovery of costs pursuant to distribution rate case order
-
0.03
-
-
0.03
YTD 2011 GAAP Earnings (Loss) Per Share
$1.99
$0.44
$0.47
$(0.07)
$2.84 |
 35
GAAP to Operating Adjustments
Exelon’s 2011 adjusted (non-GAAP) operating earnings outlook excludes the
earnings effects of the following:
•
Mark-to-market adjustments from economic hedging activities
•
Unrealized gains and losses from nuclear decommissioning trust fund investments to
the extent not offset by contractual accounting as described in the notes to
the consolidated financial statements
•
Significant impairments of assets, including goodwill
•
Changes in decommissioning obligation and asset retirement obligation
estimates •
Non-cash charge to remeasure deferred taxes at higher Illinois corporate tax
rates •
Financial impacts associated with the planned retirement of fossil generating
units •
One-time benefits reflecting ComEd’s 2011 distribution rate case order for
the recovery of previously
incurred
costs
related
to
the
2009
restructuring
plan
and
for
the
passage
of
Federal
health care legislation in 2010
•
Certain costs associated with Exelon’s acquisition of a wind portfolio (now
known as Exelon Wind) and AVSR 1, and Exelon’s proposed merger with
Constellation •
Non-cash
gain
on
purchase
in
connection
with
the
acquisition
of
Wolf
Hollow,
net
of
acquisition
costs
•
Non-cash charge remeasurement of income tax uncertainties
•
Non-cash charge resulting from passage of Federal health care legislation
•
Costs associated with the 2007 electric rate settlement agreement
•
Impairment of certain emission allowances
•
Other unusual items
•
Significant changes to GAAP
Operating
earnings
guidance
assumes
normal
weather
for
remainder
of
the
year |