Attached files
| file | filename |
|---|---|
| 8-K - FORM 8-K - CAMDEN NATIONAL CORP | v237947_8k.htm |
| EX-99.1 - CAMDEN NATIONAL CORP | v237947_ex99-1.htm |
Dear Fellow Shareholders,
I’m pleased to share with you Camden National Corporation’s superior financial results for the first nine months of 2011. For the nine months ended September 30, 2011, the Company posted net income of $20.3 million and diluted earnings per share of $2.65. This performance resulted in net income and diluted earnings per share growth of 11% compared to the same period a year ago. The year-to-date return on assets increased to 1.17% for 2011, compared to 1.08% for the same period a year ago, and return on equity increased to 12.73% from 12.43%.
In addition to these strong “bottom line” results, there are several other financial accomplishments and trends that I would like to share with you. First, total revenues of $72.7 million for the first nine months of 2011 were 2%, or $1.4 million, higher than revenues during the comparable period a year ago. Secondly, our provision for loan losses, or the amount of additional reserves set aside for potential loan problems and actual loan charge-offs, was $3.3 million, compared to $5.2 million a year ago. Additionally, our total amount of reserves, or the allowance for loan losses, increased to 1.52% of total loans, from 1.45% a year ago. Finally, our operating expenses increased 2% to $39.9 million, which primarily reflects increased incentive compensation costs for all levels of employees as we are currently performing better than the benchmarks determined by the Board of Directors.
Results for the third quarter of 2011 were strong and we are pleased with the Company’s performance, given various economic stresses such as the current low interest rate environment, various changes in government regulations resulting in continued negative impact to both revenues and expenses, and the impact of what some are terming a potential “double dip” recession. Net income totaled $6.9 million, or $0.90 per diluted share, during the third quarter of 2011, which was down from $7.4 million, or $0.97 per diluted share, during the third quarter of 2010. The primary reason for the decline was the impact of several non-recurring items in each period. During the third quarter of 2011, revenues from an insurance claim and net gains on securities totaled $666,000. This compares to a large legal settlement received in the Company’s favor, partially offset by securities losses recorded in the third quarter of 2010, which netted $1.8 million.
Other than non-recurring items, the performance of the third quarter of 2011 was comparable to the performance of the third quarter of 2010. This reflects the Company’s ability to weather the economic stresses mentioned above which negatively impact our net interest margin, weaken overall loan demand, and put additional negative pressure on our revenue sources.
With uncertain economic conditions, Camden National remains focused on strengthening its balance sheet, much as it has done since the economic downturn that began in 2008. This focus is demonstrated by the improvement in our capital ratios, highlighted by our tangible capital to tangible assets ratio of 7.67% at September 30, 2011, up from 6.99% at September 30, 2010. Also, as mentioned above, our allowance for loan losses improved to 1.52% at September 30, 2011, from 1.45% at September 30, 2010. Internally, we are focused on maintaining our credit underwriting standards, as well as conducting a major effectiveness and efficiency review with the goal of improving customer and employee experiences and continuing to invest in our organization in areas ranging from technology to leadership development. These strategies will position Camden National Corporation as a strong leader in Maine’s financial community for many years to come.
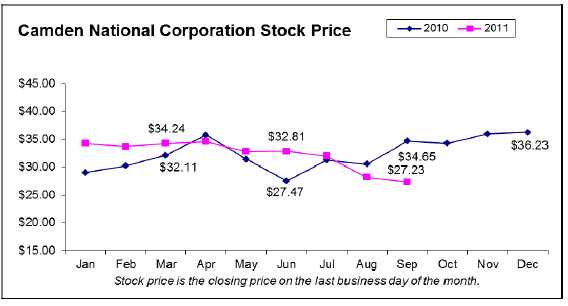
With a strong and well-positioned balance sheet and a proven ability to grow earnings over the past year, it was disappointing to observe the price performance of our common stock. Even though our tangible book value increased 11%, to $22.99 per share from $20.66 a year ago, the actual share price declined to $27.23 at September 30, 2011, from $34.65 at September 30, 2010. While we can theorize about how investor sentiment towards all financial stocks has become less favorable during the time period or how the current economic uncertainty is negatively impacting all stocks, both management and the Board of Directors believe current stock market conditions are not adequately valuing shares of Camden National Corporation. For this reason, the common stock buy-back program, which has been on hold for the past few years, has been renewed. This will allow the Company to repurchase up to 500,000 common shares when conditions warrant. Based on the Company’s financial condition and recent performance, we feel this is a strong tool to have available to benefit all shareholders.
Additionally, a dividend of $0.25 per common share was approved during the quarter. It should be noted that many companies have decreased their dividends since 2008. Camden National Corporation has maintained the current dividend level during the financial crisis and recession, which has allowed for a return to shareholders while at the same time strengthening the Company’s balance sheet by increasing its equity capital levels.
During the quarter, Stephen J. Tall was appointed president and chief executive officer of Acadia Trust, N.A., the Company’s wealth management subsidiary. Steven has family ties to the Blue Hill and Sorrento, Maine, areas, and has an extensive background in wealth management, from New York City to Fort Worth, Texas, which will benefit all clients of Acadia Trust.
In this period of global, national and local economic uncertainty, Camden National will remain focused on delivering consistent and sustainable financial performance. This is achieved by having a committed and dedicated work force, loyal customers, and equally committed and loyal shareholders. Your commitment to Camden National Corporation is greatly appreciated.


Summary Financial Data (unaudited)
(Dollars in thousands, except per share data)
|
Financial Condition Data
|
September 30, 2011
|
September 30, 2010
|
December 31, 2010
|
|||||||||||||
|
Investments
|
$ | 613,917 | $ | 599,942 | $ | 611,643 | ||||||||||
|
Loans and loans held for sale
|
1,513,074 | 1,538,533 | 1,530,280 | |||||||||||||
|
Allowance for loan losses
|
23,011 | 22,336 | 22,293 | |||||||||||||
|
Total assets
|
2,346,716 | 2,308,002 | 2,306,007 | |||||||||||||
|
Deposits
|
1,641,257 | 1,582,248 | 1,515,811 | |||||||||||||
|
Borrowings
|
449,677 | 495,796 | 559,919 | |||||||||||||
|
Shareholders' equity
|
221,939 | 204,190 | 205,995 | |||||||||||||
|
At or for the Three Months Ended
|
At or for the Nine Months Ended
|
|||||||||||||||
|
Operating Data
|
September 30, 2011
|
September 30, 2010
|
September 30, 2011
|
September 30, 2010
|
||||||||||||
|
Interest income
|
$ | 24,386 | $ | 26,278 | $ | 74,891 | $ | 78,776 | ||||||||
|
Interest expense
|
5,739 | 7,399 | 18,122 | 23,277 | ||||||||||||
|
Net interest income
|
18,647 | 18,879 | 56,769 | 55,499 | ||||||||||||
|
Provision for credit losses
|
1,182 | 1,291 | 3,271 | 5,237 | ||||||||||||
|
Net interest income after provision for credit losses
|
17,465 | 17,588 | 53,498 | 50,262 | ||||||||||||
|
Non-interest income
|
5,825 | 6,799 | 15,949 | 15,796 | ||||||||||||
|
Non-interest expense
|
13,307 | 13,459 | 39,864 | 39,238 | ||||||||||||
|
Income before income taxes
|
9,983 | 10,928 | 29,583 | 26,820 | ||||||||||||
|
Income taxes
|
3,054 | 3,487 | 9,245 | 8,480 | ||||||||||||
|
Net income
|
$ | 6,929 | $ | 7,441 | $ | 20,338 | $ | 18,340 | ||||||||
|
Per Share Data
|
||||||||||||||||
|
Basic earnings per share
|
$ | 0.90 | $ | 0.97 | $ | 2.65 | $ | 2.40 | ||||||||
|
Diluted earnings per share
|
0.90 | 0.97 | 2.65 | 2.39 | ||||||||||||
|
Cash dividends paid per share
|
0.25 | 0.25 | 0.75 | 0.75 | ||||||||||||
|
Book value per share
|
28.91 | 26.67 | 28.91 | 26.67 | ||||||||||||
|
Tangible book value per share(1)
|
22.99 | 20.66 | 22.99 | 20.66 | ||||||||||||
|
Selected Financial Data
|
||||||||||||||||
|
Return on average assets
|
1.19 | % | 1.29 | % | 1.17 | % | 1.08 | % | ||||||||
|
Return on average equity
|
12.44 | % | 14.66 | % | 12.73 | % | 12.43 | % | ||||||||
|
Tier 1 leverage capital ratio
|
9.43 | % | 8.65 | % | 9.43 | % | 8.65 | % | ||||||||
|
Tier 1 risk-based capital ratio
|
14.80 | % | 13.30 | % | 14.80 | % | 13.30 | % | ||||||||
|
Total risk-based capital ratio
|
16.05 | % | 14.56 | % | 16.05 | % | 14.56 | % | ||||||||
|
Efficiency ratio(2)
|
53.97 | % | 51.22 | % | 54.20 | % | 53.90 | % | ||||||||
|
Allowance for credit losses to total loans
|
1.52 | % | 1.45 | % | 1.52 | % | 1.45 | % | ||||||||
|
Net loan charge-offs to average loans (annualized)
|
0.30 | % | 0.32 | % | 0.22 | % | 0.27 | % | ||||||||
|
Non-performing loans to total loans
|
1.83 | % | 1.37 | % | 1.83 | % | 1.37 | % | ||||||||
|
Non-performing assets to total assets
|
1.26 | % | 1.03 | % | 1.26 | % | 1.03 | % | ||||||||
(1) Computed by dividing shareholders' equity less goodwill and other intangibles by the number of common shares outstanding.
(2) Calculated by dividing non-interest expense by the sum of net interest income (tax equivalent) and non-interest income (excluding securities gains/losses).
|
A complete set of financial statements for Camden National Corporation my be obtained upon written request to
|
|||||||||
|
Susan M. Westfall, SVP Clerk, Camden National Corporation, P.O. Box 310, Camden, Maine 04843, 207-230-2096.
|
|||||||||