Attached files
| file | filename |
|---|---|
| 8-K - 8-K - REGIONS FINANCIAL CORP | d246121d8k.htm |
| EX-99.3 - EX-99.3 - REGIONS FINANCIAL CORP | d246121dex993.htm |
| EX-99.1 - EX-99.1 - REGIONS FINANCIAL CORP | d246121dex991.htm |
Exhibit 99.2

Regions Financial Corporation and Subsidiaries
Financial Supplement
Third Quarter 2011
| Regions Financial Corporation and Subsidiaries Financial Supplement to Third Quarter 2011 Earnings Release |
Table of Contents
| Page | ||||
| Consolidated Balance Sheets |
1 | |||
| Consolidated Statements of Operations |
2 | |||
| Selected Ratios and Other Information |
3 | |||
| Consolidated Average Daily Balances and Yield / Rate Analysis |
4-5 | |||
| Loans and Deposits |
6 | |||
| Loan Portfolio Mix |
7 | |||
| Pre-Tax Pre-Provision Income (“PPI”) and Adjusted PPI |
8 | |||
| Non-Interest Income and Expense |
9 | |||
| Morgan Keegan Financial Highlights |
10 | |||
| Credit Quality |
||||
| Allowance for Credit Losses, Net Charge-Offs and Related Ratios |
11 | |||
| Troubled Debt Restructurings |
12 | |||
| Gross and Net NPA Migration |
13 | |||
| Credit Costs |
13 | |||
| Early and late stage delinquencies |
14 | |||
| Non-Accrual Loans (excludes loans held for sale) |
15 | |||
| Business Services Credit Quality - Criticized Loans |
15 | |||
| Residential Lending Net Charge-off Analysis |
16 | |||
| Investor Real Estate Analysis |
17-18 | |||
| Reconciliation to GAAP Financial Measures |
19-22 | |||
| Forward-Looking Statements |
23 | |||
| Regions Financial Corporation and Subsidiaries Financial Supplement to Third Quarter 2011 Earnings Release |
Page 1 |
Consolidated Balance Sheets (unaudited)
| Quarter Ended | ||||||||||||||||||||
| ($ amounts in millions) |
9/30/11 | 6/30/11 | 3/31/11 | 12/31/10 | 9/30/10 | |||||||||||||||
| Assets: |
||||||||||||||||||||
| Cash and due from banks |
$ | 2,000 | $ | 2,271 | $ | 2,042 | $ | 1,643 | $ | 1,898 | ||||||||||
| Interest-bearing deposits in other banks |
6,009 | 5,452 | 4,937 | 4,880 | 3,852 | |||||||||||||||
| Federal funds sold and securities purchased under agreements to resell |
254 | 251 | 341 | 396 | 1,137 | |||||||||||||||
| Trading account assets |
1,462 | 1,223 | 1,284 | 1,116 | 1,580 | |||||||||||||||
| Securities available for sale |
24,635 | 23,828 | 24,702 | 23,289 | 23,555 | |||||||||||||||
| Securities held to maturity |
18 | 21 | 22 | 24 | 26 | |||||||||||||||
| Loans held for sale |
1,012 | 1,141 | 1,552 | 1,485 | 1,587 | |||||||||||||||
| Loans, net of unearned income |
79,447 | 81,176 | 81,371 | 82,864 | 84,420 | |||||||||||||||
| Allowance for loan losses |
(2,964 | ) | (3,120 | ) | (3,186 | ) | (3,185 | ) | (3,185 | ) | ||||||||||
|
|
|
|
|
|
|
|
|
|
|
|||||||||||
| Net loans |
76,483 | 78,056 | 78,185 | 79,679 | 81,235 | |||||||||||||||
| Other interest-earning assets |
1,081 | 1,207 | 1,214 | 1,219 | 1,043 | |||||||||||||||
| Premises and equipment, net |
2,399 | 2,481 | 2,528 | 2,569 | 2,564 | |||||||||||||||
| Interest receivable |
422 | 354 | 441 | 421 | 512 | |||||||||||||||
| Goodwill |
5,561 | 5,561 | 5,561 | 5,561 | 5,561 | |||||||||||||||
| Mortgage servicing rights (MSRs) |
182 | 268 | 282 | 267 | 204 | |||||||||||||||
| Other identifiable intangible assets |
478 | 420 | 358 | 385 | 414 | |||||||||||||||
| Other assets |
7,766 | 8,374 | 8,307 | 9,417 | 8,330 | |||||||||||||||
|
|
|
|
|
|
|
|
|
|
|
|||||||||||
| Total Assets |
$ | 129,762 | $ | 130,908 | $ | 131,756 | $ | 132,351 | $ | 133,498 | ||||||||||
|
|
|
|
|
|
|
|
|
|
|
|||||||||||
| Liabilities and Stockholders’ Equity: |
||||||||||||||||||||
| Deposits: |
||||||||||||||||||||
| Non-interest-bearing |
$ | 28,296 | $ | 28,148 | $ | 27,480 | $ | 25,733 | $ | 25,300 | ||||||||||
| Interest-bearing |
67,642 | 68,183 | 68,889 | 68,881 | 69,678 | |||||||||||||||
|
|
|
|
|
|
|
|
|
|
|
|||||||||||
| Total deposits |
95,938 | 96,331 | 96,369 | 94,614 | 94,978 | |||||||||||||||
| Borrowed funds: |
||||||||||||||||||||
| Short-term borrowings: |
||||||||||||||||||||
| Federal funds purchased and securities sold under agreements to repurchase |
1,969 | 1,740 | 2,218 | 2,716 | 2,451 | |||||||||||||||
| Other short-term borrowings |
974 | 982 | 964 | 1,221 | 1,210 | |||||||||||||||
|
|
|
|
|
|
|
|
|
|
|
|||||||||||
| Total short-term borrowings |
2,943 | 2,722 | 3,182 | 3,937 | 3,661 | |||||||||||||||
| Long-term borrowings |
10,140 | 11,646 | 12,197 | 13,190 | 14,335 | |||||||||||||||
|
|
|
|
|
|
|
|
|
|
|
|||||||||||
| Total borrowed funds |
13,083 | 14,368 | 15,379 | 17,127 | 17,996 | |||||||||||||||
| Other liabilities |
3,478 | 3,321 | 3,389 | 3,876 | 3,361 | |||||||||||||||
|
|
|
|
|
|
|
|
|
|
|
|||||||||||
| Total Liabilities |
112,499 | 114,020 | 115,137 | 115,617 | 116,335 | |||||||||||||||
| Stockholders’ equity: |
||||||||||||||||||||
| Preferred stock, Series A |
3,409 | 3,399 | 3,389 | 3,380 | 3,370 | |||||||||||||||
| Common stock |
13 | 13 | 13 | 13 | 13 | |||||||||||||||
| Additional paid-in capital |
19,059 | 19,052 | 19,047 | 19,050 | 19,047 | |||||||||||||||
| Retained earnings (deficit) |
(3,913 | ) | (4,000 | ) | (4,043 | ) | (4,047 | ) | (4,070 | ) | ||||||||||
| Treasury stock, at cost |
(1,397 | ) | (1,399 | ) | (1,400 | ) | (1,402 | ) | (1,405 | ) | ||||||||||
| Accumulated other comprehensive income (loss), net |
92 | (177 | ) | (387 | ) | (260 | ) | 208 | ||||||||||||
|
|
|
|
|
|
|
|
|
|
|
|||||||||||
| Total Stockholders’ Equity |
17,263 | 16,888 | 16,619 | 16,734 | 17,163 | |||||||||||||||
|
|
|
|
|
|
|
|
|
|
|
|||||||||||
| Total Liabilities and Stockholders’ Equity |
$ | 129,762 | $ | 130,908 | $ | 131,756 | $ | 132,351 | $ | 133,498 | ||||||||||
|
|
|
|
|
|
|
|
|
|
|
|||||||||||
| Regions Financial Corporation and Subsidiaries Financial Supplement to Third Quarter 2011 Earnings Release |
Page 2 |
Consolidated Statements of Operations (unaudited)
| Quarter Ended | ||||||||||||||||||||
| ($ amounts in millions, except per share data) |
9/30/11 | 6/30/11 | 3/31/11 | 12/31/10 | 9/30/10 | |||||||||||||||
| Interest income on: |
||||||||||||||||||||
| Loans, including fees |
$ | 867 | $ | 856 | $ | 867 | $ | 911 | $ | 919 | ||||||||||
| Securities: |
||||||||||||||||||||
| Taxable |
177 | 208 | 207 | 193 | 214 | |||||||||||||||
| Tax-exempt |
— | — | — | — | — | |||||||||||||||
|
|
|
|
|
|
|
|
|
|
|
|||||||||||
| Total securities |
177 | 208 | 207 | 193 | 214 | |||||||||||||||
| Loans held for sale |
7 | 9 | 13 | 12 | 10 | |||||||||||||||
| Trading account assets |
6 | 6 | 7 | 12 | 8 | |||||||||||||||
| Other interest-earning assets |
7 | 7 | 6 | 8 | 7 | |||||||||||||||
|
|
|
|
|
|
|
|
|
|
|
|||||||||||
| Total interest income |
1,064 | 1,086 | 1,100 | 1,136 | 1,158 | |||||||||||||||
| Interest expense on: |
||||||||||||||||||||
| Deposits |
112 | 126 | 139 | 152 | 167 | |||||||||||||||
| Short-term borrowings |
1 | 2 | 3 | 2 | 3 | |||||||||||||||
| Long-term borrowings |
93 | 94 | 95 | 105 | 120 | |||||||||||||||
|
|
|
|
|
|
|
|
|
|
|
|||||||||||
| Total interest expense |
206 | 222 | 237 | 259 | 290 | |||||||||||||||
|
|
|
|
|
|
|
|
|
|
|
|||||||||||
| Net interest income |
858 | 864 | 863 | 877 | 868 | |||||||||||||||
| Provision for loan losses |
355 | 398 | 482 | 682 | 760 | |||||||||||||||
|
|
|
|
|
|
|
|
|
|
|
|||||||||||
| Net interest income after provision for loan losses |
503 | 466 | 381 | 195 | 108 | |||||||||||||||
| Non-interest income: |
||||||||||||||||||||
| Service charges on deposit accounts |
310 | 308 | 287 | 290 | 294 | |||||||||||||||
| Brokerage, investment banking and capital markets |
217 | 248 | 267 | 312 | 257 | |||||||||||||||
| Mortgage income |
68 | 50 | 45 | 51 | 66 | |||||||||||||||
| Trust department income |
49 | 51 | 50 | 50 | 49 | |||||||||||||||
| Securities gains (losses), net |
(1 | ) | 24 | 82 | 333 | 2 | ||||||||||||||
| Other |
102 | 100 | 112 | 177 | 82 | |||||||||||||||
|
|
|
|
|
|
|
|
|
|
|
|||||||||||
| Total non-interest income |
745 | 781 | 843 | 1,213 | 750 | |||||||||||||||
| Non-interest expense: |
||||||||||||||||||||
| Salaries and employee benefits |
529 | 561 | 594 | 601 | 582 | |||||||||||||||
| Net occupancy expense |
104 | 107 | 109 | 108 | 110 | |||||||||||||||
| Furniture and equipment expense |
77 | 79 | 77 | 76 | 75 | |||||||||||||||
| Other |
356 | 451 | 387 | 481 | 396 | |||||||||||||||
|
|
|
|
|
|
|
|
|
|
|
|||||||||||
| Total non-interest expense |
1,066 | 1,198 | 1,167 | 1,266 | 1,163 | |||||||||||||||
|
|
|
|
|
|
|
|
|
|
|
|||||||||||
| Income (loss) before income taxes |
182 | 49 | 57 | 142 | (305 | ) | ||||||||||||||
| Income tax expense (benefit) |
27 | (60 | ) | (12 | ) | 53 | (150 | ) | ||||||||||||
|
|
|
|
|
|
|
|
|
|
|
|||||||||||
| Net income (loss) |
$ | 155 | $ | 109 | $ | 69 | $ | 89 | $ | (155 | ) | |||||||||
|
|
|
|
|
|
|
|
|
|
|
|||||||||||
| Net income (loss) available to common shareholders |
$ | 101 | $ | 55 | $ | 17 | $ | 36 | $ | (209 | ) | |||||||||
|
|
|
|
|
|
|
|
|
|
|
|||||||||||
| Weighted-average shares outstanding—during quarter: |
||||||||||||||||||||
| Basic |
1,259 | 1,258 | 1,257 | 1,257 | 1,257 | |||||||||||||||
| Diluted |
1,261 | 1,260 | 1,259 | 1,259 | 1,257 | |||||||||||||||
| Actual shares outstanding—end of quarter |
1,259 | 1,259 | 1,256 | 1,256 | 1,256 | |||||||||||||||
| Earnings (loss) per common share (1): |
||||||||||||||||||||
| Basic |
$ | 0.08 | $ | 0.04 | $ | 0.01 | $ | 0.03 | $ | (0.17 | ) | |||||||||
| Diluted |
$ | 0.08 | $ | 0.04 | $ | 0.01 | $ | 0.03 | $ | (0.17 | ) | |||||||||
| Cash dividends declared per common share |
$ | 0.01 | $ | 0.01 | $ | 0.01 | $ | 0.01 | $ | 0.01 | ||||||||||
| Taxable-equivalent net interest income from continuing operations |
$ | 866 | $ | 872 | $ | 872 | $ | 886 | $ | 876 | ||||||||||
| (1) | Includes preferred stock dividends |
| Regions Financial Corporation and Subsidiaries Financial Supplement to Third Quarter 2011 Earnings Release |
Page 3 |
Selected Ratios and Other Information
| As of and for Quarter Ended | ||||||||||||||||||||
| 9/30/11 | 6/30/11 | 3/31/11 | 12/31/10 | 9/30/10 | ||||||||||||||||
| Return on average assets* |
0.31 | % | 0.17 | % | 0.05 | % | 0.11 | % | (0.62 | %) | ||||||||||
| Return on average assets, excluding regulatory charge related tax benefit (non-GAAP)* |
0.31 | % | 0.03 | % | 0.05 | % | 0.11 | % | (0.62 | %) | ||||||||||
| Return on average common equity* |
2.92 | % | 1.66 | % | 0.51 | % | 1.04 | % | (5.91 | %) | ||||||||||
| Return on average tangible common equity (non-GAAP)* |
5.05 | % | 2.88 | % | 0.89 | % | 1.78 | % | (10.00 | %) | ||||||||||
| Return on average tangible common equity, excluding regulatory charge related tax benefit (non-GAAP)* |
5.05 | % | 0.57 | % | 0.89 | % | 1.78 | % | (10.00 | %) | ||||||||||
| Efficiency Ratio (non-GAAP) (3) |
66.0 | % | 68.8 | % | 71.3 | % | 72.0 | % | 71.6 | % | ||||||||||
| Common equity per share |
$ | 11.00 | $ | 10.71 | $ | 10.53 | $ | 10.62 | $ | 10.98 | ||||||||||
| Tangible common book value per share (non-GAAP) |
$ | 6.38 | $ | 6.15 | $ | 6.00 | $ | 6.09 | $ | 6.42 | ||||||||||
| Stockholders’ equity to total assets |
13.30 | % | 12.90 | % | 12.61 | % | 12.64 | % | 12.86 | % | ||||||||||
| Tangible common stockholders’ equity to tangible assets (non-GAAP) |
6.48 | % | 6.18 | % | 5.98 | % | 6.04 | % | 6.31 | % | ||||||||||
| Tier 1 Common risk-based ratio (non-GAAP) (1) |
8.2 | % | 7.9 | % | 7.9 | % | 7.9 | % | 7.6 | % | ||||||||||
| Tier 1 Capital (1) |
12.8 | % | 12.6 | % | 12.5 | % | 12.4 | % | 12.1 | % | ||||||||||
| Total Risk-Based Capital (1) |
16.6 | % | 16.2 | % | 16.5 | % | 16.4 | % | 16.0 | % | ||||||||||
| Allowance for credit losses as a percentage of loans, net of unearned income (2) |
3.84 | % | 3.95 | % | 4.01 | % | 3.93 | % | 3.86 | % | ||||||||||
| Allowance for loan losses as a percentage of loans, net of unearned income |
3.73 | % | 3.84 | % | 3.92 | % | 3.84 | % | 3.77 | % | ||||||||||
| Allowance for loan losses to non-performing loans, excluding loans held for sale |
1.09x | 1.12x | 1.03x | 1.01x | 0.94x | |||||||||||||||
| Net interest margin (FTE) |
3.02 | % | 3.05 | % | 3.07 | % | 3.00 | % | 2.96 | % | ||||||||||
| Loans, net of unearned income, to total deposits |
82.8 | % | 84.3 | % | 84.4 | % | 87.6 | % | 88.9 | % | ||||||||||
| Net charge-offs as a percentage of average loans* |
2.52 | % | 2.71 | % | 2.37 | % | 3.22 | % | 3.52 | % | ||||||||||
| Non-accrual loans, excluding loans held for sale as a percentage of loans |
3.41 | % | 3.43 | % | 3.79 | % | 3.81 | % | 3.99 | % | ||||||||||
| Non-performing assets (excluding loans 90 days past due) as a percentage of loans, foreclosed properties and non-performing loans held for sale |
4.23 | % | 4.39 | % | 4.78 | % | 4.69 | % | 4.96 | % | ||||||||||
| Non-performing assets (including loans 90 days past due) as a percentage of loans, foreclosed properties and non-performing loans held for sale |
4.75 | % | 4.98 | % | 5.42 | % | 5.38 | % | 5.65 | % | ||||||||||
| Associate headcount |
26,881 | 27,261 | 27,557 | 27,829 | 27,898 | |||||||||||||||
| Total branch outlets |
1,767 | 1,769 | 1,771 | 1,772 | 1,774 | |||||||||||||||
| ATMs |
2,130 | 2,132 | 2,144 | 2,148 | 2,150 | |||||||||||||||
| Morgan Keegan offices |
303 | 312 | 319 | 321 | 329 | |||||||||||||||
| * | Annualized |
| (1) | Current quarter Tier 1 Common, Tier 1 and Total Risk-Based Capital ratios are estimated |
| (2) | The allowance for credit losses reflects the allowance related to both loans on the balance sheet and exposure related to unfunded commitments and standby letters of credit |
| (3) | Efficiency ratio is shown on an operating basis and excludes adjustments as noted on page 19 in the Reconciliation to GAAP Financial Measures schedule |
| Regions Financial Corporation and Subsidiaries Financial Supplement to Third Quarter 2011 Earnings Release |
Page 4 |
Consolidated Average Daily Balances and Yield/Rate Analysis
| Quarter Ended | ||||||||||||||||||||||||
| 9/30/11 | 6/30/11 | |||||||||||||||||||||||
| Average | Income/ | Yield/ | Average | Income/ | Yield/ | |||||||||||||||||||
| ($ amounts in millions; yields on taxable-equivalent basis) |
Balance | Expense | Rate | Balance | Expense | Rate | ||||||||||||||||||
| Assets |
||||||||||||||||||||||||
| Interest-earning assets: |
||||||||||||||||||||||||
| Federal funds sold and securities purchased under agreements to resell |
$ | 214 | $ | — | — | % | $ | 302 | $ | — | — | % | ||||||||||||
| Trading account assets |
1,181 | 6 | 2.02 | 1,192 | 7 | 2.36 | ||||||||||||||||||
| Securities: |
||||||||||||||||||||||||
| Taxable |
24,100 | 177 | 2.91 | 24,768 | 208 | 3.37 | ||||||||||||||||||
| Tax-exempt |
31 | — | — | 33 | — | — | ||||||||||||||||||
| Loans held for sale |
847 | 7 | 3.28 | 1,141 | 9 | 3.16 | ||||||||||||||||||
| Loans, net of unearned income |
80,513 | 875 | 4.31 | 81,106 | 863 | 4.27 | ||||||||||||||||||
| Other interest-earning assets |
6,933 | 7 | 0.40 | 6,073 | 7 | 0.46 | ||||||||||||||||||
|
|
|
|
|
|
|
|
|
|
|
|
|
|||||||||||||
| Total interest-earning assets |
113,819 | 1,072 | 3.74 | 114,615 | 1,094 | 3.83 | ||||||||||||||||||
| Allowance for loan losses |
(3,150 | ) | (3,200 | ) | ||||||||||||||||||||
| Cash and due from banks |
2,212 | 2,247 | ||||||||||||||||||||||
| Other non-earning assets |
16,878 | 17,016 | ||||||||||||||||||||||
|
|
|
|
|
|||||||||||||||||||||
| $ | 129,759 | $ | 130,678 | |||||||||||||||||||||
|
|
|
|
|
|||||||||||||||||||||
| Liabilities and Stockholders’ Equity |
||||||||||||||||||||||||
| Interest-bearing liabilities: |
||||||||||||||||||||||||
| Savings accounts |
$ | 5,148 | 1 | 0.08 | $ | 5,107 | 1 | 0.08 | ||||||||||||||||
| Interest-bearing transaction accounts |
16,651 | 7 | 0.17 | 13,898 | 7 | 0.20 | ||||||||||||||||||
| Money market accounts |
24,571 | 18 | 0.29 | 26,805 | 20 | 0.30 | ||||||||||||||||||
| Time deposits |
21,369 | 86 | 1.60 | 22,506 | 98 | 1.75 | ||||||||||||||||||
|
|
|
|
|
|
|
|
|
|
|
|
|
|||||||||||||
| Total interest-bearing deposits (1) |
67,739 | 112 | 0.66 | 68,316 | 126 | 0.74 | ||||||||||||||||||
| Federal funds purchased and securities sold under agreements to repurchase |
1,823 | — | — | 2,009 | 1 | 0.20 | ||||||||||||||||||
| Other short-term borrowings |
816 | 1 | 0.49 | 798 | 1 | 0.50 | ||||||||||||||||||
| Long-term borrowings |
10,786 | 93 | 3.42 | 11,756 | 94 | 3.21 | ||||||||||||||||||
|
|
|
|
|
|
|
|
|
|
|
|
|
|||||||||||||
| Total interest-bearing liabilities |
81,164 | 206 | 1.01 | 82,879 | 222 | 1.07 | ||||||||||||||||||
|
|
|
|||||||||||||||||||||||
| Net interest spread |
2.73 | 2.76 | ||||||||||||||||||||||
|
|
|
|
|
|||||||||||||||||||||
| Non-interest-bearing deposits (1) |
28,408 | 27,806 | ||||||||||||||||||||||
| Other liabilities |
3,118 | 3,197 | ||||||||||||||||||||||
| Stockholders’ equity |
17,069 | 16,796 | ||||||||||||||||||||||
|
|
|
|
|
|||||||||||||||||||||
| $ | 129,759 | $ | 130,678 | |||||||||||||||||||||
|
|
|
|
|
|||||||||||||||||||||
| Net interest income/margin FTE basis |
$ | 866 | 3.02 | % | $ | 872 | 3.05 | % | ||||||||||||||||
|
|
|
|
|
|
|
|
|
|||||||||||||||||
| (1) | Total deposit costs may be calculated by dividing total interest expense on deposits by the sum of interest-bearing deposits and non-interest bearing deposits. The rates for total deposit costs equal 0.46% and 0.53% for the quarters ended September 30, 2011 and June 30, 2011, respectively. |
| Regions Financial Corporation and Subsidiaries Financial Supplement to Third Quarter 2011 Earnings Release |
Page 5 |
Consolidated Average Daily Balances and Yield/Rate Analysis
| Quarter Ended | ||||||||||||||||||||||||||||||||||||
| 3/31/11 | 12/31/10 | 9/30/10 | ||||||||||||||||||||||||||||||||||
| Average | Income/ | Yield/ | Average | Income/ | Yield/ | Average | Income/ | Yield/ | ||||||||||||||||||||||||||||
| ($ amounts in millions; yields on taxable-equivalent basis) |
Balance | Expense | Rate | Balance | Expense | Rate | Balance | Expense | Rate | |||||||||||||||||||||||||||
| Assets |
||||||||||||||||||||||||||||||||||||
| Interest-earning assets: |
||||||||||||||||||||||||||||||||||||
| Federal funds sold and securities purchased under agreements to resell |
$ | 305 | $ | — | — | % | $ | 952 | $ | 1 | 0.42 | % | $ | 1,096 | $ | 1 | 0.36 | % | ||||||||||||||||||
| Trading account assets |
1,162 | 8 | 2.79 | 1,255 | 13 | 4.11 | 1,214 | 9 | 2.94 | |||||||||||||||||||||||||||
| Securities: |
||||||||||||||||||||||||||||||||||||
| Taxable |
24,758 | 207 | 3.39 | 23,878 | 193 | 3.21 | 23,863 | 214 | 3.56 | |||||||||||||||||||||||||||
| Tax-exempt |
30 | — | — | 47 | — | — | 39 | — | — | |||||||||||||||||||||||||||
| Loans held for sale |
1,486 | 13 | 3.55 | 1,486 | 12 | 3.20 | 1,213 | 10 | 3.27 | |||||||||||||||||||||||||||
| Loans, net of unearned income |
82,412 | 875 | 4.31 | 84,108 | 920 | 4.34 | 85,616 | 926 | 4.29 | |||||||||||||||||||||||||||
| Other interest-earning assets |
4,989 | 6 | 0.49 | 5,188 | 6 | 0.46 | 4,308 | 6 | 0.55 | |||||||||||||||||||||||||||
|
|
|
|
|
|
|
|
|
|
|
|
|
|
|
|
|
|
|
|||||||||||||||||||
| Total interest-earning assets |
115,142 | 1,109 | 3.91 | 116,914 | 1,145 | 3.89 | 117,349 | 1,166 | 3.94 | |||||||||||||||||||||||||||
| Allowance for loan losses |
(3,209 | ) | (3,164 | ) | (3,223 | ) | ||||||||||||||||||||||||||||||
| Cash and due from banks |
2,164 | 2,069 | 2,059 | |||||||||||||||||||||||||||||||||
| Other non-earning assets |
17,115 | 17,515 | 17,544 | |||||||||||||||||||||||||||||||||
|
|
|
|
|
|
|
|||||||||||||||||||||||||||||||
| $ | 131,212 | $ | 133,334 | $ | 133,729 | |||||||||||||||||||||||||||||||
|
|
|
|
|
|
|
|||||||||||||||||||||||||||||||
| Liabilities and Stockholders’ Equity |
||||||||||||||||||||||||||||||||||||
| Interest-bearing liabilities: |
||||||||||||||||||||||||||||||||||||
| Savings accounts |
$ | 4,837 | 1 | 0.08 | $ | 4,622 | 1 | 0.09 | $ | 4,517 | 1 | 0.09 | ||||||||||||||||||||||||
| Interest-bearing transaction accounts |
13,228 | 7 | 0.21 | 12,690 | 6 | 0.19 | 13,606 | 7 | 0.20 | |||||||||||||||||||||||||||
| Money market accounts |
27,816 | 21 | 0.31 | 28,273 | 23 | 0.32 | 28,088 | 22 | 0.31 | |||||||||||||||||||||||||||
| Time deposits |
22,971 | 110 | 1.94 | 23,369 | 122 | 2.07 | 25,161 | 137 | 2.16 | |||||||||||||||||||||||||||
|
|
|
|
|
|
|
|
|
|
|
|
|
|
|
|
|
|
|
|||||||||||||||||||
| Total interest-bearing deposits (1) |
68,852 | 139 | 0.82 | 68,954 | 152 | 0.87 | 71,372 | 167 | 0.93 | |||||||||||||||||||||||||||
| Federal funds purchased and securities sold under agreements to repurchase |
2,167 | 1 | 0.19 | 3,162 | — | — | 2,176 | 1 | 0.18 | |||||||||||||||||||||||||||
| Other short-term borrowings |
1,068 | 2 | 0.76 | 1,056 | 2 | 0.75 | 866 | 2 | 0.92 | |||||||||||||||||||||||||||
| Long-term borrowings |
12,891 | 95 | 2.99 | 14,006 | 105 | 2.97 | 14,878 | 120 | 3.20 | |||||||||||||||||||||||||||
|
|
|
|
|
|
|
|
|
|
|
|
|
|
|
|
|
|
|
|||||||||||||||||||
| Total interest-bearing liabilities |
84,978 | 237 | 1.13 | 87,178 | 259 | 1.18 | 89,292 | 290 | 1.29 | |||||||||||||||||||||||||||
|
|
|
|
|
|
|
|||||||||||||||||||||||||||||||
| Net interest spread |
2.78 | 2.71 | 2.65 | |||||||||||||||||||||||||||||||||
|
|
|
|
|
|
|
|||||||||||||||||||||||||||||||
| Non-interest-bearing deposits (1) |
26,405 | 25,688 | 23,706 | |||||||||||||||||||||||||||||||||
| Other liabilities |
3,145 | 3,422 | 3,349 | |||||||||||||||||||||||||||||||||
| Stockholders’ equity |
16,684 | 17,046 | 17,382 | |||||||||||||||||||||||||||||||||
|
|
|
|
|
|
|
|||||||||||||||||||||||||||||||
| $ | 131,212 | $ | 133,334 | $ | 133,729 | |||||||||||||||||||||||||||||||
|
|
|
|
|
|
|
|||||||||||||||||||||||||||||||
| Net interest income/margin FTE basis |
$ | 872 | 3.07 | % | $ | 886 | 3.00 | % | $ | 876 | 2.96 | % | ||||||||||||||||||||||||
|
|
|
|
|
|
|
|
|
|
|
|
|
|||||||||||||||||||||||||
| (1) | Total deposit costs may be calculated by dividing total interest expense on deposits by the sum of interest-bearing deposits and non-interest bearing deposits. The rates for total deposit costs equal 0.59%, 0.64% and 0.70% for the quarters ended March 31, 2011, December 31, 2010 and September 30, 2010, respectively. |
| Regions Financial Corporation and Subsidiaries Financial Supplement to Third Quarter 2011 Earnings Release |
Page 6 |
Loans
| Quarter Ended | ||||||||||||||||||||||||||||||||||||
| ($ amounts in millions) |
9/30/11 | 6/30/11 | 3/31/11 | 12/31/10 | 9/30/10 | 9/30/11 vs. 6/30/11 |
9/30/11 vs. 9/30/10 |
|||||||||||||||||||||||||||||
| Commercial and industrial |
$ | 24,273 | $ | 23,644 | $ | 23,149 | $ | 22,540 | $ | 21,501 | $ | 629 | 2.7 | % | $ | 2,772 | 12.9 | % | ||||||||||||||||||
| Commercial real estate mortgage—owner-occupied |
11,537 | 11,797 | 11,889 | 12,046 | 11,850 | (260 | ) | -2.2 | % | (313 | ) | -2.6 | % | |||||||||||||||||||||||
| Commercial real estate construction—owner-occupied |
356 | 377 | 430 | 470 | 522 | (21 | ) | -5.6 | % | (166 | ) | -31.8 | % | |||||||||||||||||||||||
|
|
|
|
|
|
|
|
|
|
|
|
|
|
|
|
|
|
|
|||||||||||||||||||
| Total commercial |
36,166 | 35,818 | 35,468 | 35,056 | 33,873 | 348 | 1.0 | % | 2,293 | 6.8 | % | |||||||||||||||||||||||||
| Commercial investor real estate mortgage |
10,696 | 11,836 | 12,932 | 13,621 | 14,489 | (1,140 | ) | -9.6 | % | (3,793 | ) | -26.2 | % | |||||||||||||||||||||||
| Commercial investor real estate construction |
1,188 | 1,595 | 1,895 | 2,287 | 2,975 | (407 | ) | -25.5 | % | (1,787 | ) | -60.1 | % | |||||||||||||||||||||||
|
|
|
|
|
|
|
|
|
|
|
|
|
|
|
|
|
|
|
|||||||||||||||||||
| Total investor real estate |
11,884 | 13,431 | 14,827 | 15,908 | 17,464 | (1,547 | ) | -11.5 | % | (5,580 | ) | -32.0 | % | |||||||||||||||||||||||
| Residential first mortgage |
14,083 | 14,306 | 14,404 | 14,898 | 15,723 | (223 | ) | -1.6 | % | (1,640 | ) | -10.4 | % | |||||||||||||||||||||||
| Home equity—first lien |
5,954 | 6,011 | 6,100 | 6,213 | 6,278 | (57 | ) | -0.9 | % | (324 | ) | -5.2 | % | |||||||||||||||||||||||
| Home equity—second lien |
7,362 | 7,582 | 7,774 | 8,013 | 8,256 | (220 | ) | -2.9 | % | (894 | ) | -10.8 | % | |||||||||||||||||||||||
| Indirect |
1,774 | 1,704 | 1,626 | 1,592 | 1,657 | 70 | 4.1 | % | 117 | 7.1 | % | |||||||||||||||||||||||||
| Consumer credit card |
1,024 | 1,134 | — | — | — | (110 | ) | -9.7 | % | 1,024 | NM | |||||||||||||||||||||||||
| Other consumer |
1,200 | 1,190 | 1,172 | 1,184 | 1,169 | 10 | 0.8 | % | 31 | 2.7 | % | |||||||||||||||||||||||||
|
|
|
|
|
|
|
|
|
|
|
|
|
|
|
|
|
|
|
|||||||||||||||||||
| Total Loans |
$ | 79,447 | $ | 81,176 | $ | 81,371 | $ | 82,864 | $ | 84,420 | $ | (1,729 | ) | -2.1 | % | $ | (4,973 | ) | -5.9 | % | ||||||||||||||||
|
|
|
|
|
|
|
|
|
|
|
|
|
|
|
|
|
|
|
|||||||||||||||||||
| Average Balances | ||||||||||||||||||||||||||||||||||||
| ($ amounts in millions) |
3Q11 | 2Q11 | 1Q11 | 4Q10 | 3Q10 | 3Q11 vs. 2Q11 |
3Q11 vs. 3Q10 |
|||||||||||||||||||||||||||||
| Commercial and industrial |
$ | 23,953 | $ | 23,506 | $ | 22,889 | $ | 21,956 | $ | 21,313 | $ | 447 | 1.9 | % | $ | 2,640 | 12.4 | % | ||||||||||||||||||
| Commercial real estate mortgage—owner-occupied |
11,661 | 11,826 | 12,012 | 11,944 | 11,944 | (165 | ) | -1.4 | % | (283 | ) | -2.4 | % | |||||||||||||||||||||||
| Commercial real estate construction—owner-occupied |
375 | 404 | 438 | 503 | 516 | (29 | ) | -7.2 | % | (141 | ) | -27.3 | % | |||||||||||||||||||||||
|
|
|
|
|
|
|
|
|
|
|
|
|
|
|
|
|
|
|
|||||||||||||||||||
| Total commercial |
35,989 | 35,736 | 35,339 | 34,403 | 33,773 | 253 | 0.7 | % | 2,216 | 6.6 | % | |||||||||||||||||||||||||
| Commercial investor real estate mortgage |
11,395 | 12,607 | 13,393 | 14,223 | 15,090 | (1,212 | ) | -9.6 | % | (3,695 | ) | -24.5 | % | |||||||||||||||||||||||
| Commercial investor real estate construction |
1,411 | 1,805 | 2,100 | 2,649 | 3,477 | (394 | ) | -21.8 | % | (2,066 | ) | -59.4 | % | |||||||||||||||||||||||
|
|
|
|
|
|
|
|
|
|
|
|
|
|
|
|
|
|
|
|||||||||||||||||||
| Total investor real estate |
12,806 | 14,412 | 15,493 | 16,872 | 18,567 | (1,606 | ) | -11.1 | % | (5,761 | ) | -31.0 | % | |||||||||||||||||||||||
| Residential first mortgage |
14,207 | 14,329 | 14,692 | 15,620 | 15,632 | (122 | ) | -0.9 | % | (1,425 | ) | -9.1 | % | |||||||||||||||||||||||
| Home equity—first lien |
6,003 | 6,066 | 6,162 | 6,262 | 6,326 | (63 | ) | -1.0 | % | (323 | ) | -5.1 | % | |||||||||||||||||||||||
| Home equity—second lien |
7,451 | 7,678 | 7,891 | 8,127 | 8,358 | (227 | ) | -3.0 | % | (907 | ) | -10.9 | % | |||||||||||||||||||||||
| Indirect |
1,755 | 1,681 | 1,628 | 1,606 | 1,776 | 74 | 4.4 | % | (21 | ) | -1.2 | % | ||||||||||||||||||||||||
| Consumer credit card |
1,095 | 13 | — | — | — | 1,082 | NM | 1,095 | NM | |||||||||||||||||||||||||||
| Other consumer |
1,207 | 1,191 | 1,207 | 1,218 | 1,184 | 16 | 1.3 | % | 23 | 1.9 | % | |||||||||||||||||||||||||
|
|
|
|
|
|
|
|
|
|
|
|
|
|
|
|
|
|
|
|||||||||||||||||||
| Total Loans |
$ | 80,513 | $ | 81,106 | $ | 82,412 | $ | 84,108 | $ | 85,616 | $ | (593 | ) | -0.7 | % | $ | (5,103 | ) | -6.0 | % | ||||||||||||||||
|
|
|
|
|
|
|
|
|
|
|
|
|
|
|
|
|
|
|
|||||||||||||||||||
Deposits
| Quarter Ended | ||||||||||||||||||||||||||||||||||||
| ($ amounts in millions) |
9/30/11 | 6/30/11 | 3/31/11 | 12/31/10 | 9/30/10 | 9/30/11 vs. 6/30/11 |
9/30/11 vs. 9/30/10 |
|||||||||||||||||||||||||||||
| Customer Deposits |
||||||||||||||||||||||||||||||||||||
| Interest-free deposits |
$ | 28,296 | $ | 28,148 | $ | 27,480 | $ | 25,733 | $ | 25,300 | $ | 148 | 0.5 | % | $ | 2,996 | 11.8 | % | ||||||||||||||||||
| Interest-bearing checking |
18,317 | 15,982 | 13,365 | 13,423 | 12,409 | 2,335 | 14.6 | % | 5,908 | 47.6 | % | |||||||||||||||||||||||||
| Savings |
5,155 | 5,118 | 5,064 | 4,668 | 4,544 | 37 | 0.7 | % | 611 | 13.4 | % | |||||||||||||||||||||||||
| Money market—domestic |
23,284 | 24,650 | 27,261 | 27,420 | 27,983 | (1,366 | ) | -5.5 | % | (4,699 | ) | -16.8 | % | |||||||||||||||||||||||
| Money market—foreign |
423 | 476 | 533 | 569 | 509 | (53 | ) | -11.1 | % | (86 | ) | -16.9 | % | |||||||||||||||||||||||
|
|
|
|
|
|
|
|
|
|
|
|
|
|
|
|
|
|
|
|||||||||||||||||||
| Low-cost deposits |
75,475 | 74,374 | 73,703 | 71,813 | 70,745 | 1,101 | 1.5 | % | 4,730 | 6.7 | % | |||||||||||||||||||||||||
| Time deposits |
20,455 | 21,947 | 22,656 | 22,784 | 24,177 | (1,492 | ) | -6.8 | % | (3,722 | ) | -15.4 | % | |||||||||||||||||||||||
|
|
|
|
|
|
|
|
|
|
|
|
|
|
|
|
|
|
|
|||||||||||||||||||
| Total customer deposits |
95,930 | 96,321 | 96,359 | 94,597 | 94,922 | (391 | ) | -0.4 | % | 1,008 | 1.1 | % | ||||||||||||||||||||||||
|
|
|
|
|
|
|
|
|
|
|
|
|
|
|
|
|
|
|
|||||||||||||||||||
| Corporate Treasury Deposits |
||||||||||||||||||||||||||||||||||||
| Time deposits |
8 | 10 | 10 | 17 | 56 | (2 | ) | -20.0 | % | (48 | ) | -85.7 | % | |||||||||||||||||||||||
|
|
|
|
|
|
|
|
|
|
|
|
|
|
|
|
|
|
|
|||||||||||||||||||
| Total Deposits |
$ | 95,938 | $ | 96,331 | $ | 96,369 | $ | 94,614 | $ | 94,978 | $ | (393 | ) | -0.4 | % | $ | 960 | 1.0 | % | |||||||||||||||||
|
|
|
|
|
|
|
|
|
|
|
|
|
|
|
|
|
|
|
|||||||||||||||||||
| Average Balances | ||||||||||||||||||||||||||||||||||||
| ($ amounts in millions) |
3Q11 | 2Q11 | 1Q11 | 4Q10 | 3Q10 | 3Q11 vs. 2Q11 |
3Q11 vs. 3Q10 |
|||||||||||||||||||||||||||||
| Customer Deposits |
||||||||||||||||||||||||||||||||||||
| Interest-free deposits |
$ | 28,408 | $ | 27,806 | $ | 26,405 | $ | 25,688 | $ | 23,706 | $ | 602 | 2.2 | % | $ | 4,702 | 19.8 | % | ||||||||||||||||||
| Interest-bearing checking |
16,651 | 13,898 | 13,228 | 12,690 | 13,606 | 2,753 | 19.8 | % | 3,045 | 22.4 | % | |||||||||||||||||||||||||
| Savings |
5,148 | 5,107 | 4,837 | 4,622 | 4,517 | 41 | 0.8 | % | 631 | 14.0 | % | |||||||||||||||||||||||||
| Money market—domestic |
24,098 | 26,302 | 27,276 | 27,767 | 27,574 | (2,204 | ) | -8.4 | % | (3,476 | ) | -12.6 | % | |||||||||||||||||||||||
| Money market—foreign |
473 | 503 | 540 | 506 | 514 | (30 | ) | -6.0 | % | (41 | ) | -8.0 | % | |||||||||||||||||||||||
|
|
|
|
|
|
|
|
|
|
|
|
|
|
|
|
|
|
|
|||||||||||||||||||
| Low-cost deposits |
74,778 | 73,616 | 72,286 | 71,273 | 69,917 | 1,162 | 1.6 | % | 4,861 | 7.0 | % | |||||||||||||||||||||||||
| Time deposits |
21,359 | 22,496 | 22,956 | 23,347 | 25,100 | (1,137 | ) | -5.1 | % | (3,741 | ) | -14.9 | % | |||||||||||||||||||||||
|
|
|
|
|
|
|
|
|
|
|
|
|
|
|
|
|
|
|
|||||||||||||||||||
| Total customer deposits |
96,137 | 96,112 | 95,242 | 94,620 | 95,017 | 25 | 0.0 | % | 1,120 | 1.2 | % | |||||||||||||||||||||||||
|
|
|
|
|
|
|
|
|
|
|
|
|
|
|
|
|
|
|
|||||||||||||||||||
| Corporate Treasury Deposits |
||||||||||||||||||||||||||||||||||||
| Time deposits |
10 | 10 | 15 | 22 | 61 | — | NM | (51 | ) | -83.6 | % | |||||||||||||||||||||||||
|
|
|
|
|
|
|
|
|
|
|
|
|
|
|
|
|
|
|
|||||||||||||||||||
| Total Deposits |
$ | 96,147 | $ | 96,122 | $ | 95,257 | $ | 94,642 | $ | 95,078 | $ | 25 | 0.0 | % | $ | 1,069 | 1.1 | % | ||||||||||||||||||
|
|
|
|
|
|
|
|
|
|
|
|
|
|
|
|
|
|
|
|||||||||||||||||||
| Regions Financial Corporation and Subsidiaries Financial Supplement to Third Quarter 2011 Earnings Release |
Page 7 |
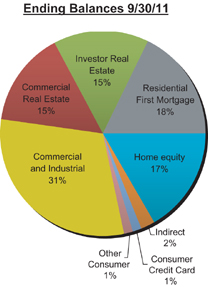
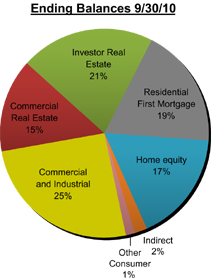
Loan Portfolio Mix
|
|
Loan Portfolio Balances by Percentage
| Quarter Ended | ||||||||||||||||||||
| 9/30/11 | 6/30/11 | 3/31/11 | 12/31/10 | 9/30/10 | ||||||||||||||||
| Commercial and industrial |
30.6 | % | 29.1 | % | 28.5 | % | 27.2 | % | 25.5 | % | ||||||||||
| Commercial real estate mortgage—OO |
14.5 | % | 14.5 | % | 14.6 | % | 14.5 | % | 14.0 | % | ||||||||||
| Commercial real estate construction—OO |
0.4 | % | 0.5 | % | 0.5 | % | 0.6 | % | 0.6 | % | ||||||||||
|
|
|
|
|
|
|
|
|
|
|
|||||||||||
| Total commercial |
45.5 | % | 44.1 | % | 43.6 | % | 42.3 | % | 40.1 | % | ||||||||||
| Commercial investor real estate mortgage |
13.5 | % | 14.6 | % | 15.9 | % | 16.4 | % | 17.2 | % | ||||||||||
| Commercial investor real estate construction |
1.5 | % | 2.0 | % | 2.3 | % | 2.8 | % | 3.5 | % | ||||||||||
|
|
|
|
|
|
|
|
|
|
|
|||||||||||
| Total investor real estate |
15.0 | % | 16.6 | % | 18.2 | % | 19.2 | % | 20.7 | % | ||||||||||
| Residential first mortgage |
17.7 | % | 17.6 | % | 17.7 | % | 18.0 | % | 18.6 | % | ||||||||||
| Home equity |
16.8 | % | 16.7 | % | 17.1 | % | 17.2 | % | 17.2 | % | ||||||||||
| Indirect |
2.2 | % | 2.1 | % | 2.0 | % | 1.9 | % | 2.0 | % | ||||||||||
| Consumer credit card |
1.3 | % | 1.4 | % | 0.0 | % | 0.0 | % | 0.0 | % | ||||||||||
| Other consumer |
1.5 | % | 1.5 | % | 1.4 | % | 1.4 | % | 1.4 | % | ||||||||||
|
|
|
|
|
|
|
|
|
|
|
|||||||||||
| Total Loans |
100.0 | % | 100.0 | % | 100.0 | % | 100.0 | % | 100.0 | % | ||||||||||
|
|
|
|
|
|
|
|
|
|
|
|||||||||||
OO = Owner Occupied
| Regions Financial Corporation and Subsidiaries Financial Supplement to Third Quarter 2011 Earnings Release |
Page 8 |
Pre-Tax Pre-Provision Income
| Quarter Ended | ||||||||||||||||||||||||||||||||||||
| 3Q11 | 3Q11 | |||||||||||||||||||||||||||||||||||
| ($ amounts in millions) |
9/30/11 | 6/30/11 | 3/31/11 | 12/31/10 | 9/30/10 | vs. 2Q11 | vs. 3Q10 | |||||||||||||||||||||||||||||
| Net Interest Income (GAAP) |
$ | 858 | $ | 864 | $ | 863 | $ | 877 | $ | 868 | $ | (6 | ) | -0.7 | % | $ | (10 | ) | -1.2 | % | ||||||||||||||||
| Non-Interest Income (GAAP) |
745 | 781 | 843 | 1,213 | 750 | (36 | ) | -4.6 | % | (5 | ) | -0.7 | % | |||||||||||||||||||||||
|
|
|
|
|
|
|
|
|
|
|
|
|
|
|
|
|
|
|
|||||||||||||||||||
| Total Revenue (GAAP) |
1,603 | 1,645 | 1,706 | 2,090 | 1,618 | (42 | ) | -2.6 | % | (15 | ) | -0.9 | % | |||||||||||||||||||||||
| Non-Interest Expense (GAAP) |
1,066 | 1,198 | 1,167 | 1,266 | 1,163 | (132 | ) | -11.0 | % | (97 | ) | -8.3 | % | |||||||||||||||||||||||
|
|
|
|
|
|
|
|
|
|
|
|
|
|
|
|
|
|
|
|||||||||||||||||||
| Pre-tax Pre-provision Income (GAAP) |
537 | 447 | 539 | 824 | 455 | 90 | 20.1 | % | 82 | 18.0 | % | |||||||||||||||||||||||||
| Adjustments: |
||||||||||||||||||||||||||||||||||||
| Securities (gains) losses, net |
1 | (24 | ) | (82 | ) | (333 | ) | (2 | ) | 25 | NM | 3 | NM | |||||||||||||||||||||||
| Loss (gain) on sale of mortgage loans |
— | — | 3 | (26 | ) | — | — | — | — | — | ||||||||||||||||||||||||||
| Leveraged lease termination (gains) losses, net |
2 | — | — | (59 | ) | — | 2 | — | 2 | — | ||||||||||||||||||||||||||
| Loss on early extinguishment of debt |
— | — | — | 55 | — | — | — | — | — | |||||||||||||||||||||||||||
| Securities impairment, net |
— | — | — | — | 1 | — | — | (1 | ) | NM | ||||||||||||||||||||||||||
| Branch consolidation and equipment costs |
— | 77 | — | — | — | (77 | ) | — | — | — | ||||||||||||||||||||||||||
|
|
|
|
|
|
|
|
|
|
|
|
|
|
|
|
|
|
|
|||||||||||||||||||
| Total adjustments |
3 | 53 | (79 | ) | (363 | ) | (1 | ) | (50 | ) | -94.3 | % | 4 | NM | ||||||||||||||||||||||
|
|
|
|
|
|
|
|
|
|
|
|
|
|
|
|
|
|
|
|||||||||||||||||||
| Adjusted Pre-tax Pre-provision Income (non-GAAP) |
$ | 540 | $ | 500 | $ | 460 | $ | 461 | $ | 454 | $ | 40 | 8.0 | % | $ | 86 | 18.9 | % | ||||||||||||||||||
|
|
|
|
|
|
|
|
|
|
|
|
|
|
|
|
|
|
|
|||||||||||||||||||
The Pre-Tax Pre-Provision Income table above presents computations of pre-tax pre-provision income excluding certain adjustments (non-GAAP). Regions believes that the exclusion of these adjustments provides a meaningful base for period-to-period comparisons, which management believes will assist investors in analyzing the operating results of the Company and predicting future performance. These non-GAAP financial measures are also used by management to assess the performance of Regions’ business. It is possible that the activities related to the adjustments may recur; however, management does not consider the activities related to the adjustments to be indications of ongoing operations. Regions believes that presentation of these non-GAAP financial measures will permit investors to assess the performance of the Company on the same basis as that applied by management. Non-GAAP financial measures have inherent limitations, are not required to be uniformly applied and are not audited. Although these non-GAAP financial measures are frequently used by stakeholders in the evaluation of a company, they have limitations as analytical tools, and should not be considered in isolation, or as a substitute for analyses of results as reported under GAAP. In particular, a measure of income that excludes certain adjustments does not represent the amount that effectively accrues directly to stockholders.
| Regions Financial Corporation and Subsidiaries Financial Supplement to Third Quarter 2011 Earnings Release |
Page 9 |
Non-Interest Income and Expense
| Non-Interest Income | Quarter Ended | |||||||||||||||||||||||||||||||||||
| 3Q11 | 3Q11 | |||||||||||||||||||||||||||||||||||
| ($ amounts in millions) |
9/30/11 | 6/30/11 | 3/31/11 | 12/31/10 | 9/30/10 | vs. 2Q11 | vs. 3Q10 | |||||||||||||||||||||||||||||
| Service charges on deposit accounts |
$ | 310 | $ | 308 | $ | 287 | $ | 290 | $ | 294 | $ | 2 | 0.6 | % | $ | 16 | 5.4 | % | ||||||||||||||||||
| Brokerage, investment banking and capital markets |
217 | 248 | 267 | 312 | 257 | (31 | ) | -12.5 | % | (40 | ) | -15.6 | % | |||||||||||||||||||||||
| Mortgage income |
68 | 50 | 45 | 51 | 66 | 18 | 36.0 | % | 2 | 3.0 | % | |||||||||||||||||||||||||
| Trust department income |
49 | 51 | 50 | 50 | 49 | (2 | ) | -3.9 | % | — | — | |||||||||||||||||||||||||
| Securities gains (losses), net |
(1 | ) | 24 | 82 | 333 | 2 | (25 | ) | -104.2 | % | (3 | ) | NM | |||||||||||||||||||||||
| Insurance income |
27 | 25 | 28 | 25 | 25 | 2 | 8.0 | % | 2 | 8.0 | % | |||||||||||||||||||||||||
| Leveraged lease termination gains (losses), net |
(2 | ) | — | — | 59 | — | (2 | ) | NM | (2 | ) | NM | ||||||||||||||||||||||||
| (Loss) gain on sale of mortgage loans |
— | — | (3 | ) | 26 | — | — | — | — | — | ||||||||||||||||||||||||||
| Other |
77 | 75 | 87 | 67 | 57 | 2 | 2.7 | % | 20 | 35.1 | % | |||||||||||||||||||||||||
|
|
|
|
|
|
|
|
|
|
|
|
|
|
|
|
|
|
|
|||||||||||||||||||
| Total non-interest income |
$ | 745 | $ | 781 | $ | 843 | $ | 1,213 | $ | 750 | $ | (36 | ) | -4.6 | % | $ | (5 | ) | -0.7 | % | ||||||||||||||||
|
|
|
|
|
|
|
|
|
|
|
|
|
|
|
|
|
|
|
|||||||||||||||||||
| Non-Interest Expense | Quarter Ended | |||||||||||||||||||||||||||||||||||
| 3Q11 | 3Q11 | |||||||||||||||||||||||||||||||||||
| ($ amounts in millions) |
9/30/11 | 6/30/11 | 3/31/11 | 12/31/10 | 9/30/10 | vs. 2Q11 | vs. 3Q10 | |||||||||||||||||||||||||||||
| Salaries and employee benefits |
$ | 529 | $ | 561 | $ | 594 | $ | 601 | $ | 582 | $ | (32 | ) | -5.7 | % | $ | (53 | ) | -9.1 | % | ||||||||||||||||
| Net occupancy expense |
104 | 107 | 109 | 108 | 110 | (3 | ) | -2.8 | % | (6 | ) | -5.5 | % | |||||||||||||||||||||||
| Furniture and equipment expense |
77 | 79 | 77 | 76 | 75 | (2 | ) | -2.5 | % | 2 | 2.7 | % | ||||||||||||||||||||||||
| Professional and legal fees |
64 | 61 | 81 | 92 | 71 | 3 | 4.9 | % | (7 | ) | -9.9 | % | ||||||||||||||||||||||||
| Amortization of core deposit intangible |
23 | 24 | 25 | 26 | 27 | (1 | ) | -4.2 | % | (4 | ) | -14.8 | % | |||||||||||||||||||||||
| Other real estate owned expense |
48 | 37 | 39 | 61 | 65 | 11 | 29.7 | % | (17 | ) | -26.2 | % | ||||||||||||||||||||||||
| FDIC premiums |
47 | 72 | 52 | 52 | 51 | (25 | ) | -34.7 | % | (4 | ) | -7.8 | % | |||||||||||||||||||||||
| Marketing expense |
15 | 17 | 13 | 14 | 22 | (2 | ) | -11.8 | % | (7 | ) | -31.8 | % | |||||||||||||||||||||||
| Branch consolidation and property and equipment charges |
— | 77 | — | — | — | (77 | ) | -100.0 | % | — | — | |||||||||||||||||||||||||
| Loss on early extinguishment of debt |
— | — | — | 55 | — | — | NM | — | NM | |||||||||||||||||||||||||||
| Other |
159 | 163 | 177 | 181 | 159 | (4 | ) | -2.5 | % | — | 0.0 | % | ||||||||||||||||||||||||
|
|
|
|
|
|
|
|
|
|
|
|
|
|
|
|
|
|
|
|||||||||||||||||||
| Total non-interest expense |
$ | 1,066 | $ | 1,198 | $ | 1,167 | $ | 1,266 | $ | 1,162 | $ | (132 | ) | -11.0 | % | $ | (96 | ) | -8.3 | % | ||||||||||||||||
|
|
|
|
|
|
|
|
|
|
|
|
|
|
|
|
|
|
|
|||||||||||||||||||
| • | Non-interest income decreased $36 million, however $25 million of the decline was driven by lower securities gains and $2 million was due to leveraged lease termination losses. On an adjusted basis, non-interest income declined $10 million or 1% linked quarter, and was generally flat year-over-year. |
| • | Brokerage, investment banking and capital markets income decreased $31 million to $217 million, reflecting pressure from the volatility in the markets during the quarter. Non-interest income was negatively impacted by a deferred compensation adjustment. Under the plan, selected employees’ deferred compensation is based on the performance of underlying investments these employees have selected. As overall market conditions deteriorated in 3Q11, non-interest income was negatively impacted $23 million. It should be noted that the corresponding deferred compensation liability was also impacted, resulting in a $19 million decrease in overall benefits expense. Accordingly, the negative impact on non-interest income is largely offset by lower salaries and benefits expense. |
| • | Service charges increased $2 million linked quarter, reflecting higher overdraft/NSF fees. The ongoing restructuring of checking accounts to fee-eligible has aided in the continued strength in service charges income. |
| • | Mortgage income increased $18 million linked quarter, primarily reflecting higher origination volume, which increased 9% linked quarter and totaled $1.5 billion dollars. Within mortgage income, the MSR and related hedges had no impact to mortgage income in 3Q11 which compared to a $2 million loss in 2Q11. |
| • | Non-interest expenses decreased 11% linked quarter, however after adjusting for prior quarter’s $77 million in charges related to branch consolidation and property and equipment charges, non-interest expenses declined 5%, and reflected lower salaries and benefits expense and a reduction in FDIC premiums. |
| • | Salaries and benefits expense decreased 6% linked quarter, driven by lower benefits related to deferred compensation as discussed above and a decline in headcount. |
| • | Other real estate owned expense rose $11 million linked quarter to $48 million, reflecting an increase in valuation adjustments. |
| • | FDIC premiums decreased $25 million linked quarter to $47 million. Going forward, the company expects FDIC premium expense to be approximately $50 million a quarter. |
| Regions Financial Corporation and Subsidiaries Financial Supplement to Third Quarter 2011 Earnings Release |
Page 10 |
Morgan Keegan Financial Highlights
Summary Income Statement (1)
| Quarter Ended | ||||||||||||||||||||||||||||||||||||
| 3Q11 | 3Q11 | |||||||||||||||||||||||||||||||||||
| ($ amounts in millions) |
9/30/11 | 6/30/11 | 3/31/11 | 12/31/10 | 9/30/10 | vs. 2Q11 | vs. 3Q10 | |||||||||||||||||||||||||||||
| Net interest income (3) |
$ | 16 | $ | 16 | $ | 15 | $ | 21 | $ | 15 | $ | — | — | $ | 1 | 6.7 | % | |||||||||||||||||||
| Non-interest income |
280 | 296 | 314 | 342 | 309 | (16 | ) | (0 | ) | (29 | ) | -9.4 | % | |||||||||||||||||||||||
| Non-interest expense |
254 | 286 | 273 | 320 | 289 | (32 | ) | (0 | ) | (35 | ) | -12.1 | % | |||||||||||||||||||||||
| Regulatory charge |
— | — | — | — | — | — | NM | — | NM | |||||||||||||||||||||||||||
|
|
|
|
|
|
|
|
|
|
|
|
|
|
|
|
|
|
|
|||||||||||||||||||
| Pre-tax Income |
42 | 26 | 56 | 43 | 35 | 16 | 62 | % | 7 | 20.0 | % | |||||||||||||||||||||||||
| Income tax expense (benefit) |
16 | (34 | ) | 25 | 26 | 13 | 50 | NM | 3 | 23.1 | % | |||||||||||||||||||||||||
|
|
|
|
|
|
|
|
|
|
|
|
|
|
|
|
|
|
|
|||||||||||||||||||
| Net income (loss) |
$ | 26 | $ | 60 | $ | 31 | $ | 17 | $ | 22 | (34 | ) | -57 | % | 4 | 18.2 | % | |||||||||||||||||||
|
|
|
|
|
|
|
|
|
|
|
|
|
|
|
|
|
|
|
|||||||||||||||||||
Breakout of Revenue by Division (2)
| Fixed- | ||||||||||||||||||||||||||||
| Income | Equity | Regions | ||||||||||||||||||||||||||
| Private | Capital | Capital | Investment | MK | Asset | Interest | ||||||||||||||||||||||
| ($ amounts in millions) |
Client | Markets | Markets | Banking | Trust | Management | & Other (4) | |||||||||||||||||||||
| Three months ended |
||||||||||||||||||||||||||||
| September 30, 2011 |
||||||||||||||||||||||||||||
| $ amount of revenue |
$ | 117 | $ | 77 | $ | 14 | $ | 36 | $ | 55 | $ | 4 | $ | (5 | ) | |||||||||||||
| % of gross revenue |
39.3 | % | 25.8 | % | 4.7 | % | 12.1 | % | 18.5 | % | 1.3 | % | -1.7 | % | ||||||||||||||
| Three months ended |
||||||||||||||||||||||||||||
| June 30, 2011 |
||||||||||||||||||||||||||||
| $ amount of revenue |
$ | 117 | $ | 71 | $ | 14 | $ | 37 | $ | 61 | $ | 5 | $ | 9 | ||||||||||||||
| % of gross revenue |
37.3 | % | 22.6 | % | 4.5 | % | 11.8 | % | 19.4 | % | 1.6 | % | 2.8 | % | ||||||||||||||
| Nine Months Ended |
||||||||||||||||||||||||||||
| September 30, 2011 |
||||||||||||||||||||||||||||
| $ amount of revenue |
$ | 359 | $ | 214 | $ | 44 | $ | 103 | $ | 172 | $ | 12 | $ | 41 | ||||||||||||||
| % of gross revenue |
38.0 | % | 22.6 | % | 4.7 | % | 10.9 | % | 18.2 | % | 1.3 | % | 4.3 | % | ||||||||||||||
| Nine Months Ended |
||||||||||||||||||||||||||||
| September 30, 2010 |
||||||||||||||||||||||||||||
| $ amount of revenue |
$ | 352 | $ | 240 | $ | 40 | $ | 94 | $ | 155 | $ | 12 | $ | 59 | ||||||||||||||
| % of gross revenue |
37.0 | % | 25.2 | % | 4.2 | % | 9.9 | % | 16.3 | % | 1.3 | % | 6.1 | % | ||||||||||||||
| • | Fixed Income Capital Markets benefited from both the volatility in the markets along with the Federal Reserve’s large-scale asset purchase program or “Operation Twist”, which resulted in a sharp decline in long-term interest rates in the third quarter. |
| (1) | Certain amounts in the prior periods have been reclassified to reflect the current period presentation |
| (2) | “Breakout of Revenue by Division” has been adjusted to reflect changes in the company’s reporting structure |
| (3) | Net interest income in the Summary Income Statement is illustrated on a net basis, whereas in the Breakout of Revenue by Division, revenue is illustrated on a gross basis. In the Summary Income Statement, 3Q11 and 2Q11 exclude $2 million each quarter of gross interest income, 1Q11 and 4Q10 exclude $4 million each quarter of gross interest income and 3Q10 excludes $3 million of gross interest income. |
| (4) | 3Q11 includes the negative impact of deferred compensation related adjustment to income reflecting the volatility in the markets. This impact is offset by lower employee benefits expenses, and therefore has no material impact to pre-tax income. |
| Regions Financial Corporation and Subsidiaries Financial Supplement to Third Quarter 2011 Earnings Release |
Page 11 |
Credit Quality
| As of and for Quarter Ended | ||||||||||||||||||||||
| ($ amounts in millions) |
9/30/11 | 6/30/11 | 3/31/11 | 12/31/10 | 9/30/10 | |||||||||||||||||
| Allowance for credit losses (ACL) |
$ | 3,050 | $ | 3,204 | $ | 3,264 | $ | 3,256 | $ | 3,256 | ||||||||||||
| Allowance allocated to purchased loans |
— | 84 | — | — | — | |||||||||||||||||
| Provision for loan losses |
355 | 398 | 482 | 682 | 760 | |||||||||||||||||
| Provision for unfunded credit losses |
2 | 6 | 7 | — | — | |||||||||||||||||
| Net loans charged-off: |
||||||||||||||||||||||
| Commercial and industrial |
72 | 49 | 72 | 128 | 89 | |||||||||||||||||
| Commercial real estate mortgage—owner-occupied |
62 | 43 | 66 | 80 | 64 | |||||||||||||||||
| Commercial real estate construction—owner-occupied |
2 | 1 | 4 | 4 | 3 | |||||||||||||||||
|
|
|
|
|
|
|
|
|
|
|
|||||||||||||
| Total commercial |
136 | 93 | 142 | 212 | 156 | |||||||||||||||||
| Commercial investor real estate mortgage |
167 | 247 | 132 | 202 | 254 | |||||||||||||||||
| Commercial investor real estate construction |
52 | 56 | 42 | 99 | 171 | |||||||||||||||||
|
|
|
|
|
|
|
|
|
|
|
|||||||||||||
| Total investor real estate |
219 | 303 | 174 | 301 | 425 | |||||||||||||||||
| Residential first mortgage |
59 | 55 | 56 | 56 | 58 | |||||||||||||||||
| Home equity—first lien |
19 | 17 | 22 | 20 | 23 | |||||||||||||||||
| Home equity—second lien |
60 | 66 | 72 | 72 | 79 | |||||||||||||||||
| Indirect |
2 | 3 | 4 | 4 | 3 | |||||||||||||||||
| Consumer credit card |
1 | — | — | — | — | |||||||||||||||||
| Other consumer |
15 | 11 | 11 | 17 | 15 | |||||||||||||||||
|
|
|
|
|
|
|
|
|
|
|
|||||||||||||
| Total |
511 | $ | 548 | $ | 481 | $ | 682 | $ | 759 | |||||||||||||
|
|
|
|
|
|
|
|
|
|
|
|||||||||||||
| Net loan charge-offs as a % of average loans, annualized: |
||||||||||||||||||||||
| Commercial and industrial |
1.19 | % | 0.85 | % | 1.27 | % | 2.31 | % | 1.66 | % | ||||||||||||
| Commercial real estate mortgage—owner-occupied |
2.13 | % | 1.45 | % | 2.23 | % | 2.64 | % | 2.12 | % | ||||||||||||
| Commercial real estate construction—owner-occupied |
2.01 | % | 1.08 | % | 3.74 | % | 3.54 | % | 1.95 | % | ||||||||||||
|
|
|
|
|
|
|
|
|
|
|
|||||||||||||
| Total commercial |
1.50 | % | 1.05 | % | 1.63 | % | 2.44 | % | 1.83 | % | ||||||||||||
| Commercial investor real estate mortgage |
5.81 | % | 7.85 | % | 4.00 | % | 5.63 | % | 6.67 | % | ||||||||||||
| Commercial investor real estate construction |
14.45 | % | 12.56 | % | 8.07 | % | 14.91 | % | 19.57 | % | ||||||||||||
|
|
|
|
|
|
|
|
|
|
|
|||||||||||||
| Total investor real estate |
6.76 | % | 8.44 | % | 4.56 | % | 7.09 | % | 9.09 | % | ||||||||||||
| Residential first mortgage |
1.64 | % | 1.54 | % | 1.55 | % | 1.42 | % | 1.48 | % | ||||||||||||
| Home equity—first lien |
1.26 | % | 1.11 | % | 1.47 | % | 1.26 | % | 1.45 | % | ||||||||||||
| Home equity—second lien |
3.21 | % | 3.46 | % | 3.68 | % | 3.52 | % | 3.72 | % | ||||||||||||
| Indirect |
0.64 | % | 0.57 | % | 1.05 | % | 1.09 | % | 0.64 | % | ||||||||||||
| Consumer credit card |
0.42 | % | — | — | — | — | ||||||||||||||||
| Other consumer |
4.93 | % | 3.70 | % | 3.70 | % | 5.54 | % | 5.03 | % | ||||||||||||
|
|
|
|
|
|
|
|
|
|
|
|||||||||||||
| Total |
2.52 | % | 2.71 | % | 2.37 | % | 3.22 | % | 3.52 | % | ||||||||||||
|
|
|
|
|
|
|
|
|
|
|
|||||||||||||
| Non-accrual loans, excluding loans held for sale |
$ | 2,710 | $ | 2,784 | $ | 3,087 | $ | 3,160 | $ | 3,372 | ||||||||||||
| Non-performing loans held for sale |
344 | 381 | 381 | 304 | 393 | |||||||||||||||||
|
|
|
|
|
|
|
|
|
|
|
|||||||||||||
| Non-accrual loans, including loans held for sale |
$ | 3,054 | $ | 3,165 | $ | 3,468 | $ | 3,464 | $ | 3,765 | ||||||||||||
| Foreclosed properties |
337 | 437 | 465 | 454 | 461 | |||||||||||||||||
|
|
|
|
|
|
|
|
|
|
|
|||||||||||||
| Non-performing assets (NPAs) |
$ | 3,391 | $ | 3,602 | $ | 3,933 | $ | 3,918 | $ | 4,226 | ||||||||||||
|
|
|
|
|
|
|
|
|
|
|
|||||||||||||
| Loans past due > 90 days |
$ | 412 | $ | 483 | $ | 527 | $ | 585 | $ | 593 | ||||||||||||
| Restructured loans not included in categories above (1) |
2,817 | $ | 1,664 | $ | 1,553 | $ | 1,483 | $ | 1,299 | |||||||||||||
| Credit Ratios: |
||||||||||||||||||||||
| ACL/Loans, net |
3.84 | % | 3.95 | % | 4.01 | % | 3.93 | % | 3.86 | % | ||||||||||||
| ALL/Loans, net |
3.73 | % | 3.84 | % | 3.92 | % | 3.84 | % | 3.77 | % | ||||||||||||
| Allowance for loan losses to non-performing loans, excluding loans held for sale |
1.09x | 1.12x | 1.03x | 1.01x | 0.94x | |||||||||||||||||
| Non-accrual loans, excluding loans held for sale/Loans |
3.41 | % | 3.43 | % | 3.79 | % | 3.81 | % | 3.99 | % | ||||||||||||
| NPAs (ex. 90+ past due)/Loans, foreclosed properties and non-performing loans held for sale |
4.23 | % | 4.39 | % | 4.78 | % | 4.69 | % | 4.96 | % | ||||||||||||
| NPAs (inc. 90+ past due)/Loans, foreclosed properties and non-performing loans held for sale |
4.75 | % | 4.98 | % | 5.42 | % | 5.38 | % | 5.65 | % | ||||||||||||
Allowance for Credit Losses
| Quarter Ended | ||||||||||
| ($ amounts in millions) |
9/30/11 | 9/30/10 | ||||||||
| Components: |
||||||||||
| Allowance for loan losses |
$ | 2,964 | $ | 3,185 | ||||||
| Reserve for unfunded credit commitments |
86 | 71 | ||||||||
|
|
|
|
|
|||||||
| Allowance for credit losses |
$ | 3,050 | $ | 3,256 | ||||||
|
|
|
|
|
|||||||
| (1) | See page 12 for detail of restructured loans. |
| Regions Financial Corporation and Subsidiaries Financial Supplement to Third Quarter 2011 Earnings Release |
Page 12 |
Troubled Debt Restructurings
| Quarter Ended | ||||||||||||||||||||
| (in millions) |
9/30/11 | 6/30/11 | 3/31/11 | 12/31/10 | 9/30/10 | |||||||||||||||
| Current: |
||||||||||||||||||||
| Commercial |
$ | 437 | $ | 62 | $ | 66 | $ | 70 | $ | 23 | ||||||||||
| Investor Real Estate |
923 | 257 | 193 | 152 | 150 | |||||||||||||||
| Residential First Mortgage |
774 | 760 | 737 | 696 | 613 | |||||||||||||||
| Home Equity |
373 | 352 | 328 | 305 | 285 | |||||||||||||||
| Other Consumer |
54 | 58 | 59 | 59 | 61 | |||||||||||||||
|
|
|
|
|
|
|
|
|
|
|
|||||||||||
| Total Current |
$ | 2,561 | $ | 1,489 | $ | 1,383 | $ | 1,282 | $ | 1,132 | ||||||||||
|
|
|
|
|
|
|
|
|
|
|
|||||||||||
| Accruing 30-89 DPD: |
||||||||||||||||||||
| Commercial |
$ | 39 | $ | 7 | $ | 6 | $ | 7 | $ | — | ||||||||||
| Investor Real Estate |
67 | 16 | 15 | 40 | — | |||||||||||||||
| Residential First Mortgage |
114 | 116 | 117 | 117 | 133 | |||||||||||||||
| Home Equity |
30 | 31 | 27 | 30 | 29 | |||||||||||||||
| Other Consumer |
6 | 5 | 5 | 7 | 5 | |||||||||||||||
|
|
|
|
|
|
|
|
|
|
|
|||||||||||
| Total Accruing 30-89 DPD |
$ | 256 | $ | 175 | $ | 170 | $ | 201 | $ | 167 | ||||||||||
|
|
|
|
|
|
|
|
|
|
|
|||||||||||
| Non-accrual or 90+ DPD: |
||||||||||||||||||||
| Commercial |
$ | 373 | $ | 164 | $ | 120 | $ | 105 | $ | 71 | ||||||||||
| Investor Real Estate |
475 | 200 | 230 | 198 | 159 | |||||||||||||||
| Residential First Mortgage |
214 | 207 | 221 | 240 | 222 | |||||||||||||||
| Home Equity |
30 | 29 | 28 | 30 | 26 | |||||||||||||||
| Other Consumer |
1 | — | 1 | — | — | |||||||||||||||
|
|
|
|
|
|
|
|
|
|
|
|||||||||||
| Total Non-accrual or 90+DPD |
$ | 1,093 | $ | 600 | $ | 600 | $ | 573 | $ | 478 | ||||||||||
|
|
|
|
|
|
|
|
|
|
|
|||||||||||
|
|
|
|
|
|
|
|
|
|
|
|||||||||||
| Total TDRs |
$ | 3,910 | $ | 2,264 | $ | 2,153 | $ | 2,056 | $ | 1,777 | ||||||||||
|
|
|
|
|
|
|
|
|
|
|
|||||||||||
Business Services Criticized Loan Summary By TDR Status
The tables below present a summary of Business Services loans by risk rating category and by portfolio segment. The line items titled “TDRs newly identified under policy change” represent newly identified TDRs as a result of implementation during 3Q11 of clarified accounting guidance. Consumer loans were not impacted.
| Quarter Ended 9/30/11 | ||||||||||||||||
| (in millions) | Special Mention | Substandard Accrual |
Non-Accrual | Total | ||||||||||||
| Commercial |
||||||||||||||||
| TDRs newly identified under policy change |
$ | 52 | $ | 333 | $ | 220 | $ | 605 | ||||||||
| TDRs under existing policy |
6 | 71 | 151 | 228 | ||||||||||||
| All Other Commercial (not TDRs) |
696 | 788 | 822 | 2,306 | ||||||||||||
|
|
|
|
|
|
|
|
|
|||||||||
| $ | 754 | $ | 1,192 | $ | 1,193 | $ | 3,139 | |||||||||
|
|
|
|
|
|
|
|
|
|||||||||
| Investor Real Estate |
||||||||||||||||
| TDRs newly identified under policy change |
$ | 46 | $ | 751 | $ | 270 | $ | 1,067 | ||||||||
| TDRs under existing policy |
9 | 118 | 204 | 331 | ||||||||||||
| All Other Investor Real Estate (not TDRs) |
1,088 | 1,029 | 651 | 2,768 | ||||||||||||
|
|
|
|
|
|
|
|
|
|||||||||
| $ | 1,143 | $ | 1,898 | $ | 1,125 | $ | 4,166 | |||||||||
|
|
|
|
|
|
|
|
|
|||||||||
Note: As of September 30, 2011 there were $16 million accruing Commercial TDRs that were “Pass” rated and $67 million accruing Investor Real Estate TDRs that were “Pass” rated, that are not illustrated in the table above.
| Quarter Ended 6/30/11 | ||||||||||||||||
| Special Mention | Substandard Accrual |
Non-Accrual | Total | |||||||||||||
| Commercial |
||||||||||||||||
| TDRs newly identified under policy change |
$ | — | $ | — | $ | — | $ | — | ||||||||
| TDRs under existing policy |
5 | 55 | 163 | 223 | ||||||||||||
| All Other Commercial (not TDRs) |
714 | 1,257 | 1,077 | 3,048 | ||||||||||||
|
|
|
|
|
|
|
|
|
|||||||||
| $ | 719 | $ | 1,312 | $ | 1,240 | $ | 3,271 | |||||||||
|
|
|
|
|
|
|
|
|
|||||||||
| Investor Real Estate |
||||||||||||||||
| TDRs newly identified under policy change |
$ | — | $ | — | $ | — | $ | — | ||||||||
| TDRs under existing policy |
21 | 203 | 199 | 423 | ||||||||||||
| All Other Investor Real Estate (not TDRs) |
1,335 | 1,878 | 992 | 4,205 | ||||||||||||
|
|
|
|
|
|
|
|
|
|||||||||
| $ | 1,356 | $ | 2,081 | $ | 1,191 | $ | 4,628 | |||||||||
|
|
|
|
|
|
|
|
|
|||||||||
Note: As of September 30, 2011 there were $10 million accruing Commercial TDRs that were “Pass” rated and $50 million accruing Investor Real Estate TDRs that were “Pass” rated, that are not illustrated in the table above.
• As the majority of the increase in total TDRs were risk rated special mention or substandard accruing, the associated credit risk had already been factored into the calculation of the allowance for loan losses. Accordingly, there was no material impact to the company’s overall loan loss allowance during 3Q11 resulting from the increased TDRs.
• Regions has a high level of renewal activity due to the company’s strategy to keep loan maturities short, in order to maintain leverage in negotiations with customers.
• Regions often increases or at least maintains the same interest rate and frequently receives consideration in exchange for modifying these loans.
| Regions Financial Corporation and Subsidiaries Financial Supplement to Third Quarter 2011 Earnings Release |
Page 13 |
Gross and Net NPA Migration
| Quarter Ended | ||||||||||||||||||||
| ($ in millions) |
9/30/11 | 6/30/11 | 3/31/11 | 12/31/10 | 9/30/10 | |||||||||||||||
| Beginning Non-Performing Assets (1) |
$ | 3,602 | $ | 3,933 | $ | 3,918 | $ | 4,226 | $ | 4,275 | ||||||||||
| Additions |
$ | 822 | $ | 619 | $ | 816 | $ | 1,021 | $ | 1,410 | ||||||||||
| Resolutions (2) |
(260 | ) | (224 | ) | (214 | ) | (348 | ) | (255 | ) | ||||||||||
| Charge-Offs / OREO Write-Downs |
(384 | ) | (362 | ) | (368 | ) | (576 | ) | (497 | ) | ||||||||||
| Home Equity Reclassification (3) |
56 | — | — | — | — | |||||||||||||||
|
|
|
|
|
|
|
|
|
|
|
|||||||||||
| Net Additions |
234 | 33 | 234 | 97 | 658 | |||||||||||||||
|
|
|
|
|
|
|
|
|
|
|
|||||||||||
| Non-Accrual Asset Sales |
(299 | ) | (226 | ) | (106 | ) | (309 | ) | (511 | ) | ||||||||||
| OREO Sales |
(146 | ) | (138 | ) | (113 | ) | (96 | ) | (196 | ) | ||||||||||
|
|
|
|
|
|
|
|
|
|
|
|||||||||||
| Ending Non-Performing Assets (1) |
3,391 | 3,602 | 3,933 | 3,918 | 4,226 | |||||||||||||||
|
|
|
|
|
|
|
|
|
|
|
|||||||||||
| Change Versus Previous Quarter |
($ | 211 | ) | ($ | 331 | ) | $ | 15 | ($ | 308 | ) | ($ | 49 | ) | ||||||
| (1) | Includes Loans Held for Sale |
| (2) | Includes payments and returned to accruals |
| (3) | Beginning in 3Q11, credit policy on home equity lines and loans in second lien position changed such that they are placed on non-accrual by the end of the month in which the loan becomes 120 days past due. Prior policy required all real estate secured loans to be placed on non-accrual by the end of the month in which the loan becomes 180 days past due unless the loan is fully secured and in process of collection. The effect of the reclassification was to increase non-accrual loans and to decrease 90 days past due loans. |
Credit Costs
| Quarter Ended | ||||||||||||||||||||
| (in millions) |
9/30/11 | 6/30/11 | 3/31/11 | 12/31/10 | 9/30/10 | |||||||||||||||
| Net Charge-offs |
||||||||||||||||||||
| Investor Real Estate (IRE) |
$ | 60 | $ | 99 | $ | 84 | $ | 205 | $ | 205 | ||||||||||
| Commercial |
100 | 91 | 126 | 197 | 143 | |||||||||||||||
| Consumer Real Estate |
134 | 138 | 150 | 148 | 160 | |||||||||||||||
| Other Consumer |
19 | 13 | 15 | 21 | 18 | |||||||||||||||
| Net Charge-offs excluding charge-offs from Sales / Transfers to HFS |
313 | 341 | 375 | 571 | 526 | |||||||||||||||
|
|
|
|
|
|
|
|
|
|
|
|||||||||||
| Sales/Transfer to HFS |
198 | 207 | 106 | 111 | 233 | |||||||||||||||
|
|
|
|
|
|
|
|
|
|
|
|||||||||||
| Total Net Charge-offs |
511 | 548 | 481 | 682 | 759 | |||||||||||||||
|
|
|
|
|
|
|
|
|
|
|
|||||||||||
| Net Loss / (Gain)—HFS Sales |
(2 | ) | (1 | ) | — | (7 | ) | (2 | ) | |||||||||||
| HFS Write-downs (4) |
2 | 5 | 2 | 21 | 7 | |||||||||||||||
| OREO expense |
48 | 37 | 39 | 61 | 65 | |||||||||||||||
|
|
|
|
|
|
|
|
|
|
|
|||||||||||
| Total Credit Costs before Reserve Reduction |
559 | 589 | 522 | 757 | 829 | |||||||||||||||
|
|
|
|
|
|
|
|
|
|
|
|||||||||||
| Reserve Increase / (Reduction) |
(156 | ) | (150 | ) | 1 | 0 | 1 | |||||||||||||
|
|
|
|
|
|
|
|
|
|
|
|||||||||||
| Total Credit Costs after Reserve Reduction |
403 | 439 | 523 | 757 | 830 | |||||||||||||||
|
|
|
|
|
|
|
|
|
|
|
|||||||||||
| (4) | Reflects write-downs subsequent to initial move to held for sale and write-downs upon transfer to OREO |
| Regions Financial Corporation and Subsidiaries Financial Supplement to Third Quarter 2011 Earnings Release |
Page 14 |
Early and Late Stage Delinquencies
30-89 Days Past Due Loans
| Quarter Ended | ||||||||||||||||||||||||||||||||||||||||
| ($ millions) |
9/30/11 | 6/30/11 | 3/31/11 | 12/31/10 | 9/30/10 | |||||||||||||||||||||||||||||||||||
| Commercial and Industrial |
$ | 87 | 0.36 | % | $ | 118 | 0.50 | % | $ | 104 | 0.45 | % | $ | 103 | 0.45 | % | $ | 129 | 0.60 | % | ||||||||||||||||||||
| Commercial Real Estate Mortgage—OO |
87 | 0.76 | % | 71 | 0.60 | % | 99 | 0.83 | % | 101 | 0.84 | % | 106 | 0.90 | % | |||||||||||||||||||||||||
| Commercial Real Estate Construction—OO |
1 | 0.20 | % | 2 | 0.56 | % | 2 | 0.44 | % | 3 | 0.61 | % | 2 | 0.42 | % | |||||||||||||||||||||||||
|
|
|
|
|
|
|
|
|
|
|
|
|
|
|
|
|
|
|
|
|
|||||||||||||||||||||
| Total Commercial |
$ | 175 | 0.48 | % | $ | 191 | 0.53 | % | $ | 205 | 0.58 | % | $ | 207 | 0.59 | % | $ | 237 | 0.70 | % | ||||||||||||||||||||
| Commercial Investor Real Estate Mortgage |
126 | 1.18 | % | 146 | 1.23 | % | 332 | 2.57 | % | 211 | 1.55 | % | 272 | 1.88 | % | |||||||||||||||||||||||||
| Commercial Investor Real Estate Construction |
17 | 1.42 | % | 25 | 1.57 | % | 35 | 1.86 | % | 42 | 1.83 | % | 47 | 1.58 | % | |||||||||||||||||||||||||
|
|
|
|
|
|
|
|
|
|
|
|
|
|
|
|
|
|
|
|
|
|||||||||||||||||||||
| Total Investor Real Estate |
$ | 143 | 1.21 | % | $ | 171 | 1.27 | % | $ | 367 | 2.48 | % | $ | 253 | 1.59 | % | $ | 319 | 1.83 | % | ||||||||||||||||||||
| Residential First Mortgage |
269 | 1.91 | % | 265 | 1.85 | % | 277 | 1.92 | % | 303 | 2.03 | % | 329 | 2.09 | % | |||||||||||||||||||||||||
| Home Equity |
180 | 1.36 | % | 168 | 1.23 | % | 185 | 1.33 | % | 224 | 1.58 | % | 222 | 1.53 | % | |||||||||||||||||||||||||
| Direct |
12 | 1.44 | % | 12 | 1.39 | % | 11 | 1.27 | % | 16 | 1.97 | % | 14 | 1.66 | % | |||||||||||||||||||||||||
| Indirect |
30 | 1.66 | % | 25 | 1.44 | % | 27 | 1.69 | % | 37 | 2.30 | % | 34 | 2.08 | % | |||||||||||||||||||||||||
| Consumer Credit Card |
14 | 1.40 | % | 11 | 1.00 | % | — | 0.00 | % | — | 0.00 | % | — | 0.00 | % | |||||||||||||||||||||||||
| Other Consumer |
12 | 3.46 | % | 10 | 3.10 | % | 9 | 2.57 | % | 12 | 3.33 | % | 13 | 3.71 | % | |||||||||||||||||||||||||
|
|
|
|
|
|
|
|
|
|
|
|
|
|
|
|
|
|
|
|
|
|||||||||||||||||||||
| Total Consumer |
$ | 517 | 1.65 | % | $ | 491 | 1.54 | % | $ | 509 | 1.64 | % | $ | 592 | 1.86 | % | $ | 612 | 1.85 | % | ||||||||||||||||||||
|
|
|
|
|
|
|
|
|
|
|
|
|
|
|
|
|
|
|
|
|
|||||||||||||||||||||
| Total 30-89 Days Past Due Loans |
$ | 835 | 1.05 | % | $ | 853 | 1.05 | % | $ | 1,081 | 1.33 | % | $ | 1,052 | 1.27 | % | $ | 1,168 | 1.38 | % | ||||||||||||||||||||
|
|
|
|
|
|
|
|
|
|
|
|
|
|
|
|
|
|
|
|
|
|||||||||||||||||||||
90+ Days Past Due Loans
| Quarter Ended | ||||||||||||||||||||||||||||||||||||||||
| ($ millions) |
9/30/11 | 6/30/11 | 3/31/11 | 12/31/10 | 9/30/10 | |||||||||||||||||||||||||||||||||||
| Commercial & Industrial |
$ | 10 | 0.04 | % | $ | 7 | 0.03 | % | $ | 10 | 0.04 | % | $ | 9 | 0.04 | % | $ | 5 | 0.03 | % | ||||||||||||||||||||
| Commercial Real Estate Mortgage—OO |
6 | 0.05 | % | 11 | 0.09 | % | 8 | 0.07 | % | 6 | 0.05 | % | 6 | 0.05 | % | |||||||||||||||||||||||||
| Commercial Real Estate Construction—OO |
— | 0.00 | % | — | 0.05 | % | — | 0.09 | % | 1 | 0.12 | % | — | 0.00 | % | |||||||||||||||||||||||||
|
|
|
|
|
|
|
|
|
|
|
|
|
|
|
|
|
|
|
|
|
|||||||||||||||||||||
| Total Commercial |
$ | 16 | 0.04 | % | $ | 18 | 0.05 | % | $ | 18 | 0.05 | % | $ | 16 | 0.05 | % | $ | 11 | 0.03 | % | ||||||||||||||||||||
| Commercial Investor Real Estate Mortgage |
9 | 0.08 | % | 5 | 0.04 | % | 13 | 0.10 | % | 5 | 0.04 | % | 6 | 0.04 | % | |||||||||||||||||||||||||
| Commercial Investor Real Estate Construction |
— | 0.01 | % | — | 0.02 | % | 1 | 0.04 | % | 1 | 0.04 | % | 2 | 0.05 | % | |||||||||||||||||||||||||
|
|
|
|
|
|
|
|
|
|
|
|
|
|
|
|
|
|
|
|
|
|||||||||||||||||||||
| Total Investor Real Estate |
$ | 9 | 0.07 | % | $ | 5 | 0.04 | % | $ | 14 | 0.09 | % | $ | 6 | 0.04 | % | $ | 8 | 0.04 | % | ||||||||||||||||||||
| Residential First Mortgage |
291 | 2.06 | % | 296 | 2.07 | % | 315 | 2.18 | % | 359 | 2.41 | % | 369 | 2.35 | % | |||||||||||||||||||||||||
| Home Equity (1) |
81 | 0.61 | % | 158 | 1.16 | % | 174 | 1.26 | % | 198 | 1.39 | % | 198 | 1.36 | % | |||||||||||||||||||||||||
| Direct |
2 | 0.19 | % | 1 | 0.16 | % | 1 | 0.13 | % | 1 | 0.13 | % | 2 | 0.21 | % | |||||||||||||||||||||||||
| Indirect |
1 | 0.08 | % | 2 | 0.10 | % | 2 | 0.13 | % | 2 | 0.13 | % | 2 | 0.14 | % | |||||||||||||||||||||||||
| Consumer Credit Card |
10 | 1.03 | % | — | 0.00 | % | — | 0.00 | % | — | 0.00 | % | — | 0.00 | % | |||||||||||||||||||||||||
| Other Consumer |
2 | 0.50 | % | 3 | 0.79 | % | 3 | 0.86 | % | 3 | 0.88 | % | 3 | 0.79 | % | |||||||||||||||||||||||||
|
|
|
|
|
|
|
|
|
|
|
|
|
|
|
|
|
|
|
|
|
|||||||||||||||||||||
| Total Consumer |
$ | 387 | 1.23 | % | $ | 460 | 1.44 | % | $ | 495 | 1.59 | % | $ | 563 | 1.76 | % | $ | 574 | 1.74 | % | ||||||||||||||||||||
|
|
|
|
|
|
|
|
|
|
|
|
|
|
|
|
|
|
|
|
|
|||||||||||||||||||||
| Total 90+ Days Past Due Loans |
$ | 412 | 0.52 | % | $ | 483 | 0.60 | % | $ | 527 | 0.65 | % | $ | 585 | 0.71 | % | $ | 593 | 0.70 | % | ||||||||||||||||||||
|
|
|
|
|
|
|
|
|
|
|
|
|
|
|
|
|
|
|
|
|
|||||||||||||||||||||
OO = Owner Occupied
| (1) | Refer to page 13 for the home equity reclassification which increased non-accrual loans and decreased 90 days past due loans |
| Regions Financial Corporation and Subsidiaries Financial Supplement to Third Quarter 2011 Earnings Release |
Page 15 |
Non-Accrual Loans (excludes loans held for sale)
| Quarter Ended | ||||||||||||||||||||||||||||||||||||||||
| ($ millions) |
9/30/11 | 6/30/11 | 3/31/11 | 12/31/10 | 9/30/10 | |||||||||||||||||||||||||||||||||||
| Commercial and Industrial |
$ | 498 | 2.05 | % | $ | 525 | 2.22 | % | $ | 446 | 1.93 | % | $ | 467 | 2.07 | % | $ | 502 | 2.33 | % | ||||||||||||||||||||
| Commercial Real Estate Mortgage—OO |
668 | 5.79 | % | 687 | 5.82 | % | 648 | 5.45 | % | 606 | 5.03 | % | 616 | 5.20 | % | |||||||||||||||||||||||||
| Commercial Real Estate Construction—OO |
27 | 7.68 | % | 28 | 7.57 | % | 31 | 7.20 | % | 29 | 6.19 | % | 35 | 6.65 | % | |||||||||||||||||||||||||
|
|
|
|
|
|
|
|
|
|
|
|
|
|
|
|
|
|
|
|
|
|||||||||||||||||||||
| Total Commercial |
$ | 1,193 | 3.30 | % | $ | 1,240 | 3.46 | % | $ | 1,125 | 3.17 | % | $ | 1,102 | 3.14 | % | $ | 1,153 | 3.40 | % | ||||||||||||||||||||
| Commercial Investor Real Estate Mortgage |
829 | 7.75 | % | 820 | 6.93 | % | 1,142 | 8.83 | % | 1,265 | 9.28 | % | 1,347 | 9.30 | % | |||||||||||||||||||||||||
| Commercial Investor Real Estate Construction |
296 | 24.93 | % | 371 | 23.25 | % | 448 | 23.64 | % | 452 | 19.76 | % | 561 | 18.87 | % | |||||||||||||||||||||||||
|
|
|
|
|
|
|
|
|
|
|
|
|
|
|
|
|
|
|
|
|
|||||||||||||||||||||
| Total Investor Real Estate |
$ | 1,125 | 9.46 | % | $ | 1,191 | 8.87 | % | $ | 1,590 | 10.73 | % | $ | 1,717 | 10.79 | % | $ | 1,908 | 10.93 | % | ||||||||||||||||||||
| Residential First Mortgage |
261 | 1.85 | % | 288 | 2.01 | % | 303 | 2.10 | % | 285 | 1.92 | % | 267 | 1.70 | % | |||||||||||||||||||||||||
| Home Equity (1) |
131 | 0.98 | % | 65 | 0.48 | % | 69 | 0.50 | % | 56 | 0.40 | % | 44 | 0.30 | % | |||||||||||||||||||||||||
| Direct |
— | 0.00 | % | — | 0.00 | % | — | 0.00 | % | — | 0.00 | % | — | 0.00 | % | |||||||||||||||||||||||||
| Indirect |
— | 0.00 | % | — | 0.00 | % | — | 0.00 | % | — | 0.00 | % | — | 0.00 | % | |||||||||||||||||||||||||
| Consumer Credit Card |
— | 0.00 | % | — | 0.00 | % | — | 0.00 | % | — | 0.00 | % | — | 0.00 | % | |||||||||||||||||||||||||
| Other Consumer |
— | 0.00 | % | — | 0.00 | % | — | 0.00 | % | — | 0.00 | % | — | 0.00 | % | |||||||||||||||||||||||||
|
|
|
|
|
|
|
|
|
|
|
|
|
|
|
|
|
|
|
|
|
|||||||||||||||||||||
| Total Consumer |
$ | 392 | 1.25 | % | $ | 353 | 1.11 | % | $ | 372 | 1.20 | % | $ | 341 | 1.07 | % | $ | 311 | 0.94 | % | ||||||||||||||||||||
|
|
|
|
|
|
|
|
|
|
|
|
|
|
|
|
|
|
|
|
|
|||||||||||||||||||||
| Total Non-Accrual Loans |
$ | 2,710 | 3.41 | % | $ | 2,784 | 3.43 | % | $ | 3,087 | 3.79 | % | $ | 3,160 | 3.81 | % | $ | 3,372 | 3.99 | % | ||||||||||||||||||||
|
|
|
|
|
|
|
|
|
|
|
|
|
|
|
|
|
|
|
|
|
|||||||||||||||||||||
| Change versus previous quarter |
(74 | ) | (303 | ) | (73 | ) | (212 | ) | (101) | |||||||||||||||||||||||||||||||
OO = Owner Occupied
| (1) | Refer to page 13 for the home equity reclassification which increased non-accrual loans and decreased 90 days past due loans |
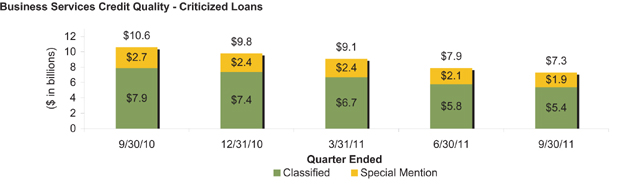
| Regions Financial Corporation and Subsidiaries Financial Supplement to Third Quarter 2011 Earnings Release |
Page 16 |
Residential Lending Net Charge-off Analysis
| Quarter Ended | ||||||||||||||||||||||||||||||||||||||||||
| 9/30/11 | 6/30/11 | |||||||||||||||||||||||||||||||||||||||||
| First Liens | Junior Liens | Total (1) | First Liens | Junior Liens | Total | |||||||||||||||||||||||||||||||||||||
| ($ in millions) | Residential Mortgage |
Home Equity |
Total | Home Equity |
Residential Mortgage |
Home Equity |
Total | Home Equity |
||||||||||||||||||||||||||||||||||
| Florida |
Net Charge-off %* | 2.94 | % | 2.13 | % | 2.72 | % | 5.59 | % | 3.53 | % | 2.88 | % | 2.05 | % | 2.65 | % | 6.10 | % | 3.64 | % | |||||||||||||||||||||
| $ Losses | $ | 39.8 | $ | 10.8 | $ | 50.6 | $ | 41.0 | $ | 91.6 | $ | 39.0 | $ | 10.4 | $ | 49.4 | $ | 45.8 | $ | 95.2 | ||||||||||||||||||||||
| Balance | $ | 5,324.3 | $ | 1,987.2 | $ | 7,311.5 | $ | 2,877.9 | $ | 10,189.4 | $ | 5,413.1 | $ | 2,014.9 | $ | 7,428.0 | $ | 2,967.5 | $ | 10,395.5 | ||||||||||||||||||||||
| Original LTV | 71.7 | % | 65.5 | % | 75.9 | % | 71.6 | % | 65.4 | % | 75.7 | % | ||||||||||||||||||||||||||||||
|
|
|
|
|
|
|
|
|
|
|
|
|
|||||||||||||||||||||||||||||||
| All Other |
Net Charge-off %* | 0.84 | % | 0.83 | % | 0.84 | % | 1.68 | % | 1.06 | % | 0.72 | % | 0.64 | % | 0.70 | % | 1.76 | % | 0.98 | % | |||||||||||||||||||||
| States |
$ Losses | $ | 18.8 | $ | 8.3 | $ | 27.1 | $ | 19.3 | $ | 46.4 | $ | 16.1 | $ | 6.5 | $ | 22.6 | $ | 20.5 | $ | 43.1 | |||||||||||||||||||||
| Balance | $ | 8,758.5 | $ | 3,966.6 | $ | 12,725.1 | $ | 4,484.8 | $ | 17,209.9 | $ | 8,893.1 | $ | 3,996.2 | $ | 12,889.3 | $ | 4,614.1 | $ | 17,503.4 | ||||||||||||||||||||||
| Original LTV | 74.0 | % | 66.7 | % | 79.3 | % | 73.8 | % | 66.8 | % | 79.3 | % | ||||||||||||||||||||||||||||||
|
|
|
|
|
|
|
|
|
|
|
|
|
|||||||||||||||||||||||||||||||
| Totals |
Net Charge-off %* | 1.64 | % | 1.26 | % | 1.53 | % | 3.21 | % | 1.98 | % | 1.54 | % | 1.11 | % | 1.41 | % | 3.46 | % | 1.97 | % | |||||||||||||||||||||
| $ Losses | $ | 58.6 | $ | 19.1 | $ | 77.7 | $ | 60.3 | $ | 138.0 | $ | 55.1 | $ | 16.9 | $ | 72.0 | $ | 66.3 | $ | 138.3 | ||||||||||||||||||||||
| Balance | $ | 14,082.8 | $ | 5,953.8 | $ | 20,036.6 | $ | 7,362.7 | $ | 27,399.3 | $ | 14,306.2 | $ | 6,011.1 | $ | 20,317.3 | $ | 7,581.6 | $ | 27,898.9 | ||||||||||||||||||||||
| Original LTV | 73.2 | % | 66.3 | % | 77.9 | % | 73.0 | % | 66.3 | % | 77.8 | % | ||||||||||||||||||||||||||||||
|
|
|
|
|
|
|
|
|
|
|
|
|
|||||||||||||||||||||||||||||||
| • | 22% Florida junior lien concentration driving results |
| • | Junior lien, Florida net charge-offs represent 52% of 3Q11 net charge-offs but just 22% of Home Equity outstanding balances. |
| • | Net Home Equity charge-offs in Florida approximately 3.5 times non-Florida net charge-off rate |
| • | Home Equity origination quality solid with an average FICO of 773 and an average LTV of 61%; Property value declines driving losses |
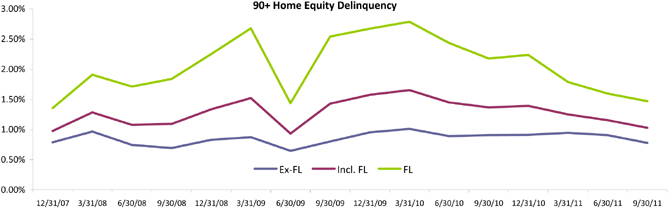
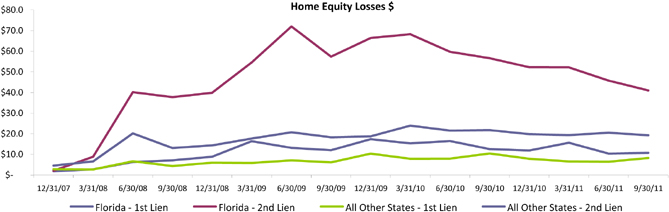
| (1) | Total loans include first liens on residential first mortgage and home equity, as well as junior liens on home equity |
| Notes: | * Recoveries are pro-rated based on charge-off balances. |
| * | Balances shown on an ending basis. Net loss rates calculated using average balances |
| * | Original LTVs shown for current period only; prior period LTVs not materially different |
| Regions Financial Corporation and Subsidiaries Financial Supplement to Third Quarter 2011 Earnings Release |
Page 17 |
Investor Real Estate Analysis
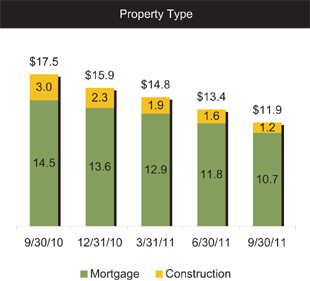
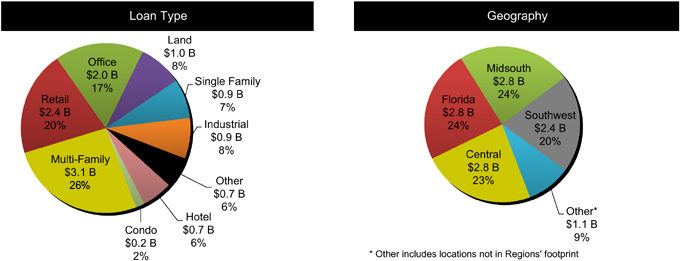
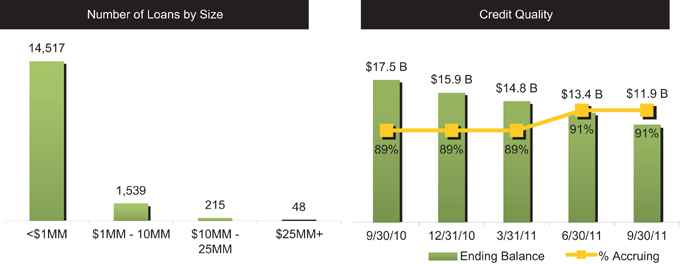
| Regions Financial Corporation and Subsidiaries Financial Supplement to Third Quarter 2011 Earnings Release |
Page 18 |
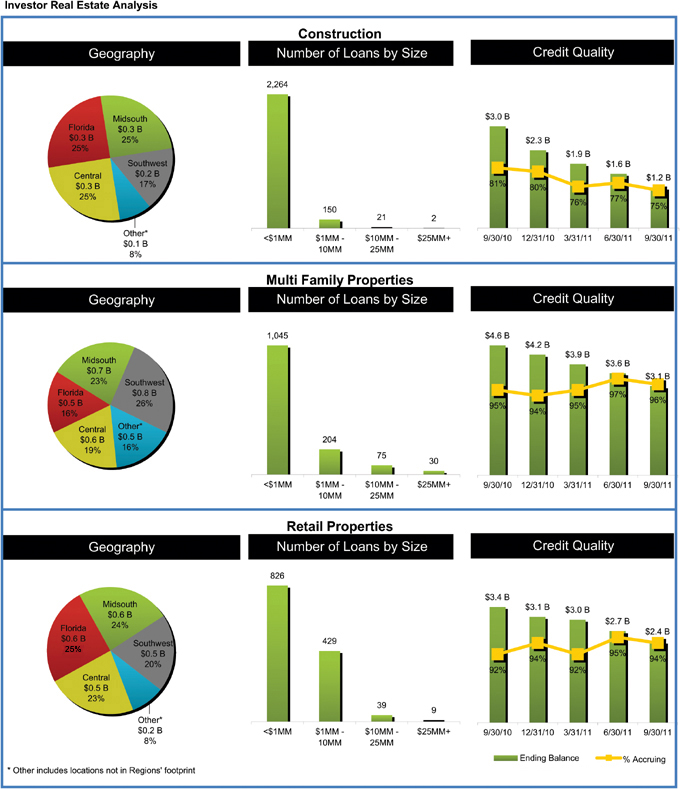
| Regions Financial Corporation and Subsidiaries Financial Supplement to Third Quarter 2011 Earnings Release |
Page 19 |
Reconciliation to GAAP Financial Measures
The table below presents computations of earnings and certain other financial measures, excluding regulatory charge related tax benefit (non-GAAP). The regulatory charge related tax benefit is included in financial results presented in accordance with generally accepted accounting principles (GAAP). Regions believes that the exclusion of the regulatory charge related tax benefit in expressing earnings and certain other financial measures, including “earnings (loss) per common share, excluding regulatory charge related tax benefit”, “return on average assets, excluding regulatory charge related tax benefit” and “return on average tangible common stockholders’ equity, excluding regulatory charge and related tax benefit” (explained on next page) provides a meaningful base for period-to-period comparisons, which management believes will assist investors in analyzing the operating results of the Company and predicting future performance. These non-GAAP financial measures are also used by management to assess the performance of Regions’ business because management does not consider the regulatory charge and related tax benefit to be relevant to ongoing operating results. Management and the Board of Directors utilize these non-GAAP financial measures for the following purposes: preparation of Regions’ operating budgets; monthly financial performance reporting; monthly close-out “flash” reporting of consolidated results (management only); and presentations to investors of company performance. Regions believes that presenting these non-GAAP financial measures will permit investors to assess the performance of the Company on the same basis as that applied by management and the Board of Directors. Non-GAAP financial measures have inherent limitations, are not required to be uniformly applied and are not audited. To mitigate these limitations, Regions has policies and procedures in place to identify and address expenses that qualify for non-GAAP presentation, including authorization and system controls to ensure accurate period to period comparisons. Although these non-GAAP financial measures are frequently used by stakeholders in the evaluation of a company, they have limitations as analytical tools, and should not be considered in isolation, or as a substitute for analyses of results as reported under GAAP. In particular, a measure of earnings that excludes the regulatory charge and related tax benefit does not represent the amount that effectively accrues directly to stockholders (i.e. the regulatory charge is a reduction in earnings and stockholders’ equity).
| As of and for Quarter Ended | ||||||||||||||||||||||||
| ($ amounts in millions, except per share data) |
9/30/11 | 6/30/11 | 3/31/11 | 12/31/10 | 9/30/10 | |||||||||||||||||||
| Income (loss): |
||||||||||||||||||||||||
| Net income (loss) (GAAP) |
$ | 155 | $ | 109 | $ | 69 | $ | 89 | $ | (155 | ) | |||||||||||||
| Preferred dividends and accretion (GAAP) |
(54 | ) | (54 | ) | (52 | ) | (53 | ) | (54 | ) | ||||||||||||||
|
|
|
|
|
|
|
|
|
|
|
|||||||||||||||
| Net income (loss) available to common shareholders (GAAP) |
A | $ | 101 | $ | 55 | $ | 17 | $ | 36 | $ | (209 | ) | ||||||||||||
|
|
|
|
|
|
|
|
|
|
|
|||||||||||||||
| Net income (loss) available to common shareholders (GAAP) |
$ | 101 | $ | 55 | $ | 17 | $ | 36 | $ | (209 | ) | |||||||||||||
| Regulatory charge related tax benefit (1) |
— | (44 | ) | — | — | — | ||||||||||||||||||
|
|
|
|
|
|
|
|
|
|
|
|||||||||||||||
| Income (loss) available to common shareholders, excluding regulatory charge related tax benefit (non-GAAP) |
B | $ | 101 | $ | 11 | $ | 17 | $ | 36 | $ | (209 | ) | ||||||||||||
|
|
|
|
|
|
|
|
|
|
|
|||||||||||||||
| Weighted-average diluted shares |
C | 1,261 | 1,260 | 1,259 | 1,259 | 1,257 | ||||||||||||||||||
| Earnings (loss) per common share—diluted (GAAP) |
A/C | $ | 0.08 | $ | 0.04 | $ | 0.01 | $ | 0.03 | $ | (0.17 | ) | ||||||||||||
| Earnings (loss) per common share, excluding regulatory charge related tax benefit—diluted (non-GAAP) |
B/C | $ | 0.08 | $ | 0.01 | $ | 0.01 | $ | 0.03 | $ | (0.17 | ) | ||||||||||||
| (1) | In the second quarter of 2010, Regions recorded a $200 million charge to account for a probable, reasonably estimable loss related to a pending settlement of regulatory matters. At that time, Regions assumed that the entire charge would be non-deductible for income tax purposes. The settlement was finalized during the second quarter of 2011. At the time of settlement, Regions had better information related to tax implications. Approximately $125 million of the settlement charge will be deductible for federal income tax purposes. Accordingly, during the second quarter of 2011, Regions adjusted federal income taxes to account for the impact of the deduction. The adjustment reduced Regions’ provision for income taxes. The schedule above reduces net income available to common shareholders (GAAP) for the quarter ended June 30, 2011 by the related federal income tax benefit to arrive at the non-GAAP measure. |
| Regions Financial Corporation and Subsidiaries Financial Supplement to Third Quarter 2011 Earnings Release |
Page 20 |
Reconciliation to GAAP Financial Measures
The table below presents computations of the efficiency ratio (non-GAAP), which is a measure of productivity, generally calculated as non-interest expense divided by total revenue. Management uses the efficiency ratio to monitor performance and believes this measure provides meaningful information to investors. Non-interest expense (GAAP) is presented excluding certain adjustments to arrive at adjusted non-interest expense (non-GAAP), which is the numerator for the efficiency ratio. Net interest income on a fully taxable-equivalent basis (GAAP) and non-interest income (GAAP) are added together to arrive at total revenue (GAAP). Adjustments are made to arrive at adjusted total revenue (non-GAAP), which is the denominator for the efficiency ratio. Regions believes that the exclusion of these adjustments provides a meaningful base for period-to-period comparisons, which management believes will assist investors in analyzing the operating results of the Company and predicting future performance. These non-GAAP financial measures are also used by management to assess the performance of Regions’ business. It is possible that the activities related to the adjustments may recur; however, management does not consider the activities related to the adjustments to be indications of ongoing operations. Regions believes that presentation of these non-GAAP financial measures will permit investors to assess the performance of the Company on the same basis as that applied by management.
| As of and for Quarter Ended | ||||||||||||||||||||||
| ($ amounts in millions) |
9/30/11 | 6/30/11 | 3/31/11 | 12/31/10 | 9/30/10 | |||||||||||||||||
| Non-interest expense (GAAP) |
$ | 1,066 | $ | 1,198 | $ | 1,167 | $ | 1,266 | $ | 1,163 | ||||||||||||
| Adjustments: |
||||||||||||||||||||||
| Loss on early extinguishment of debt |
— | — | — | (55 | ) | — | ||||||||||||||||
| Securities impairment, net |
— | — | — | — | (1 | ) | ||||||||||||||||
| Branch consolidation and property and equipment charges |
— | (77 | ) | — | — | — | ||||||||||||||||
|
|
|
|
|
|
|
|
|
|
|
|||||||||||||
| Adjusted non-interest expense (non-GAAP) |
D | $ | 1,066 | $ | 1,121 | $ | 1,167 | $ | 1,211 | $ | 1,162 | |||||||||||
|
|
|
|
|
|
|
|
|
|
|
|||||||||||||
| Net interest income, taxable-equivalent basis (GAAP) |
$ | 866 | $ | 872 | $ | 872 | $ | 886 | $ | 876 | ||||||||||||
| Non-interest income (GAAP) |
745 | 781 | 843 | 1,213 | 750 | |||||||||||||||||
| Adjustments: |
||||||||||||||||||||||
| Securities (gains) losses, net |
1 | (24 | ) | (82 | ) | (333 | ) | (2 | ) | |||||||||||||
| Leveraged lease termination (gains) losses, net |
2 | — | — | (59 | ) | — | ||||||||||||||||
| Loss (gain) on sale of mortgage loans |
— | — | 3 | (26 | ) | — | ||||||||||||||||
|
|
|
|
|
|
|
|
|
|
|
|||||||||||||
| Adjusted non-interest income (non-GAAP) |
748 | 757 | 764 | 795 | 748 | |||||||||||||||||
|
|
|
|
|
|
|
|
|
|
|
|||||||||||||
| Adjusted total revenue (non-GAAP) |
E | $ | 1,614 | $ | 1,629 | $ | 1,636 | $ | 1,681 | $ | 1,624 | |||||||||||
|
|
|
|
|
|
|
|
|
|
|
|||||||||||||
| Efficiency ratio (non-GAAP) |
D/E | 66.0 | % | 68.8 | % | 71.3 | % | 72.0 | % | 71.6 | % | |||||||||||
| Regions Financial Corporation and Subsidiaries Financial Supplement to Third Quarter 2011 Earnings Release |
Page 21 |
Reconciliation to GAAP Financial Measures
The following tables provide calculations of “return on average tangible common stockholders’ equity”, end of period “tangible common stockholders’ equity” ratios and a reconciliation of stockholders’ equity (GAAP) to Tier 1 capital (regulatory) and to “Tier 1 common equity” (non-GAAP). Tangible common stockholders’ equity ratios have become a focus of some investors and management believes they may assist investors in analyzing the capital position of the Company absent the effects of intangible assets and preferred stock. Traditionally, the Federal Reserve and other banking regulatory bodies have assessed a bank’s capital adequacy based on Tier 1 capital, the calculation of which is codified in federal banking regulations. In connection with the Supervisory Capital Assessment Program (“SCAP”), these regulators began supplementing their assessment of the capital adequacy of a bank based on a variation of Tier 1 capital, known as Tier 1 common equity. While not codified, analysts and banking regulators have assessed Regions’ capital adequacy using the tangible common stockholders’ equity and/or the Tier 1 common equity measure. Because tangible common stockholders’ and Tier 1 common equity are not formally defined by GAAP or codified in the federal banking regulations, these measures are considered to be non-GAAP financial measures and other entities may calculate them differently than Regions’ disclosed calculations. Since analysts and banking regulators may assess Regions’ capital adequacy using tangible common stockholders’ equity and Tier 1 common equity, we believe that it is useful to provide investors the ability to assess Regions’ capital adequacy on these same bases.
Tier 1 common equity is often expressed as a percentage of risk-weighted assets. Under the risk-based capital framework, a company’s balance sheet assets and credit equivalent amounts of off-balance sheet items are assigned to one of four broad risk categories. The aggregated dollar amount in each category is then multiplied by the risk-weighted category. The resulting weighted values from each of the four categories are added together and this sum is the risk-weighted assets total that, as adjusted, comprises the denominator of certain risk-based capital ratios. Tier 1 capital is then divided by this denominator (risk-weighted assets) to determine the Tier 1 capital ratio. Adjustments are made to Tier 1 capital to arrive at Tier 1 common equity. Tier 1 common equity is also divided by the risk-weighted assets to determine the Tier 1 common equity ratio. The amounts disclosed as risk-weighted assets are calculated consistent with banking regulatory requirements.
| As of and for Quarter Ended | ||||||||||||||||||||||
| ($ amounts in millions, except per share data) |
9/30/11 | 6/30/11 | 3/31/11 | 12/31/10 | 9/30/10 | |||||||||||||||||
| RETURN ON AVERAGE ASSETS |
||||||||||||||||||||||
| Average assets (GAAP) |
F | $ | 129,759 | $ | 130,678 | $ | 131,212 | $ | 133,334 | $ | 133,729 | |||||||||||
| Return on average assets (GAAP) (1) |
A/F | 0.31 | % | 0.17 | % | 0.05 | % | 0.11 | % | (0.62 | %) | |||||||||||
|
|
|
|
|
|
|
|
|
|
|
|||||||||||||
| Return on average assets, excluding regulatory charge related tax benefit (non-GAAP) (1) |
B/F | 0.31 | % | 0.03 | % | 0.05 | % | 0.11 | % | (0.62 | %) | |||||||||||
|
|
|
|
|
|
|
|
|
|
|
|||||||||||||
| RETURN ON AVERAGE TANGIBLE COMMON STOCKHOLDERS’ EQUITY |
||||||||||||||||||||||
| Average stockholders’ equity (GAAP) |
$ | 17,069 | $ | 16,796 | $ | 16,684 | $ | 17,046 | $ | 17,382 | ||||||||||||
| Less: Average intangible assets (GAAP) |
5,998 | 5,909 | 5,935 | 5,961 | 5,989 | |||||||||||||||||
| Average deferred tax liability related to intangibles (GAAP) |
(224 | ) | (230 | ) | (237 | ) | (243 | ) | (250 | ) | ||||||||||||
| Average preferred equity (GAAP) |
3,402 | 3,392 | 3,383 | 3,374 | 3,364 | |||||||||||||||||
|
|
|
|
|
|
|
|
|
|
|
|||||||||||||
| Average tangible common stockholders’ equity (non-GAAP) |
G | $ | 7,893 | $ | 7,725 | $ | 7,603 | $ | 7,954 | $ | 8,279 | |||||||||||
| Return on average tangible common stockholders’ equity (GAAP) (1) |
A/G | 5.05 | % | 2.88 | % | 0.89 | % | 1.78 | % | (10.00 | %) | |||||||||||
|
|
|
|
|
|
|
|
|
|
|
|||||||||||||
| Return on average tangible common stockholders’ equity, excluding regulatory charge related tax benefit (non-GAAP) (1) |
B/G | 5.05 | % | 0.57 | % | 0.89 | % | 1.78 | % | (10.00 | %) | |||||||||||
|
|
|
|
|
|
|
|
|
|
|
|||||||||||||
| TANGIBLE COMMON RATIOS |
||||||||||||||||||||||
| Stockholders’ equity (GAAP) |
$ | 17,263 | $ | 16,888 | $ | 16,619 | $ | 16,734 | $ | 17,163 | ||||||||||||
| Less: Preferred equity (GAAP) |
3,409 | 3,399 | 3,389 | 3,380 | 3,370 | |||||||||||||||||
| Intangible assets (GAAP) |
6,039 | 5,981 | 5,919 | 5,946 | 5,975 | |||||||||||||||||
| Deferred tax liability related to intangibles (GAAP) |
(220 | ) | (227 | ) | (233 | ) | (240 | ) | (246 | ) | ||||||||||||
|
|
|
|
|
|
|
|
|
|
|
|||||||||||||
| Tangible common stockholders’ equity (non-GAAP) |
H | $ | 8,035 | $ | 7,735 | $ | 7,544 | $ | 7,648 | $ | 8,064 | |||||||||||
| Total assets (GAAP) |
$ | 129,762 | $ | 130,908 | $ | 131,756 | $ | 132,351 | $ | 133,498 | ||||||||||||
| Less: Intangible assets (GAAP) |
6,039 | 5,981 | 5,919 | 5,946 | 5,975 | |||||||||||||||||
| Deferred tax liability related to intangibles (GAAP) |
(220 | ) | (227 | ) | (233 | ) | (240 | ) | (246 | ) | ||||||||||||
|
|
|
|
|
|
|
|
|
|
|
|||||||||||||
| Tangible assets (non-GAAP) |
I | $ | 123,943 | $ | 125,154 | $ | 126,070 | $ | 126,645 | $ | 127,769 | |||||||||||
| Shares outstanding—end of quarter |
J | 1,259 | 1,259 | 1,256 | 1,256 | 1,256 | ||||||||||||||||
| Tangible common stockholders’ equity to tangible assets (non-GAAP) |
H/I | 6.48 | % | 6.18 | % | 5.98 | % | 6.04 | % | 6.31 | % | |||||||||||
| Tangible common book value per share (non-GAAP) |
H/J | $ | 6.38 | $ | 6.15 | $ | 6.00 | $ | 6.09 | $ | 6.42 | |||||||||||
| TIER 1 COMMON RISK-BASED RATIO (2) |
||||||||||||||||||||||
| Stockholders’ equity (GAAP) |
$ | 17,263 | $ | 16,888 | $ | 16,619 | $ | 16,734 | $ | 17,163 | ||||||||||||
| Accumulated other comprehensive (income) loss |
(92 | ) | 177 | 387 | 260 | (208 | ) | |||||||||||||||
| Non-qualifying goodwill and intangibles |
(5,649 | ) | (5,668 | ) | (5,686 | ) | (5,706 | ) | (5,729 | ) | ||||||||||||
| Disallowed deferred tax assets |
(506 | ) | (498 | ) | (463 | ) | (424 | ) | (427 | ) | ||||||||||||
| Disallowed servicing assets |
(35 | ) | (35 | ) | (28 | ) | (27 | ) | (20 | ) | ||||||||||||
| Qualifying non-controlling interests |
92 | 92 | 92 | 92 | 92 | |||||||||||||||||
| Qualifying trust preferred securities |
846 | 846 | 846 | 846 | 846 | |||||||||||||||||
|
|
|
|
|
|
|
|
|
|
|
|||||||||||||
| Tier 1 capital (regulatory) |
$ | 11,919 | $ | 11,802 | $ | 11,767 | $ | 11,775 | $ | 11,717 | ||||||||||||
| Qualifying non-controlling interests |
(92 | ) | (92 | ) | (92 | ) | (92 | ) | (92 | ) | ||||||||||||
| Qualifying trust preferred securities |
(846 | ) | (846 | ) | (846 | ) | (846 | ) | (846 | ) | ||||||||||||
| Preferred stock |
(3,409 | ) | (3,399 | ) | (3,389 | ) | (3,380 | ) | (3,370 | ) | ||||||||||||
|
|
|
|
|
|
|
|
|
|
|
|||||||||||||
| Tier 1 common equity (non-GAAP) |
K | $ | 7,572 | $ | 7,465 | $ | 7,440 | $ | 7,457 | $ | 7,409 | |||||||||||
| Risk-weighted assets (regulatory) |
L | 92,791 | 93,865 | 93,929 | 94,966 | 97,088 | ||||||||||||||||
| Tier 1 common risk-based ratio (non-GAAP) |
K/L | 8.2 | % | 7.9 | % | 7.9 | % | 7.9 | % | 7.6 | % | |||||||||||
|
|
|
|
|
|
|
|
|
|
|
|||||||||||||
| (1) | Income statement amounts have been annualized in calculation |
| (2) | Current quarter amount and the resulting ratio is estimated |
| Regions Financial Corporation and Subsidiaries Financial Supplement to Third Quarter 2011 Earnings Release |
Page 22 |
Reconciliation to GAAP Financial Measures
The following tables provide calculations of Tier 1 capital and Tier 1 common, based on Regions’ current understanding of Basel III requirements. Regions currently calculates its risk-based capital ratios under guidelines adopted by the Federal Reserve based on the 1988 Capital Accord (“Basel I”) of the Basel Committee on Banking Supervision (the “Basel Committee”). In December 2010, the Basel Committee released its final framework for Basel III, which will strengthen international capital and liquidity regulation. When implemented by U.S. bank regulatory agencies and fully phased-in, Basel III will change capital requirements and place greater emphasis on common equity. Implementation of Basel III will begin on January 1, 2013, and will be phased in over a multi-year period. The U.S. bank regulatory agencies have not yet finalized regulations governing the implementation of Basel III. Accordingly, the calculations provided below are estimates, based on Regions’ current understanding of the framework, including the Company’s reading of the requirements, and informal feedback received through the regulatory process. Regions’ understanding of the framework is evolving and will likely change as the regulations are finalized. Because the Basel III implementation regulations are not formally defined by GAAP and have not yet been finalized and codified, these measures are considered to be non-GAAP financial measures, and other entities may calculate them differently from Regions’ disclosed calculations. Since analysts and banking regulators may assess Regions’ capital adequacy using the Basel III framework, we believe that it is useful to provide investors the ability to assess Regions’ capital adequacy on the same basis.
| ($ amounts in millions) |
9/30/11 | |||
| Stockholders’ equity (GAAP) |
$ | 17,263 | ||
| Non-qualifying goodwill and intangibles (1) |
(5,820 | ) | ||
| Adjustments, including other comprehensive income related to cash flow hedges, disallowed deferred tax assets, threshold deductions and other adjustments |
(809 | ) | ||
|
|
|
|||
| $ | 10,634 | |||
| Qualifying non-controlling interests |
4 | |||
|
|
|
|||
| Basel III Tier 1 Capital (non-GAAP) |
$ | 10,638 | ||
| Basel III Tier 1 Capital (non-GAAP) |
$ | 10,638 | ||
| Preferred Stock |
(3,409 | ) | ||
| Qualifying non-controlling interests |
(4 | ) | ||
|
|
|
|||
| Basel III Tier 1 Common (non-GAAP) |
$ | 7,225 | ||
|
|
|
|||
| Basel I risk-weighted assets |
92,791 | |||
| Basel III risk-weighted assets (2) |
94,389 | |||
| Minimum | ||||||||||||||
| Basel III Tier 1 Capital Ratio |
11.3 | % | 8.5 | % | ||||||||||
| Basel III Tier 1 Common Ratio |
7.7 | % | 7.0 | % | ||||||||||
| (1) | Under Basel III, regulatory capital must be reduced by purchased credit card relationship intangible assets. These assets are partially allowed in Basel I capital. |
| (2) | Regions continues to develop systems and internal controls to precisely calculate risk-weighted assets as required by Basel III. The amount included above is a reasonable approximation, based on our understanding of the requirements. |
| Regions Financial Corporation and Subsidiaries Financial Supplement to Third Quarter 2011 Earnings Release |
Page 23 |
Forward-Looking Statements
This supplement may include forward-looking statements which reflect Regions’ current views with respect to future events and financial performance. The Private Securities Litigation Reform Act of 1995 (“the Act”) provides a safe harbor for forward-looking statements which are identified as such and are accompanied by the identification of important factors that could cause actual results to differ materially from the forward-looking statements. For these statements, we, together with our subsidiaries, claim the protection afforded by the safe harbor in the Act. Forward-looking statements are not based on historical information, but rather are related to future operations, strategies, financial results or other developments. Forward-looking statements are based on management’s expectations as well as certain assumptions and estimates made by, and information available to, management at the time the statements are made. Those statements are based on general assumptions and are subject to various risks, uncertainties and other factors that may cause actual results to differ materially from the views, beliefs and projections expressed in such statements. These risks, uncertainties and other factors include, but are not limited to, those described below:
| • | The Dodd-Frank Wall Street Reform and Consumer Protection Act (the “Dodd-Frank Act”) became law on July 21, 2010 and a number of legislative, regulatory and tax proposals remain pending. Additionally, the U.S. Treasury and federal banking regulators continue to implement, but are also beginning to wind down, a number of programs to address capital and liquidity issues in the banking system. Proposed rules, including those that are part of the Basel III process, could require banking institutions to increase levels of capital. All of the foregoing may have significant effects on Regions and the financial services industry, the exact nature of which cannot be determined at this time. |
| • | Regions’ ability to mitigate the impact of the Dodd-Frank Act on debit interchange fees through revenue enhancements and other revenue measures, which will depend on various factors, including the acceptance by our customers of modified fee structures for Regions’ products and services. |
| • | The impact of compensation and other restrictions imposed under the Troubled Asset Relief Program (“TARP”) until Regions repays the outstanding preferred stock and warrant issued under TARP including restrictions on Regions’ ability to attract and retain talented executives and associates. |
| • | Possible additional loan losses, impairment of goodwill and other intangibles, and adjustment of valuation allowances on deferred tax assets and the impact on earnings and capital. |
| • | Possible changes in interest rates may increase funding costs and reduce earning asset yields, thus reducing margins. Increases in benchmark interest rates would also increase debt service requirements for customers whose terms include a variable interest rate, which may negatively impact the ability of borrowers to pay as contractually obligated. |
| • | Possible changes in general economic and business conditions in the United States in general and in the communities Regions serves in particular, including any prolonging or worsening of the current unfavorable economic conditions, including unemployment levels. |
| • | Possible changes in the creditworthiness of customers and the possible impairment of the collectability of loans. |
| • | Possible changes in trade, monetary and fiscal policies, laws and regulations, and other activities of governments, agencies, and similar organizations may have an adverse effect on business. |
| • | The current stresses in the financial and real estate markets, including possible continued deterioration in property values. |
| • | Regions’ ability to manage fluctuations in the value of assets and liabilities and off-balance sheet exposure so as to maintain sufficient capital and liquidity to support Regions’ business. |
| • | Regions’ ability to expand into new markets and to maintain profit margins in the face of competitive pressures. |
| • | Regions’ ability to develop competitive new products and services in a timely manner and the acceptance of such products and services by Regions’ customers and potential customers. |
| • | Regions’ ability to keep pace with technological changes. |
| • | Regions’ ability to effectively manage credit risk, interest rate risk, market risk, operational risk, legal risk, liquidity risk, and regulatory and compliance risk. |
| • | Regions’ ability to ensure adequate capitalization which is impacted by inherent uncertainties in forecasting credit losses. |
| • | The cost and other effects of material contingencies, including litigation contingencies and any adverse judicial, administrative or arbitral rulings or proceedings. |
| • | The effects of increased competition from both banks and non-banks. |
| • | The effects of geopolitical instability and risks such as terrorist attacks. |
| • | Possible changes in consumer and business spending and saving habits could affect Regions’ ability to increase assets and to attract deposits. |
| • | The effects of weather and natural disasters such as floods, droughts, wind, tornados and hurricanes and the effects of man-made disasters. |
| • | Possible downgrades in ratings issued by rating agencies |
| • | Potential dilution of holders of shares of Regions’ common stock resulting from the U.S. Treasury’s investment in TARP. |
| • | Possible changes in the speed of loan prepayments by Regions’ customers and loan origination or sales volumes. |
| • | Possible acceleration of prepayments on mortgage-backed securities due to low interest rates and the related acceleration of premium amortization on those securities. |
| • | The effects of problems encountered by larger or similar financial institutions that adversely affect Regions or the banking industry generally. |
| • | Regions’ ability to receive dividends from its subsidiaries. |
| • | The effects of the failure of any component of Regions’ business infrastructure which is provided by a third party. |
| • | Changes in accounting policies or procedures as may be required by the Financial Accounting Standards Board or other regulatory agencies. |
| • | The effects of any damage to Regions’ reputation resulting from developments related to any of the items identified above. |
The words “believe,” “expect,” “anticipate,” “project,” and similar expressions often signify forward-looking statements. You should not place undue reliance on any forward-looking statements, which speak only as of the date made. We assume no obligation to update or revise any forward-looking statements that are made from time to time.
The foregoing list of factors is not exhaustive; for discussion of these and other risks that may cause actual results to differ from expectations, look under the captions “Forward-Looking Statements” and “Risk Factors” in Regions’ Annual Report on Form 10-K for the year ended December 31, 2010 and Quarterly Reports on Form 10-Q for the quarters ended March 31, 2011 and June 30, 2011 as on file with the Securities and Exchange Commission.
Regions’ Investor Relations contact is List Underwood at (205) 801-0265; Regions’ Media contact is Tim Deighton at (205) 264-4551