Attached files

October 25, 2011
Third Quarter 2011 Conference Call

2
Forward-Looking Statements
This presentation contains forward-looking statements within the meaning of Section 27A of the Securities Act of
1933 and Section 21E of the Securities Exchange Act of 1934. All such statements, other than statements of
historical fact, are “forward-looking statements” within the meaning of the Private Securities Litigation Reform Act of
1995, including, without limitation, any projections of financial items; projections of contracting services activity; future
production volumes, results of exploration, exploitation, development, acquisition and operations expenditures, and
prospective reserve levels of properties or wells; projections of utilization; any statements of the plans, strategies and
objectives of management for future operations; any statements concerning developments; and any statements of
assumptions underlying any of the foregoing. These statements involve certain assumptions we made based on our
experience and perception of historical trends, current conditions, expected future developments and other factors
we believe are reasonable and appropriate under the circumstances. The forward-looking statements are subject to
a number of known and unknown risks, uncertainties and other factors that could cause our actual results to differ
materially. The risks, uncertainties and assumptions referred to above include the performance of contracts by
suppliers, customers and partners; actions by governmental and regulatory authorities; operating hazards and
delays; employee management issues; local, national and worldwide economic conditions; uncertainties inherent in
the exploration for and development of oil and gas and in estimating reserves; complexities of global political and
economic developments; geologic risks, volatility of oil and gas prices and other risks described from time to time in
our reports filed with the Securities and Exchange Commission (“SEC”), including the Company’s most recently filed
Annual Report on Form 10-K and in the Company’s other filings with the SEC. Free copies of the reports can be
found at the SEC’s website, www.SEC.gov. You should not place undue reliance on these forward-looking
statements which speak only as of the date of this presentation and the associated press release. We assume no
obligation or duty and do not intend to update these forward-looking statements except as required by the securities
laws.
References to quantities of oil or gas include amounts we believe will ultimately be produced, and may include
“proved reserves” and quantities of oil or gas that are not yet classified as “proved reserves” under SEC definitions.
Statements of oil and gas reserves are estimates based on assumptions and may be imprecise. Investors are urged
to consider closely the disclosure regarding reserves in our most recently filed Annual Report on Form 10-K and any
subsequent Quarterly Reports on Form 10-Q.
3
Presentation Outline
• Executive Summary
Summary of Q3 2011 Results (pg. 4)
• Operational Highlights by Segment
Contracting Services (pg. 9)
Oil & Gas (pg. 16)
• Key Balance Sheet Metrics (pg. 19)
• 2011 Outlook (pg. 21)
• Non-GAAP Reconciliations (pg. 25)
• Questions & Answers
Welding and spooling pipe at Ingleside Spoolbase
4
Executive
Summary
Summary
5
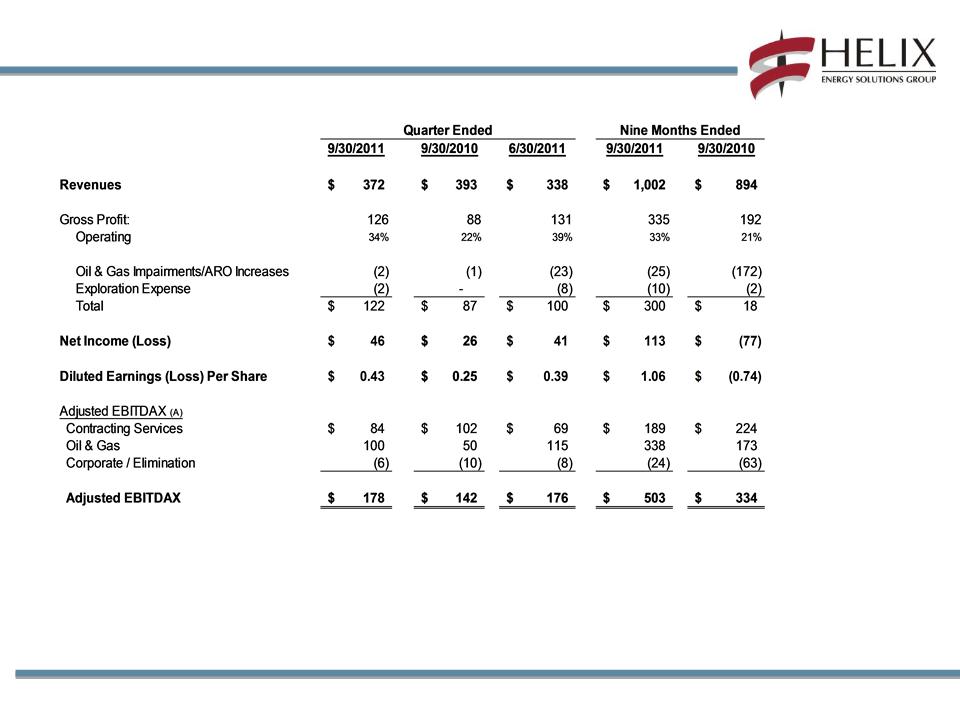
Executive Summary
($ in millions, except per share data)
(A) See non-GAAP reconciliations on slides 26-27.

6
Executive Summary
• Q3 2011 EPS of $0.43 per diluted share driven by continuing strong results from the oil and gas
business and robust activity levels for the well intervention and robotics businesses
business and robust activity levels for the well intervention and robotics businesses
• Contracting Services
o 99% utilization in well intervention business
o Continued improvement in ROV and trenching utilization in the robotics business
o Significantly improved utilization in subsea construction with Express and Intrepid achieving 95%
utilization in the third quarter
utilization in the third quarter
• Oil and Gas
o Third quarter average production rate of 127 Mmcfe/d (69% oil)
§ July production impacted by scheduled downtime of third party pipeline servicing Phoenix
field (~10 days)
field (~10 days)
§ August production for Phoenix field impacted by third party pipeline flow restrictions
(~7 days)
(~7 days)
§ September production impacted by third party pipeline safety shutdowns associated with
Tropical Storm Lee (~7 days)
Tropical Storm Lee (~7 days)
o Production through October 23 averaged approximately 128 Mmcfe/d (~70% oil)
§ October production impacted by third party pipeline disruption affecting our Danny well in the
Bushwood field
Bushwood field

7
Executive Summary
• Oil and Gas (continued)
o Oil and gas production totaled 11.7 Bcfe in Q3 2011 versus 12.7 Bcfe in Q2 2011 (year-to-date
production of 38.7 Bcfe)
production of 38.7 Bcfe)
§ Avg realized price for oil of $100.93 / bbl ($101.43 / bbl in Q2 2011), inclusive of hedges
§ Avg realized price for natural gas and natural gas liquids (NGLs) of $6.15 / Mcf ($6.17 / Mcf
in Q2 2011), inclusive of hedges
in Q2 2011), inclusive of hedges
• Gas price realizations benefited from sales of natural gas liquids
• NGL production of 0.8 Bcfe in both Q3 2011 and Q2 2011
• Higher tax rate in Q3 (33%) due to higher portion of U.S. income
• Balance sheet continues to strengthen
o Repurchased $75 million of senior unsecured notes
o Cash decreased to $375 million at 9/30/2011 from $414 million at 6/30/2011 due to debt
repurchases
repurchases
o Liquidity* decreased to $933 million at 9/30/2011 from $965 million at 6/30/2011 (debt
repurchases)
repurchases)
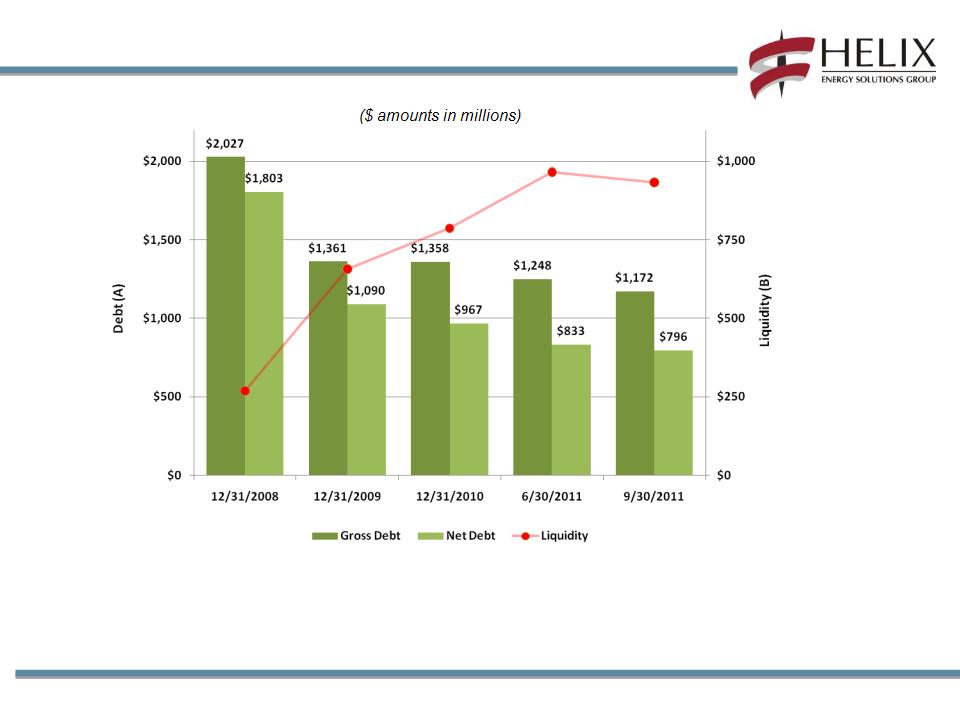
o Gross debt decreased to $1.17 billion at 9/30/2011 from $1.25 billion at 6/30/2011
o Net debt decreased to $796 million at 9/30/2011 from $833 million at 6/30/2011
*Liquidity as we define it is equal to cash and cash equivalents ($375 million), plus available capacity under our revolving credit facility ($558 million).
8
Operational
Highlights
9
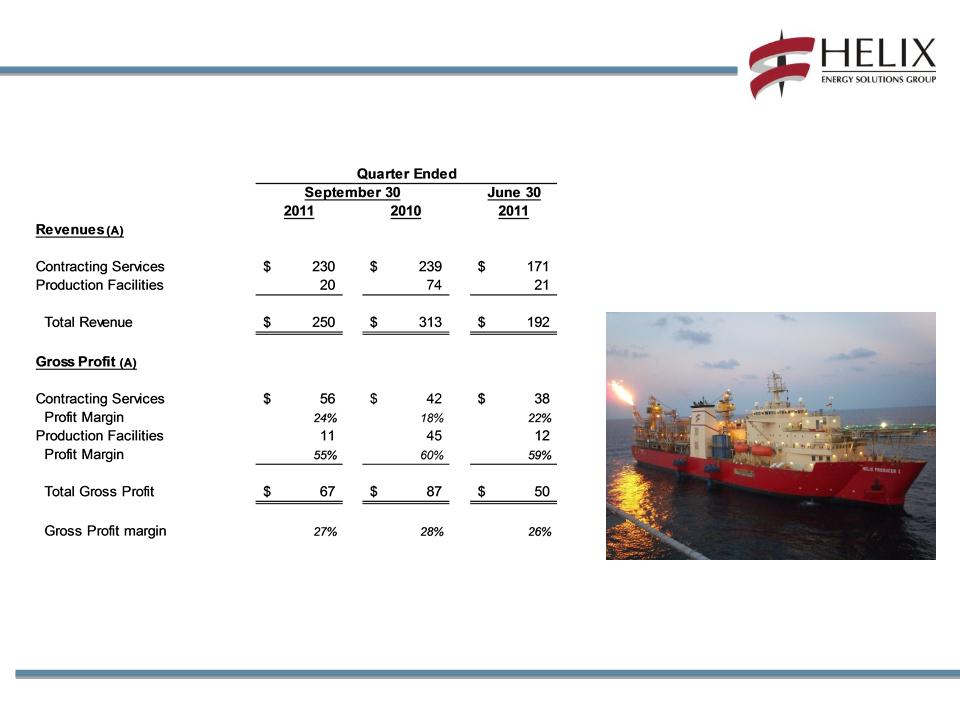
($ in millions, except percentages)
(A) See non-GAAP reconciliation on slides 26-27. Amounts are prior to intercompany
eliminations.
eliminations.
Contracting Services
• 99% utilization in Well Ops
• 63% utilization in Subsea Construction due
to improved activity levels for Express and
Intrepid
to improved activity levels for Express and
Intrepid
• Caesar in shipyard for planned upgrades;
completed sea trials in mid-October and
transited to Mexico for accommodations
project
completed sea trials in mid-October and
transited to Mexico for accommodations
project
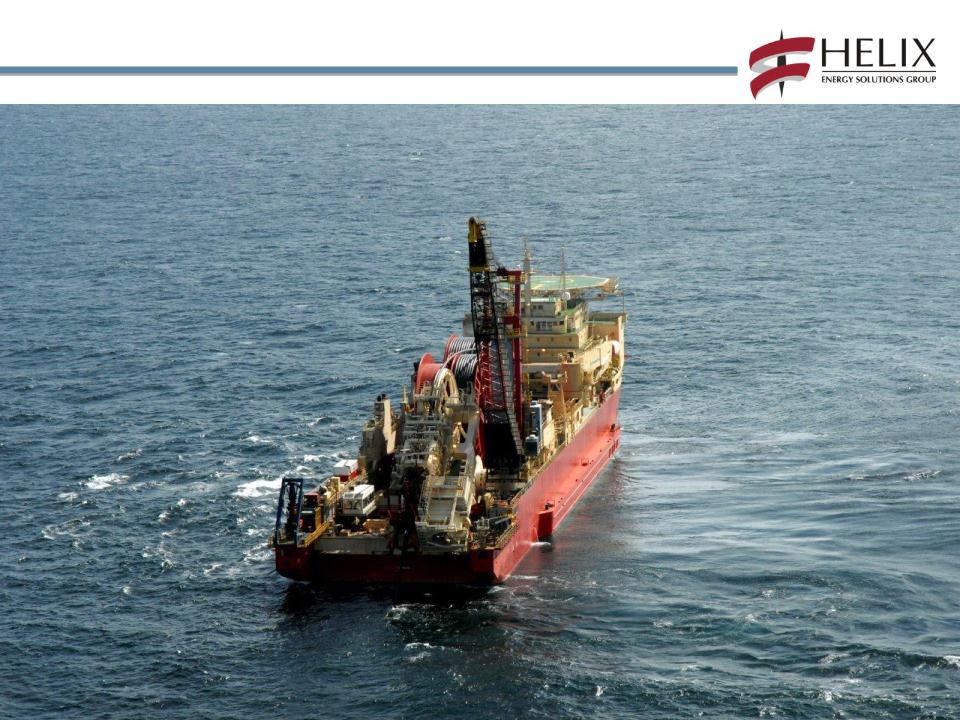
Helix Producer I deployed on Helix’s Phoenix field
in Green Canyon 237 (Gulf of Mexico)
10
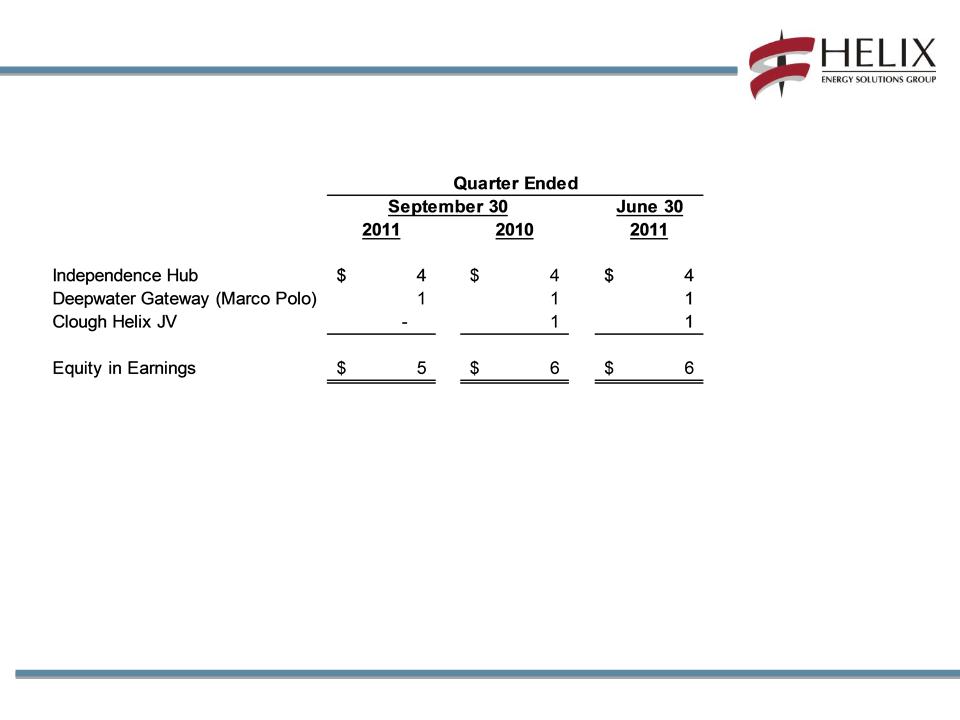
($ in millions)
Equity in Earnings of Equity Investments
11
Contracting Services - Well Ops
GOM
• Q4000 worked for Shell and Anadarko on multiple projects
throughout the third quarter
throughout the third quarter
• 100% utilization achieved in the third quarter
• Current backlog extends to Q4 2012 and is building into 2013
North Sea
• Seawell and Well Enhancer posted a combined 98%
utilization in the third quarter
utilization in the third quarter
• Strong outlook anticipated for both vessels for the rest of
2011; backlog building well into 2012
2011; backlog building well into 2012
Asia Pacific
• Normand Clough working for Clough Helix JV on a day rate
construction project for COOEC offshore China
construction project for COOEC offshore China
• Wellhead cutting system completed two wellhead removals in
Q3; scheduled to complete 10+ removals beginning in Q4
2012
Q3; scheduled to complete 10+ removals beginning in Q4
2012
Well Enhancer, operating in the North Sea, is the
world’s only monohull well intervention vessel
capable of deploying coiled tubing
12
Contracting Services - Robotics
• Strong chartered vessel utilization in all three
regions during the third quarter
regions during the third quarter
• Secured a three year ROV contract with Technip
utilizing two newly acquired ROVs
utilizing two newly acquired ROVs
• ROVDrill upgrades completed; initial project to
commence in the fourth quarter
commence in the fourth quarter
• Awarded a 30 day wind farm trenching project
utilizing the Island Pioneer, Deep Cygnus, T750,
T600, and i-Trencher scheduled to commence in
December
utilizing the Island Pioneer, Deep Cygnus, T750,
T600, and i-Trencher scheduled to commence in
December
• Expanding focus on renewable energy market
such as wind farm development
such as wind farm development
o New chartered vessel, Grand Canyon,
under construction with 2012 delivery
under construction with 2012 delivery
o Building new trencher, the T-1200, to be
paired with the Grand Canyon
paired with the Grand Canyon
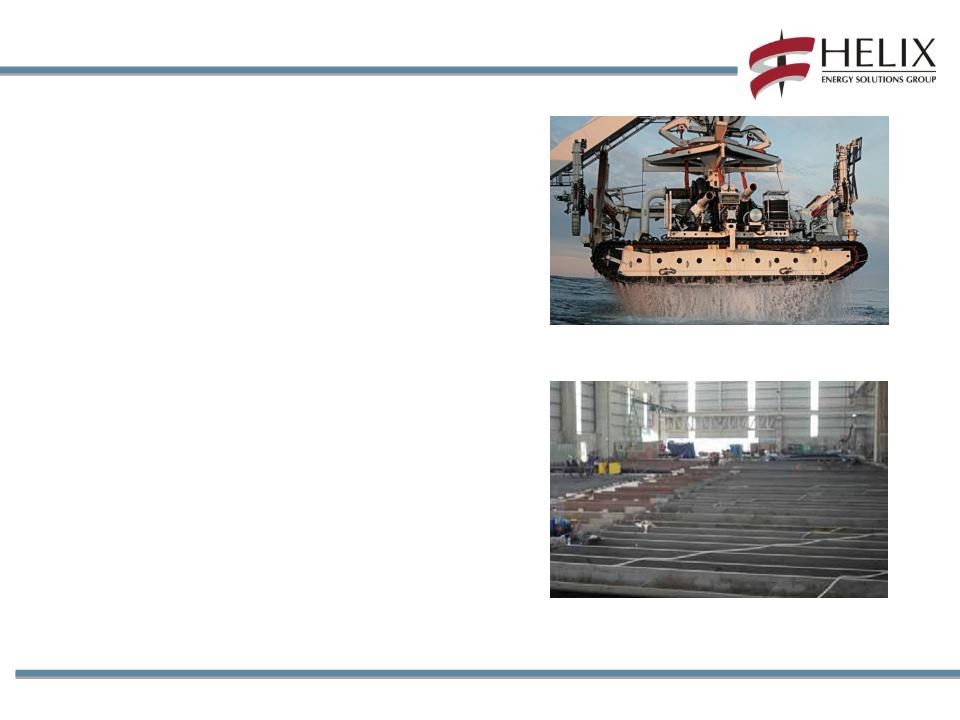
Various components of the Grand Canyon’s hull
being fabricated and welded in Turkey
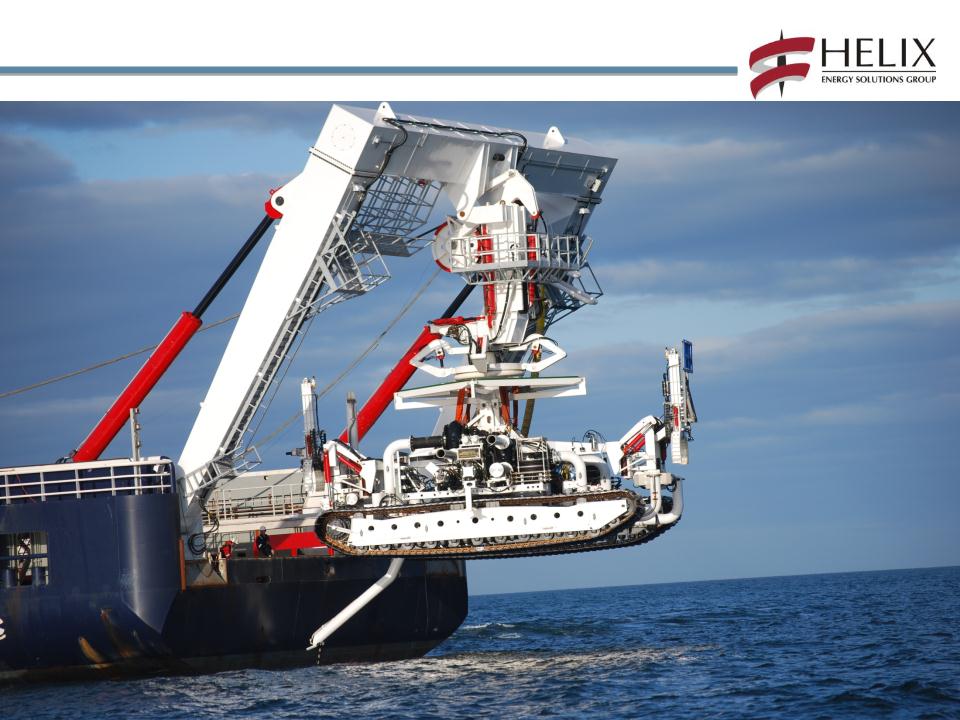
iTrencher being deployed in the North Sea
13
Contracting Services - Subsea Construction
Contracting Services - Subsea Construction
• Express and Intrepid posted a combined 95% utilization in the
third quarter (excluding the Caesar)
third quarter (excluding the Caesar)
• Express completed projects for Noble, Chevron and Newfield
• Intrepid completed projects for Noble and Chevron; deployed
to California on October 16
to California on October 16
• Caesar remained in the shipyard all of Q3 undergoing planned
maintenance and upgrades; left the shipyard in mid-October to
perform accommodations work in Mexico’s Bay of Campeche
maintenance and upgrades; left the shipyard in mid-October to
perform accommodations work in Mexico’s Bay of Campeche
Intrepid performed pipelay and saturation
diving operations in the Gulf of Mexico
during the third quarter
14
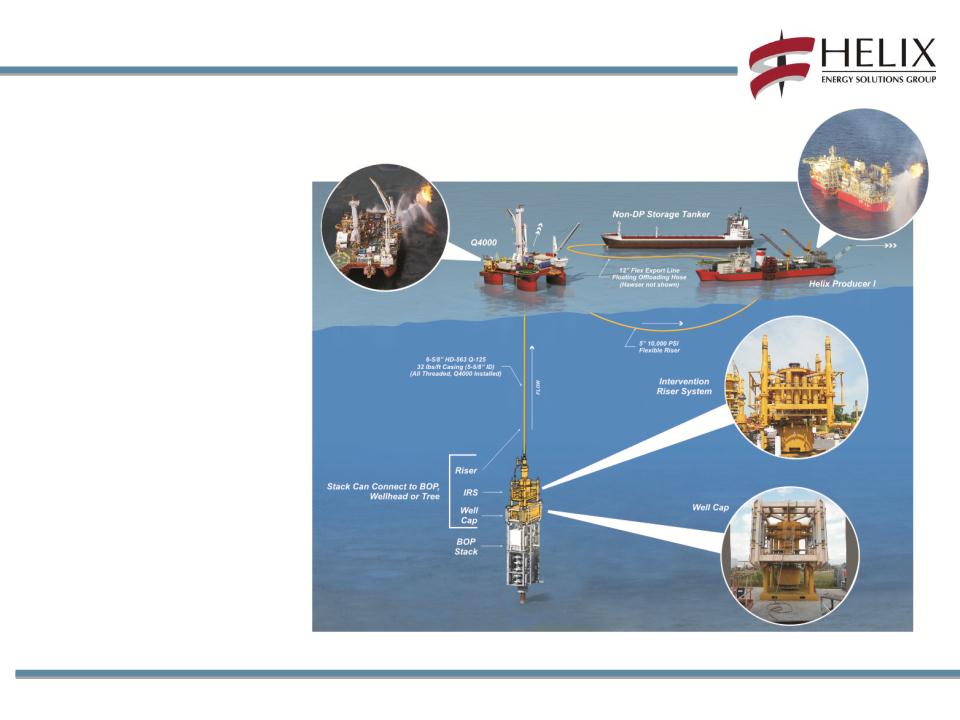
Helix Fast Response System (HFRS)
• Utilizes vessels and subsea
systems proven in Gulf of
Mexico spill response and
containment efforts
systems proven in Gulf of
Mexico spill response and
containment efforts
• Capability to capture and
process up to 55,000 bpd in
water depths to 10,000 feet at
15,000 psi
process up to 55,000 bpd in
water depths to 10,000 feet at
15,000 psi
• 24 independent E&P operators
have signed on to include HFRS
in drilling permit applications
have signed on to include HFRS
in drilling permit applications
• Cited as spill response and
containment plan in 38
approved deepwater permits to
date
containment plan in 38
approved deepwater permits to
date
15
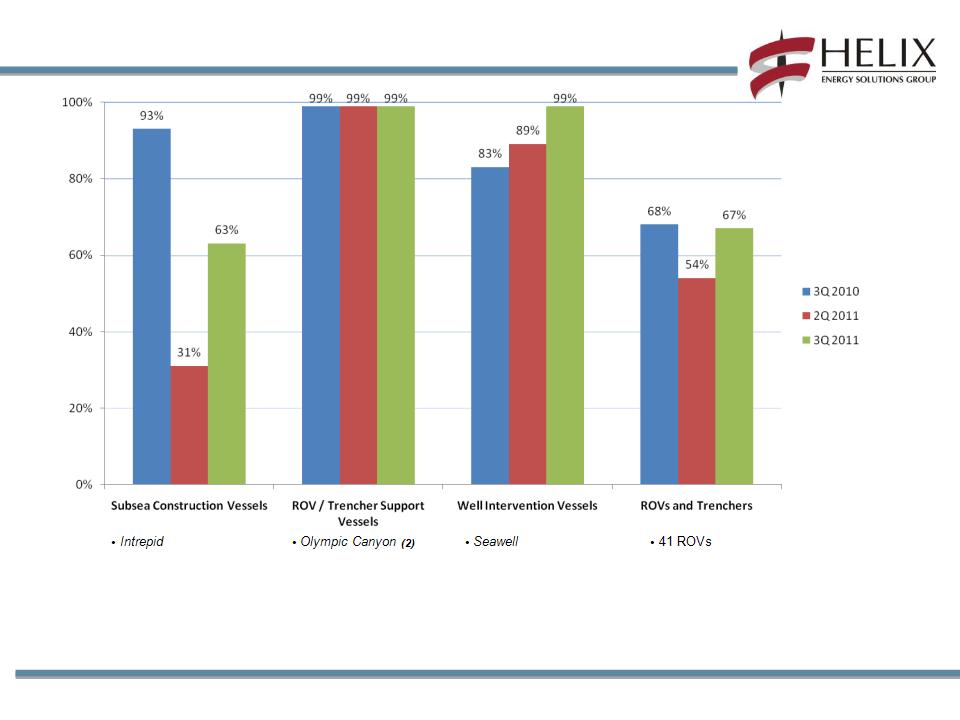
Contracting Services Utilization
• Express
• Caesar (1)
• Island Pioneer (2)
• Deep Cygnus (2)
• Normand Clipper (2)
• Olympic Triton (2)
• Well Enhancer
• Q4000
• 2 ROVDrill Units
• 3 Trenchers
(1) Vessel in shipyard during third quarter undergoing planned maintenance and upgrades. Completed upgrades and sea trials
on October 13. Caesar transited to Mexico to begin accommodations project in Mexico’s Bay of Campeche.
(2) Chartered vessels.

16
(A) Including effect of settled hedges
and mark-to-market derivative
contracts.
and mark-to-market derivative
contracts.
Oil & Gas

17
Oil & Gas
(A) Included accretion expense. Q2 2011 DD&A rate positively affected (approximately $9.2 million) due primarily to increased proved reserves at our Phoenix field
as a result of better than expected production rates (net of adjustments in other fields).
as a result of better than expected production rates (net of adjustments in other fields).
(B) Excluded exploration expense, net hurricane-related costs (reimbursements) and abandonment costs. Included $8.4 and $9.4 million related to a weather
derivative contract (catastrophic bond) for the quarters ended September 30, 2011 and September 30, 2010, respectively.
derivative contract (catastrophic bond) for the quarters ended September 30, 2011 and September 30, 2010, respectively.
Operating Costs ($ in millions, except per Mcfe data)
18
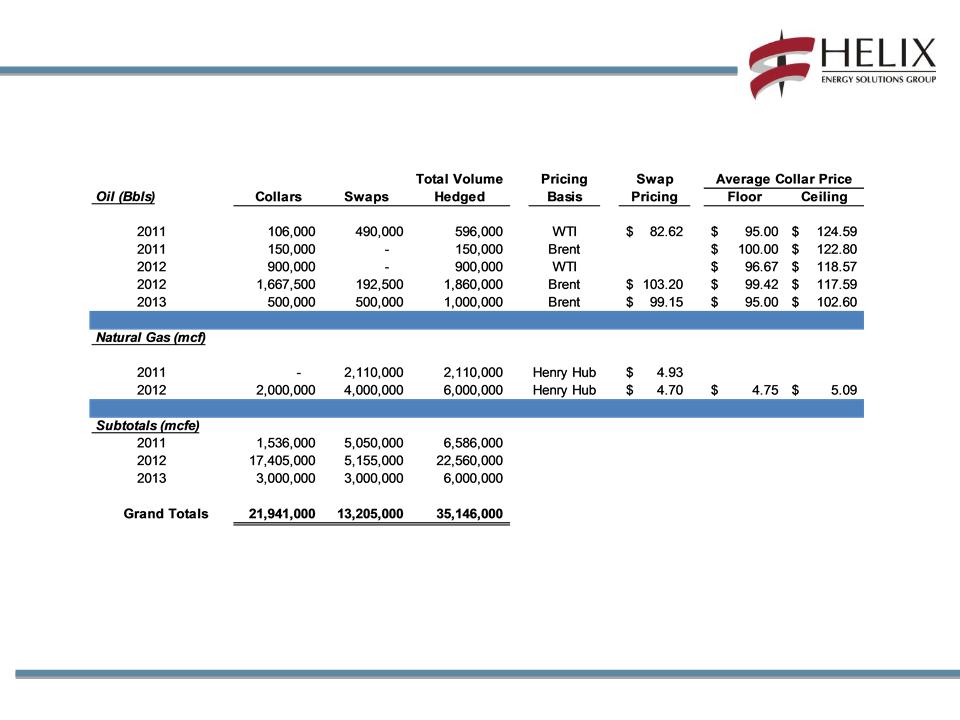
Summary of Oct 2011 - Dec 2013 Hedging Positions *
* As of October 23, 2011.
19
Key Balance
Sheet Metrics
Sheet Metrics
20
Debt and Liquidity Profile
Liquidity of approximately $933 million at 9/30/2011
(A) Includes impact of unamortized debt discount under our Convertible Senior Notes.
(B) Liquidity, as we define it, is equal to cash and cash equivalents ($375 million), plus available
capacity under our revolving credit facility ($558 million).
capacity under our revolving credit facility ($558 million).
21
2011 Outlook
22
2011 Outlook
We expect to continue to improve our liquidity position in 2011.
|
Broad Metrics
|
2011 Forecast
(revised)
|
2011 Forecast
(original)
|
2010 Actual
|
|
Oil and Gas
Production |
50 Bcfe
|
49 Bcfe
|
47 Bcfe
|
|
EBITDAX
|
$625+ million
|
$475 million
|
$430 million
|
|
CAPEX
|
$275 million
|
$225 million
|
$179 million
|
|
Commodity Price
Deck |
2011 Forecast
(revised)
|
2011 Forecast
(original)
|
2010 Actual
|
|
|
Hedged
|
Oil
|
$95.89 / bbl
|
$87.11 / bbl
|
$75.27 / bbl
|
|
Gas
|
$5.82/ mcf
|
$4.80/ mcf
|
$6.01 / mcf
|
|

23
2011 Outlook
• Contracting Services
o Strong backlog for the Q4000, Well Enhancer and Seawell in 2011 and building well into
2012
2012
o Well Enhancer to work in West Africa this winter
o Intrepid deployed to California performing field development projects through early 2012
o Express working through a full backlog for the remainder of 2011 and is scheduled to work
in the North Sea in the second half of 2012
in the North Sea in the second half of 2012
o Caesar deployed to Mexico’s Bay of Campeche in mid-October for accommodations project
o Continued focus on trenching and cable burial business with non-oilfield projects growing
o Five vessels scheduled for regulatory drydocks in 2012; will provide some headwind next
year
year
• Production Facilities
o HP I continues production at Phoenix field
• Oil and Gas
o Forecasted 2011 overall production of 50 Bcfe
§ 67% oil and 64% deepwater
§ Assumes no further significant storm disruptions

24
2011 Outlook
• Capital Expenditures
o Contracting Services ($110 million)
§ Continued incremental investment in robotics business, with a focus on adding
trenching spread capacity
trenching spread capacity
§ Seeking to deploy capital in well intervention business
§ Caesar thruster upgrade completion
o Oil and Gas ($165 million)
§ Focus capital investment on oil development with relatively fast payback
§ Two major planned well projects in the 2nd half of the year
§ Nancy (completion) - commenced in Q3
§ Kathleen (development drill) - expected to commence in Q4/ Q1 2012
§ Shelf platform construction and opportunistic workovers

25
Non-GAAP
Reconciliations
Reconciliations
26
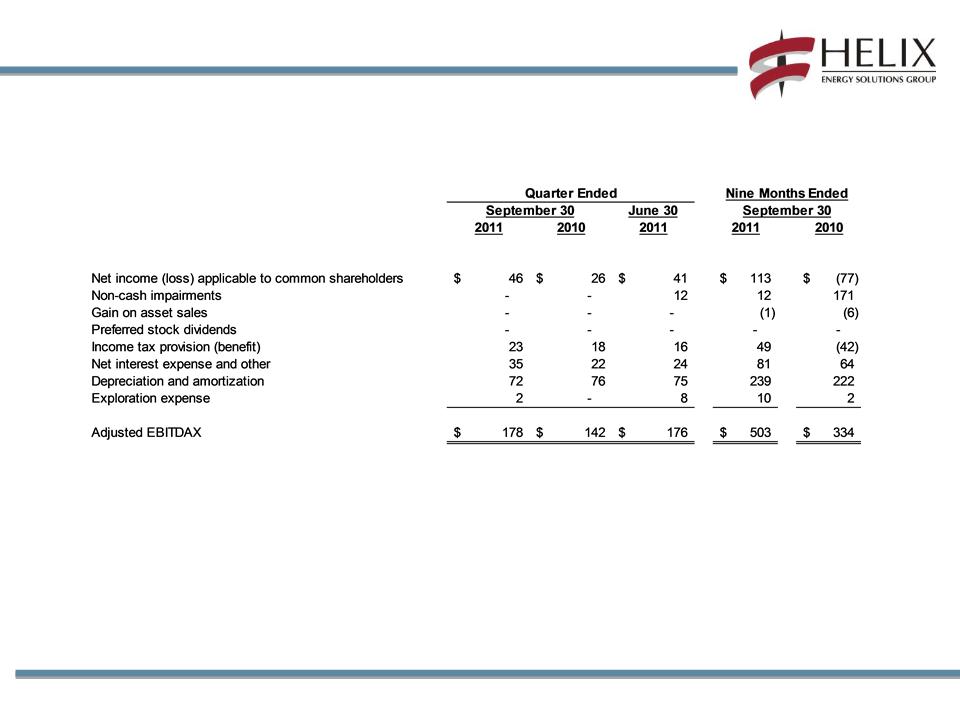
Non-GAAP Reconciliations
Adjusted EBITDAX ($ in millions)
We calculate Adjusted EBITDAX as earnings before net interest expense, taxes, depreciation and amortization and exploration expense. These
non-GAAP measures are useful to investors and other internal and external users of our financial statements in evaluating our operating
performance because they are widely used by investors in our industry to measure a company’s operating performance without regard to items
which can vary substantially from company to company, and help investors meaningfully compare our results from period to period. Adjusted
EBITDAX should not be considered in isolation or as a substitute for, but instead is supplemental to, income from operations, net income or other
income data prepared in accordance with GAAP. Non-GAAP financial measures should be viewed in addition to, and not as an alternative to our
reported results prepared in accordance with GAAP. Users of this financial information should consider the types of events and transactions which
are excluded.
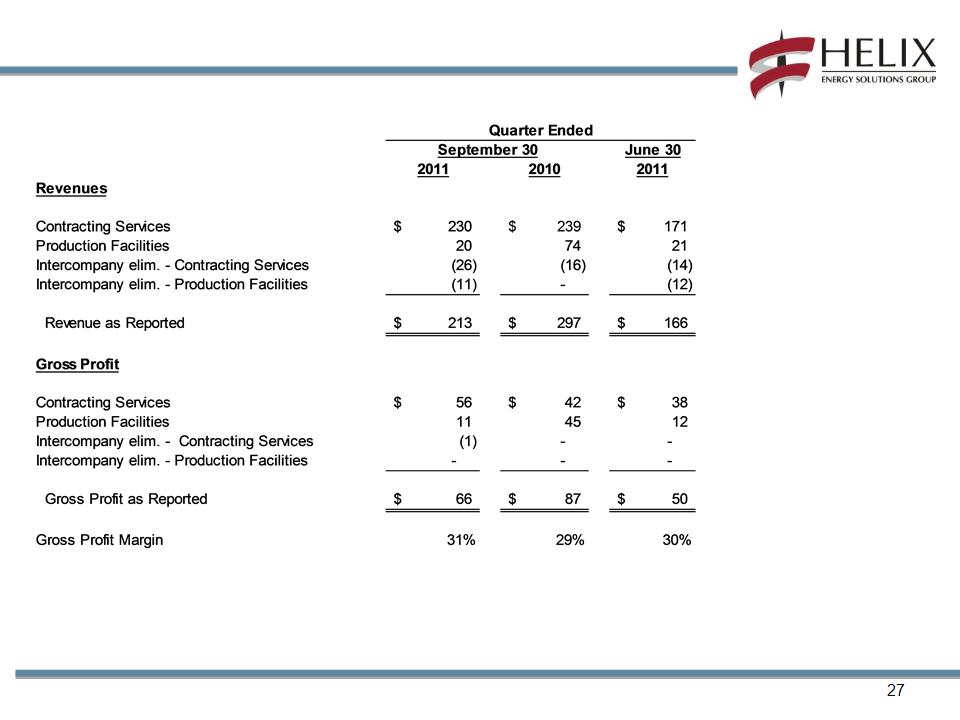
Revenue and Gross Profit As Reported ($ in millions)
Non-GAAP Reconciliations
28