Attached files
| file | filename |
|---|---|
| 8-K - FORM 8-K - FIRSTMERIT CORP /OH/ | d246875d8k.htm |
| EX-99.1 - EX-99.1 - FIRSTMERIT CORP /OH/ | d246875dex991.htm |
Exhibit 99.2
FIRSTMERIT Corporation Third Quarter 2011 Earnings Conference Call Supplemental Information October 25, 2011
Forward-Looking Statements Disclosure This presentation contains forward-looking statements relating to present or future trends or factors affecting the banking industry, and specifically the financial condition and results of operations, including without limitation, statements relating to the earnings outlook of the Corporation, as well as its operations, markets and products. Actual results could differ materially from those indicated. Among the important factors that could cause results to differ materially are interest rate changes, continued softening in the economy, which could materially impact credit quality trends and the ability to generate loans, changes in the mix of the Corporation’s business, competitive pressures, changes in accounting, tax or regulatory practices or requirements and those risk factors detailed in the Corporation’s periodic reports and registration statements filed with the Securities and Exchange Commission. The Corporation undertakes no obligation to release revisions to these forward-looking statements or reflect events or circumstances after the date of this release. 2
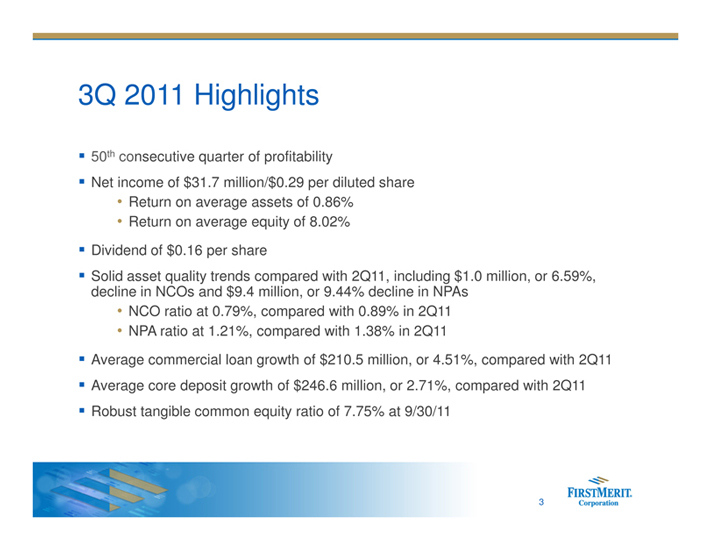
3Q 2011 Highlights 50th consecutive quarter of profitability Net income of $31.7 million/$0.29 per diluted share Return on average assets of 0.86% Return on average equity of 8.02% Dividend of $0.16 per share Solid asset quality trends compared with 2Q11, including $1.0 million, or 6.59%, decline in NCOs and $9.4 million, or 9.44% decline in NPAs NCO ratio at 0.79%, compared with 0.89% in 2Q11 NPA ratio at 1.21%, compared with 1.38% in 2Q11 Average commercial loan growth of $210.5 million, or 4.51%, compared with 2Q11 Average core deposit growth of $246.6 million, or 2.71%, compared with 2Q11 Robust tangible common equity ratio of 7.75% at 9/30/11 3
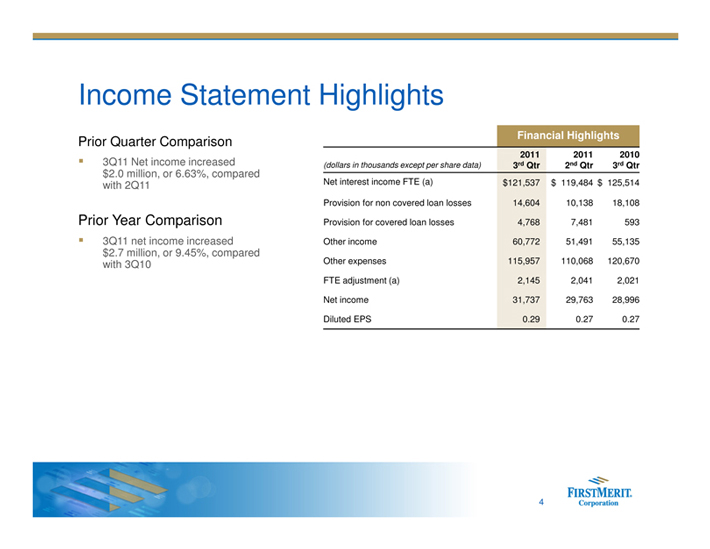
Income Statement Highlights Financial Highlights Prior Quarter Comparison 3Q11 Net income 2011 2011 2010 3 increased (dollars in thousands except per share data) 3rd Qtr 2nd Qtr 3rd Qtr $2.0 million, or 6.63%, compared with 2Q11 Net interest income FTE (a) $121,537 $ 119,484 $ 125,514 Provision for non covered loan losses 14,604 10,138 18,108 Prior Year Comparison Provision for covered loan losses 4,768 7,481 593 3 3Q11 net income increased Other income 60,772 51,491 55,135 $2.7 million, or 9.45%, compared with 3Q10 Other expenses 115,957 110,068 120,670 FTE adjustment (a) 2,145 2,041 2,021 Net income 31,737 29,763 28,996 Diluted EPS 0.29 0.27 0.27 4
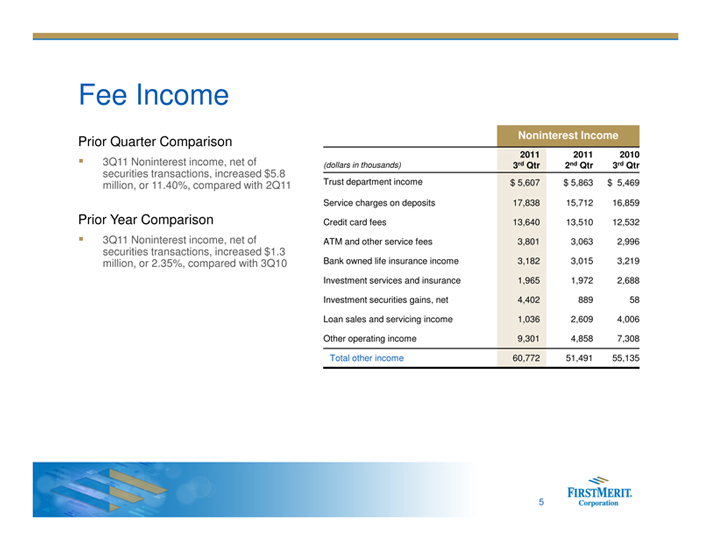
Fee Income Noninterest Income Prior Quarter Comparison 3Q11 Noninterest income, of 2011 2011 2010 3 net (dollars in thousands) 3rd Qtr 2nd Qtr 3rd Qtr securities transactions, increased $5.8 million, or 11.40%, compared with 2Q11 Trust department income $ 5,607 $ 5,863 $ 5,469 Service charges on deposits 17,838 15,712 16,859 Prior Year Comparison Credit card fees 13,640 13,510 12,532 3 3Q11 Noninterest income, net of ATM and other service fees 3,801 3,063 2,996 securities transactions, increased $1.3 million, or 2.35%, compared with 3Q10 Bank owned life insurance income 3,182 3,015 3,219 Investment services and insurance 1,965 1,972 2,688 Investment securities gains, net 4,402 889 58 Loan sales and servicing income 1,036 2,609 4,006 Other operating income 9,301 4,858 7,308 Total other income 60,772 51,491 55,135 5
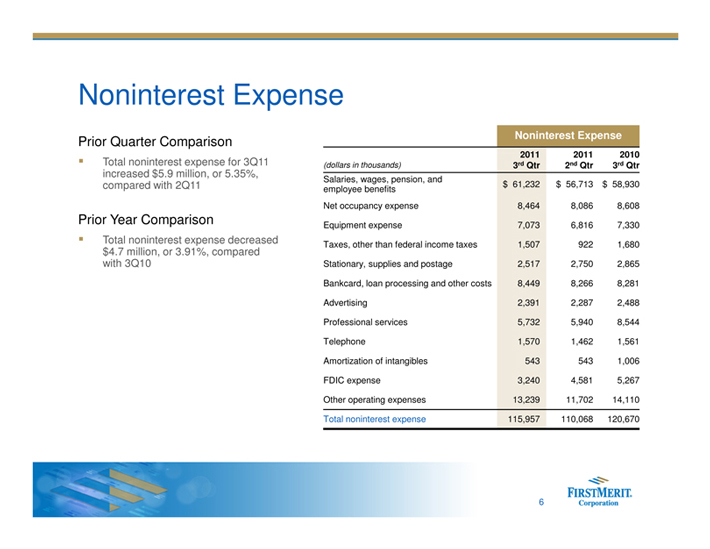
Noninterest Expense Noninterest Expense Prior Quarter Comparison Total noninterest expense for 3Q11 2011 2011 2010 3 (dollars in thousands) 3rd Qtr 2nd Qtr 3rd Qtr increased $5.9 million, or 5.35%, Salaries, wages, pension, and compared with 2Q11 $ 61,232 $ 56,713 $ 58,930 employee benefits Net occupancy expense 8,464 8,086 8,608 Prior Year Comparison Equipment expense 7,073 6,816 7,330 3 Total noninterest expense decreased Taxes, other than federal income taxes 1,507 922 1,680 $4.7 million, or 3.91%, compared with 3Q10 Stationary, supplies and postage 2,517 2,750 2,865 Bankcard, loan processing and other costs 8,449 8,266 8,281 Advertising 2,391 2,287 2,488 Professional services 5,732 5,940 8,544 Telephone 1,570 1,462 1,561 Amortization of intangibles 543 543 1,006 FDIC expense 3,240 4,581 5,267 Other operating expenses 13,239 11,702 14,110 Total noninterest expense 115,957 110,068 120,670 6
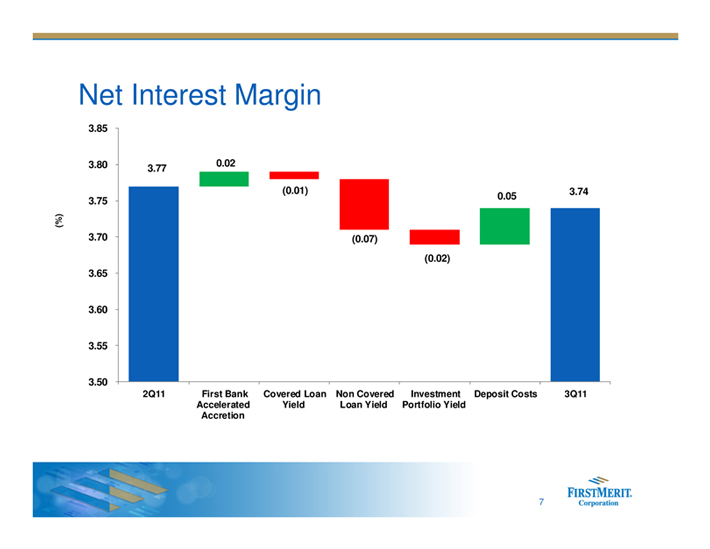
Net Interest Margin 3.85 3.80 0.02 3.77 (0.01) 3.74 0.05 3.75 (%) 3.70 (0.07) (0.02) 3.65 3.60 3.55 3.50 2Q11 First Bank Covered Loan Non Covered Investment Deposit Costs 3Q11 Accelerated Yield Loan Yield Portfolio Yield Accretion 7
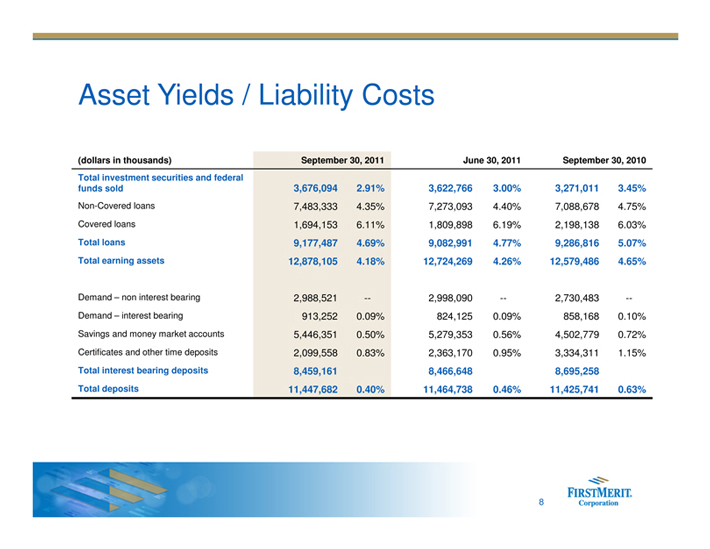
Asset Yields / Liability Costs (dollars in thousands) September 30, 2011 June 30, 2011 September 30, 2010 Total investment securities and federal funds sold 3,676,094 2.91% 3,622,766 3.00% 3,271,011 3.45% Non-Covered loans 7,483,333 4.35% 7,273,093 4.40% 7,088,678 4.75% Covered loans 1,694,153 6.11% 1,809,898 6.19% 2,198,138 6.03% Total loans 9,177,487 4.69% 9,082,991 4.77% 9,286,816 5.07% Total earning assets 12,878,105 4.18% 12,724,269 4.26% 12,579,486 4.65% Demand non interest bearing 2,988,521 — 2,998,090 — 2,730,483 —Demand interest bearing 913,252 0.09% 824,125 0.09% 858,168 0.10% Savings and money market accounts 5,446,351 0.50% 5,279,353 0.56% 4,502,779 0.72% Certificates and other time deposits 2,099,558 0.83% 2,363,170 0.95% 3,334,311 1.15% Total interest bearing deposits 8,459,161 8,466,648 8,695,258 Total deposits 11,447,682 0.40% 11,464,738 0.46% 11,425,741 0.63% 8
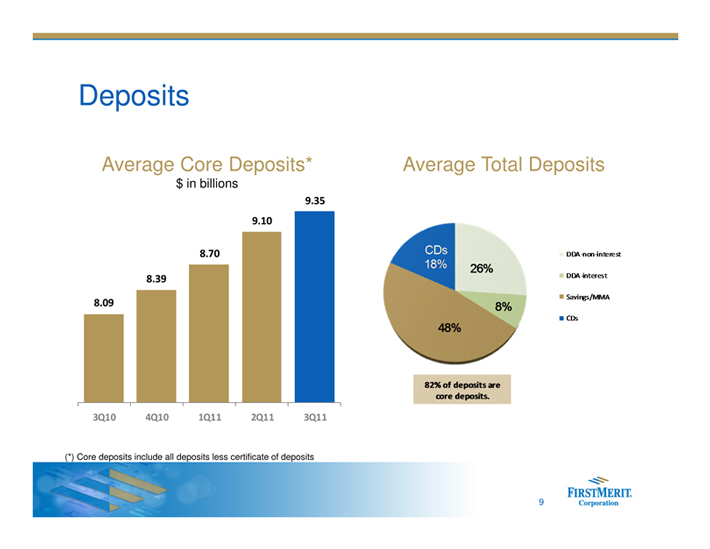
Deposits Average Core Deposits* Average Total Deposits $ in billions 8.09 8.39 8.70 9.10 9.35 3Q10 4Q10 1Q11 2Q11 3Q11 CDs 18% 26% DDA non-interest DDA interest Savings/MMA CDs 82% of deposits are core deposits (*) Core deposits include all deposits less certificate of deposits 9
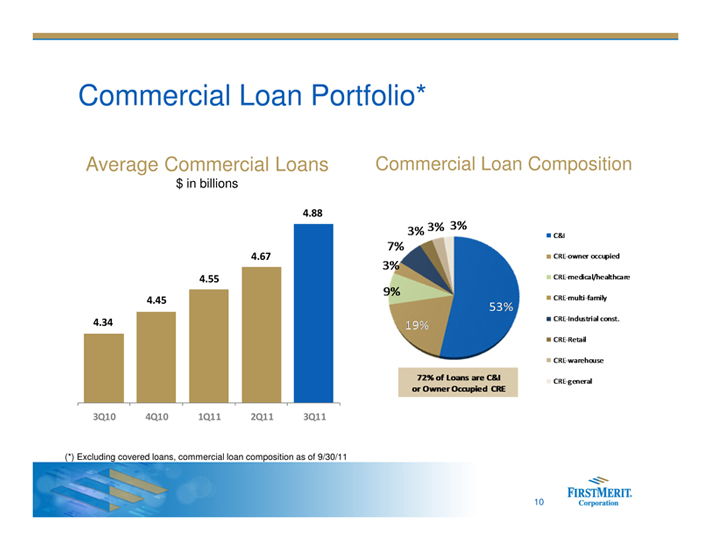
Commercial Loan Portfolio* Average Commercial Loans Commercial Loan Composition $ in billions 4.34 4.45 4.55 4.67 4.88 3Q10 4Q10 1Q11 2Q11 3Q11 9% 3% 7% 3% 3% 3% 53% 19% (*) Excluding covered loans, commercial loan composition as of 9/30/11 10
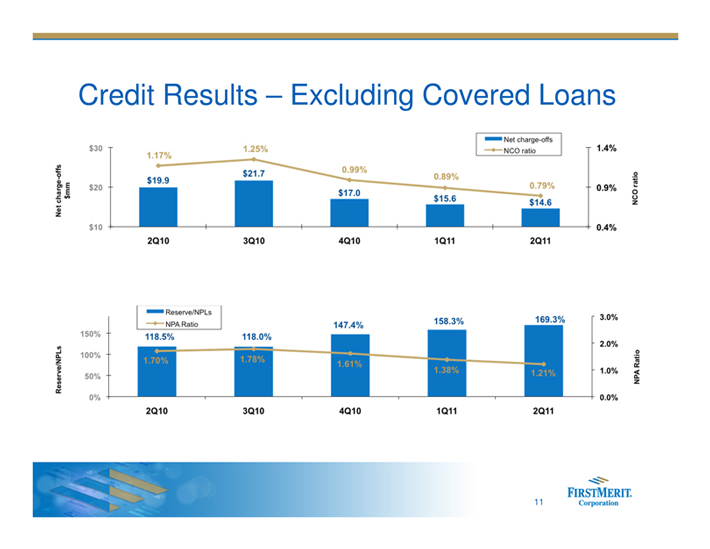
Credit Results Excluding Covered LoanS $10 $20 $30 Net Change-offs Net change-offs $mm NCO ratio 1.4% 0.9% 0.4% 2Q10 3Q10 4q10 1Q11 2Q11 1.17% 1.25% 0.99% 0.89% 0.79% $19.9 $21.7 $17.0 $15.6 $14.6 NCO Ratio Reserve/NPLs Reserve/NPLs NPA ratio NPa ratio 150% 100% 50% 0% 118.5% 118.0% 147.4% 158.3% 169.3% 1.70% 1.78% 1.61% 1.38% 1.21% 3.0% 2.0% 1.0% 0.0% 2Q10 3Q10 4Q10 1Q11 2Q11 11
Other Credit Highlights Excluding Covered Loans Decline in consumer net charge-offs for six consecutive quarters Flat consumer portfolio delinquency rate Down 55bps from year ago Up 6bps from prior quarter (historical seasonality) Criticized & Classified loans are flat from prior quarter OREO decreased $5mm from prior quarter 12
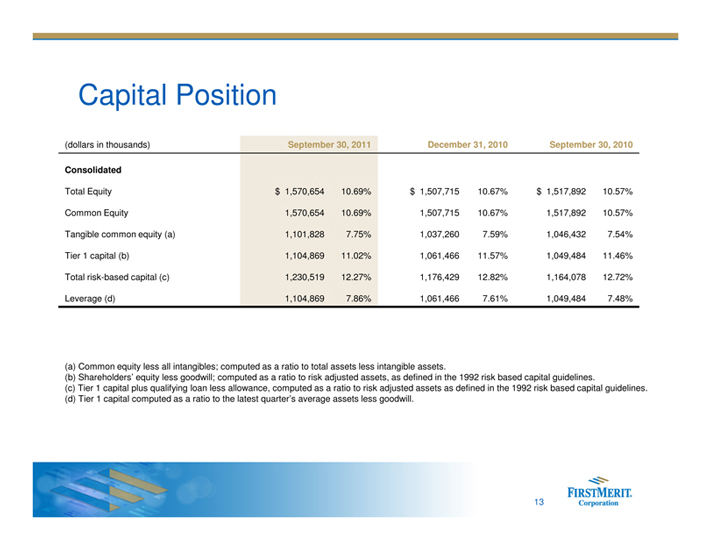
Capital Position (dollars in thousands) September 30, 2011 December 31, 2010 September 30, 2010 Consolidated Total Equity $ 1,570,654 10.69% $ 1,507,715 10.67% $ 1,517,892 10.57% Common Equity 1,570,654 10.69% 1,507,715 10.67% 1,517,892 10.57% Tangible common equity (a) 1,101,828 7.75% 1,037,260 7.59% 1,046,432 7.54% Tier 1 capital (b) 1,104,869 11.02% 1,061,466 11.57% 1,049,484 11.46% Total risk-based capital (c) 1,230,519 12.27% 1,176,429 12.82% 1,164,078 12.72% Leverage (d) 1,104,869 7.86% 1,061,466 7.61% 1,049,484 7.48% (a) Common equity less all intangibles; computed as a ratio to total assets less intangible assets. (b) Shareholders equity less goodwill; computed as a ratio to risk adjusted assets, as defined in the 1992 risk based capital guidelines. (c) Tier 1 capital plus qualifying loan less allowance, computed as a ratio to risk adjusted assets as defined in the 1992 risk based capital guidelines. (d) Tier 1 capital computed as a ratio to the latest quarter s average assets less goodwill. 13

FIRSTMERIT Corporation Third Quarter 2011 Earnings Conference Call Supplemental Information October 25, 2011