Attached files
| file | filename |
|---|---|
| 8-K - FORM 8-K - ManpowerGroup Inc. | form_8-k.htm |
| EX-99.1 - PRESS RELEASE DATED OCTOBER 21, 2011 - ManpowerGroup Inc. | exhibit_99-1.htm |
Exhibit 99.2

ManpowerGroup 2011 3rd Quarter Results October 2011
ManpowerGroup
3rd Quarter
October 21, 2011

ManpowerGroup 2011 3rd Quarter Results October 2011
Forward-Looking Statement
This presentation includes forward-looking statements,
including earnings projections which are subject to risks and
uncertainties. Actual results might differ materially from those
projected in the forward-looking statements. Additional
information concerning factors that could cause actual results
to materially differ from those in the forward-looking statements
is contained in the Manpower Inc. Annual Report on Form 10-K
dated December 31, 2010, which information is incorporated
herein by reference, and such other factors as may be
described from time to time in the Company’s SEC filings.

ManpowerGroup 2011 3rd Quarter Results October 2011
|
|
Q3 Financial Highlights
|
|
16%
|
Revenue $5.8B
|
|
9% CC
|
|
|
40 bps
|
Gross Margin 16.5%
|
|
45%
|
Operating Profit $158M
|
|
34% CC
|
|
|
50 bps
|
OP Margin 2.7%
|
|
57%
|
EPS $.97
|
|
44% CC
|
Throughout this presentation, the difference between reported variances and Constant Currency (CC) variances
represents the impact of currency on our financial results. Constant Currency is further explained on our Web site.
represents the impact of currency on our financial results. Constant Currency is further explained on our Web site.
Consolidated Financial Highlights
3
ManpowerGroup 2011 3rd Quarter Results October 2011
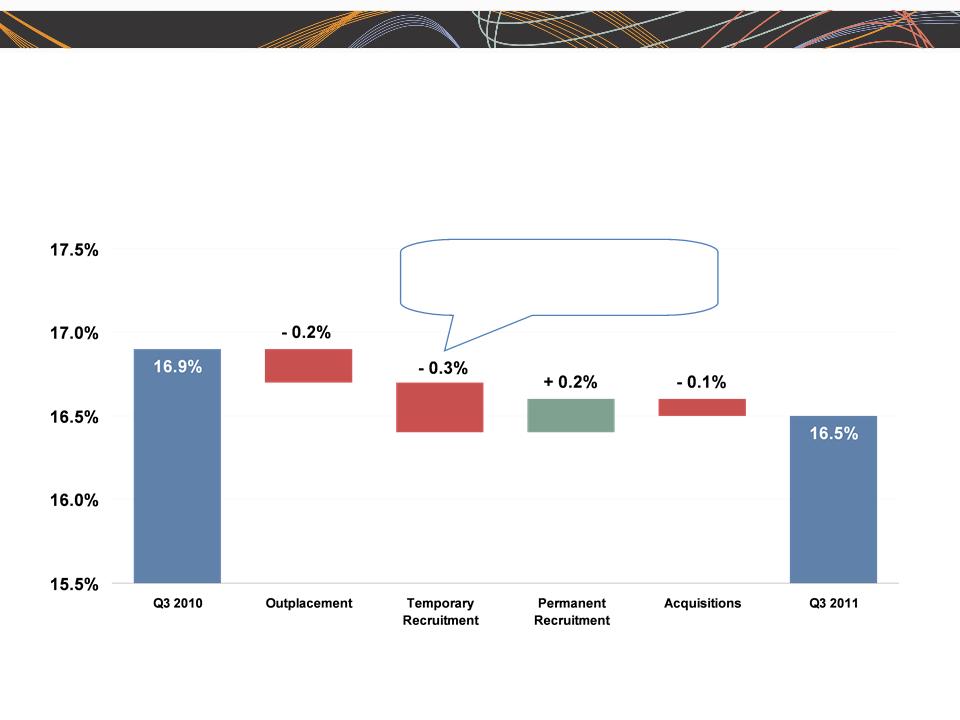
Consolidated Gross Margin Change
4
U.S.: 2010 Hire Act credits -0.1%
France : lower payroll tax subsidies -0.1%

ManpowerGroup 2011 3rd Quarter Results October 2011
|
|
Q3 Financial Highlights
|
|
9%
|
Revenue $1.2B
|
|
8% CC
|
|
|
25%
|
OUP $43M
|
|
25% CC
|
|
|
40 bps
|
OUP Margin 3.5%
|
Americas Segment
(21% of Revenue)
(1) Included in these amounts is the US, which had revenue of $829M (+4%) and OUP of $32M (+24%).
Operating Unit Profit (OUP) is the measure that we use to evaluate segment performance.
OUP is equal to segment revenues less direct costs and branch and national
headquarters operating costs.
OUP is equal to segment revenues less direct costs and branch and national
headquarters operating costs.
(1)
5
ManpowerGroup 2011 3rd Quarter Results October 2011
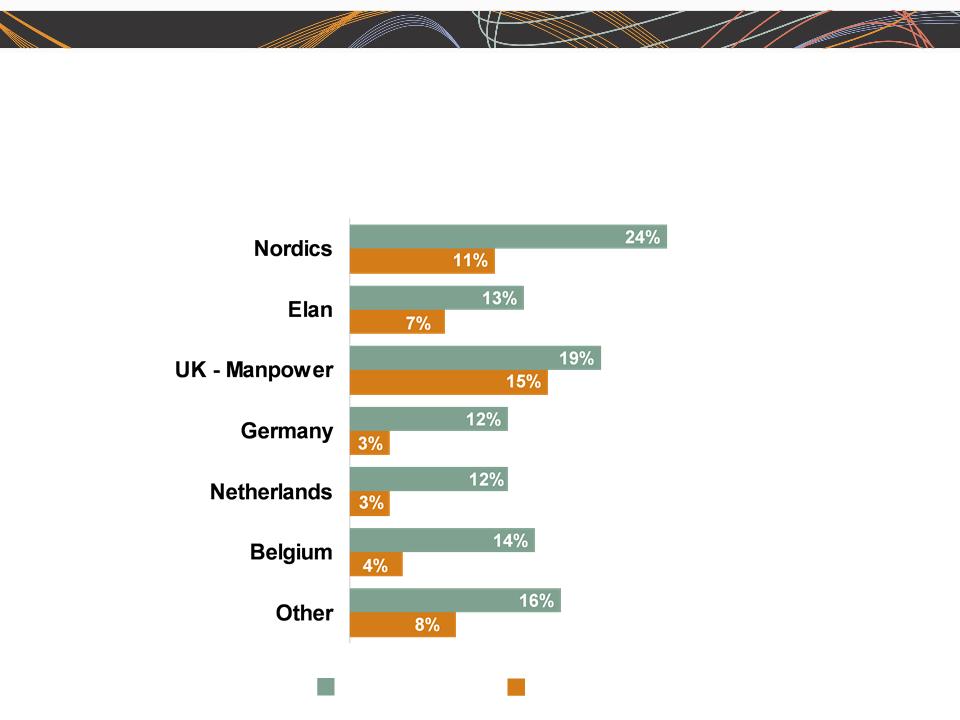
Americas - Q3 Revenue Growth YoY
Revenue Growth - CC
Revenue Growth
% of Segment
Revenue
69%
12%
6%
13%
6

ManpowerGroup 2011 3rd Quarter Results October 2011
7
|
|
Q3 Financial Highlights
|
|
19%
|
Revenue $2.2B
|
|
9% CC
|
|
|
27%
|
OUP $50M
|
|
17% CC
|
|
|
20 bps
|
OUP Margin 2.3%
|
Southern Europe Segment
(38% of Revenue)
(1)
(1) Included in these amounts is France, which had revenue of $1.7B (+8% CC) and OUP of $28M (+2% CC).
ManpowerGroup 2011 3rd Quarter Results October 2011
Southern Europe - Q3 Revenue Growth YoY
Revenue Growth - CC
Revenue Growth
% of Segment
Revenue
76%
15%
5%
4%
8
ManpowerGroup 2011 3rd Quarter Results October 2011
|
|
Q3 Financial Highlights
|
|
17%
|
Revenue $1.6B
|
|
9% CC
|
|
|
58%
|
OUP $63M
|
|
47% CC
|
|
|
100 bps
|
OUP Margin 3.9%
|
Northern Europe Segment
(28% of Revenue)
9
ManpowerGroup 2011 3rd Quarter Results October 2011
Northern Europe - Q3 Revenue Growth YoY
Revenue Growth - CC
Revenue Growth
% of Segment
Revenue
19%
17%
15%
13%
10%
19%
7%
10

ManpowerGroup 2011 3rd Quarter Results October 2011
|
|
Q3 Financial Highlights
|
|
26%
|
Revenue $701M
|
|
15% CC
|
|
|
64%
|
OUP $22M
|
|
51% CC
|
|
|
70 bps
|
OUP Margin 3.1%
|
APME Segment
(12% of Revenue)
11
ManpowerGroup 2011 3rd Quarter Results October 2011
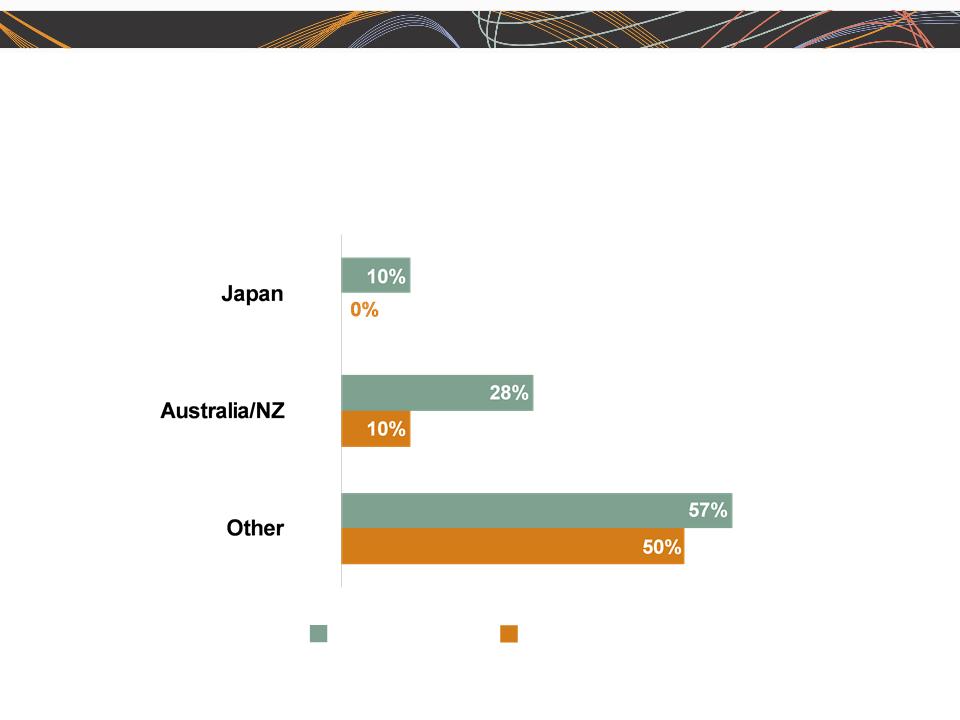
APME - Q3 Revenue Growth YoY
Revenue Growth - CC
Revenue Growth
% of Segment
Revenue
43%
28%
29%
12
(1) On an organic basis, Other revenue growth was 19% (+13% CC).
(1)

ManpowerGroup 2011 3rd Quarter Results October 2011
|
|
Q3 Financial Highlights
|
|
9%
|
Revenue $77M
|
|
14% CC
|
|
|
N/A
|
OUP $(2)M
|
|
240 bps
|
OUP Margin (2.4)%
|
Right Management Segment
(1% of Revenue)
13

ManpowerGroup 2011 3rd Quarter Results October 2011
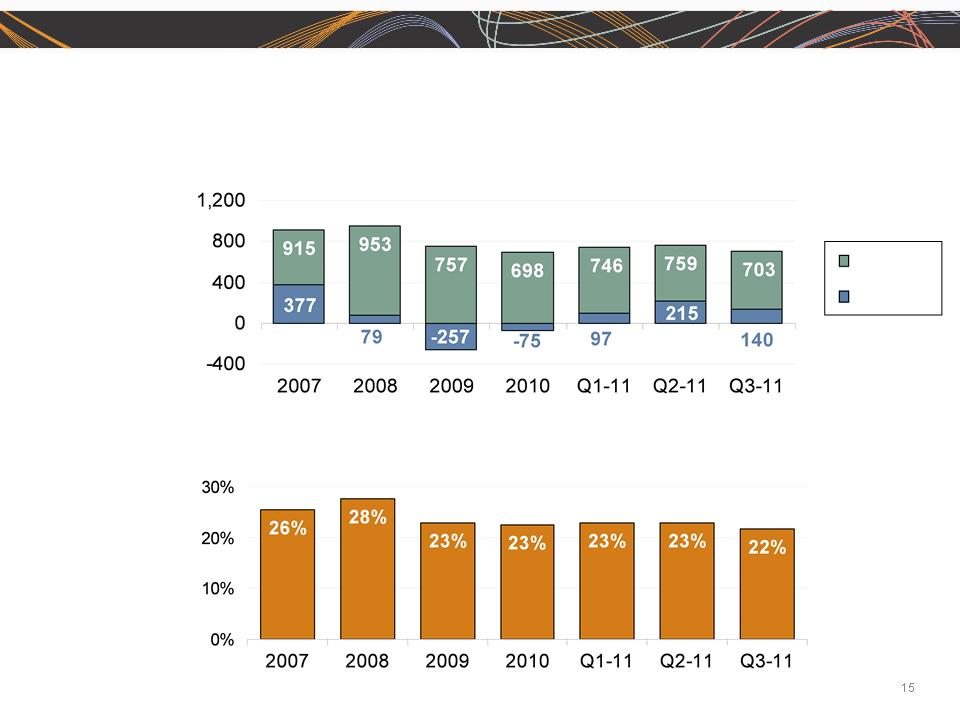
Cash Flow Summary - Nine Months
|
($ in millions)
|
2011
|
|
2010
|
|
Cash from Operations
|
(73)
|
|
(56)
|
|
Capital Expenditures
|
(46)
|
|
(42)
|
|
Free Cash Flow
|
(119)
|
|
(98)
|
|
Change in Debt
|
6
|
|
(19)
|
|
Share Repurchases
|
(43)
|
|
(35)
|
|
Acquisitions of Business
net of cash acquired
|
(32)
|
|
(261)
|
|
Effect of Exchange Rate Changes
|
(12)
|
|
8
|
|
Other
|
(9)
|
|
(11)
|
|
Change in Cash
|
(209)
|
|
(416)
|
|
|
|
|
|
|
|
|
|
|
14
ManpowerGroup 2011 3rd Quarter Results October 2011
Balance Sheet Highlights
Total Debt
($ in millions)
Total Debt to
Total Capitalization
Total Debt
Net Debt

ManpowerGroup 2011 3rd Quarter Results October 2011
Credit Facilities
($ in millions)
($ in millions)
|
|
Interest
Rate
|
Maturity
Date
|
Total
Outstanding
at 9/30/11 |
|
Remaining
Available
at 9/30/11
|
|
Remaining
Available
Adjusted
for New Agreement |
|
Euro Notes:
|
|
|
|
|
|
|
|
|
- Euro 200M
|
4.86%
|
Jun 2013
|
267
|
|
-
|
|
-
|
|
- Euro 300M
|
4.58%
|
Jun 2012
|
401
|
|
-
|
|
-
|
|
Revolving Credit Agreement
|
2.79%
|
Nov 2012
|
-
|
|
398
|
|
n/a
|
|
Revolving Credit Agreement -
New |
1.51%
|
Oct 2016
|
n/a
|
|
n/a
|
|
800
|
|
Uncommitted lines and Other
|
Various
|
Various
|
35
|
|
354
|
|
354
|
|
Total Debt
|
|
|
703
|
|
752
|
1,154
|
(3)
(1)
This $400M agreement required, as of September 30, that we comply with a Debt-to-EBITDA ratio of less than 3.25 to 1 and a fixed charge coverage
ratio of greater than 1.50 to 1. As defined in the agreement, we had a Debt-to-EBITDA ratio of 1.17 and a fixed charge coverage ratio of 2.96 as of
September 30, 2011. As of September 30, there were $2.2M of standby letters of credit issued under the agreement. This agreement was terminated on
October 5, 2011 in connection with our entry into our new $800M agreement.
Represents subsidiary uncommitted lines of credit & overdraft facilities, which total $386.9M. Total subsidiary borrowing are limited to $300M due to
restrictions in our Revolving Credit Facility, with the exception of Q3 when subsidiary borrowings are limited to $600M.
restrictions in our Revolving Credit Facility, with the exception of Q3 when subsidiary borrowings are limited to $600M.
(1)
(2)
(3)
(2)
We completed a new $800M five year revolving credit agreement on October 5, 2011 with a syndicate of commercial banks .This new agreement
replaces the previous $400M agreement. This agreement, which expires in October 2016, allows for borrowings in various currencies and up to $150M
may be used for the issuance of stand-by letters of credit. Under this agreement, a debt ratings-based pricing grid determines the credit spread that we
add to the applicable interbank borrowing rate on all borrowings as well as the facility and issuance fees. At our current credit ratings, our facility fee is
0.225% and our credit spread for borrowings is 1.275%. This agreement requires that we comply with a Leverage Ratio (Debt-to-EBITDA) of not greater
than 3.5 to 1 and a Fixed Charge Coverage Ratio of not less than 1.5 to 1, in addition to other customary restrictive covenants.
16

ManpowerGroup 2011 3rd Quarter Results October 2011
Fourth Quarter Outlook
|
Revenue
|
Total
|
Up 7-9% (Up 5-7% CC)
|
|
|
Americas
|
Up 3-5% (Up 4-6% CC)
|
|
|
Southern Europe
|
Up 7-9% (Up 5-7% CC)
|
|
|
Northern Europe
|
Up 7-9% (Up 5-7% CC)
|
|
|
APME
|
Up 16-18% (Up 10-12% CC)
|
|
Right Management
|
Down 7-9% (Down 8-10% CC)
|
|
|
Gross Profit Margin
|
16.9 - 17.1%
|
|
|
Operating Profit Margin
|
2.5 - 2.7%
|
|
|
Tax Rate
|
46%
|
|
|
EPS
|
$0.85 - $0.95 (Favorable $.03 Currency)
|
|
17
(a)
(a) Excludes anticipated reorganization charges of $16M-$22M ($0.15-$0.20 per diluted share).
(a)
ManpowerGroup 2011 3rd Quarter Results October 2011
18
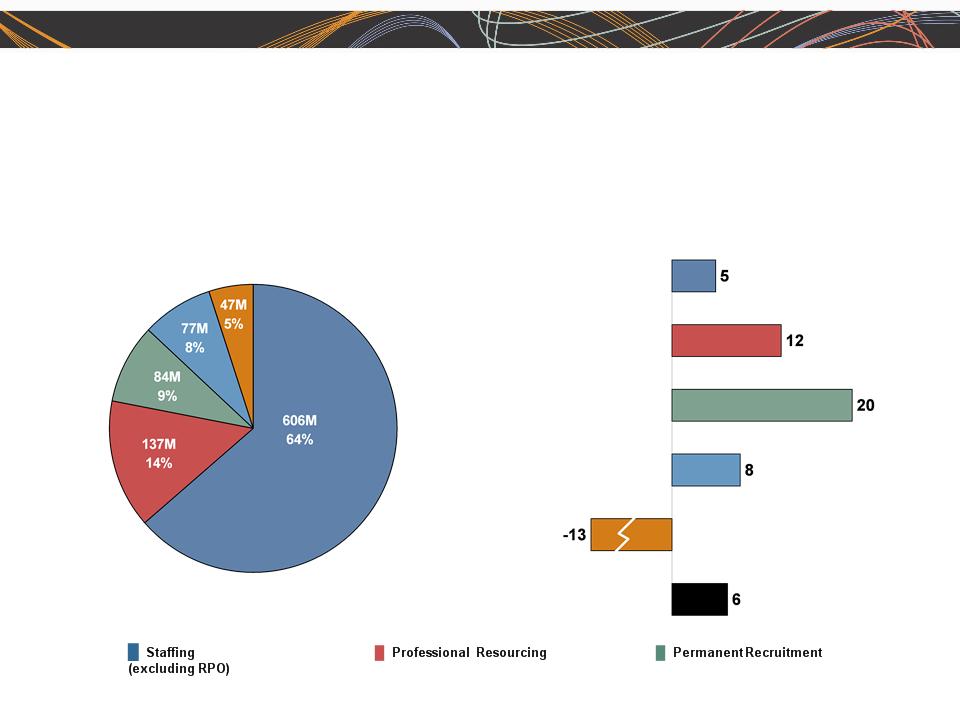
Business Line Gross Profit
$951M
Gross Profit Growth
in CC %
Gross Profit Development - Q3 2011
█ ManpowerGroup Solutions █ Talent & Career Management █ ManpowerGroup - Total

Questions