Attached files
| file | filename |
|---|---|
| 8-K - FORM 8-K - FIRST NIAGARA FINANCIAL GROUP INC | c23486e8vk.htm |
Exhibit 99.1

| Third Quarter 2011 Earnings Highlights October 20, 2011 John R. KoelmelPresident & Chief Executive OfficerGregory W. NorwoodChief Financial Officer |

| Safe Harbor Statement This presentation contains forward-looking information for First Niagara Financial Group, Inc. Such information constitutes forward-looking statements (within the meaning of the Private Securities Litigation Reform Act of 1995) which involve significant risks and uncertainties. Actual results may differ materially from the results discussed in these forward-looking statements. |

| Key Themes Positive business fundamentalsStrong organic loan and deposit growth continuesNew business lines provide new revenues; e.g. Capital Markets and LeasingOperating EPS = $0.25 (ex $0.06 per share of one-time expenses & restructuring costs)GAAP EPS = $0.19, including one-time expenses and restructuring costsStrong credit quality continues; key ratios remain low43% of the loan book was marked to fair value at acquisition through purchase accountingNet interest income essentially flat; NIM declined 17 basis pointsBusiness drivers account for 8 basis points declineCommercial yield compression impact of 2 basis points"Day count" impact 4 basis pointsGrowth in investments continues; albeit at a pace in line with economic outlook |

| 3Q11 Summary: Normalized QOQ Comparison |

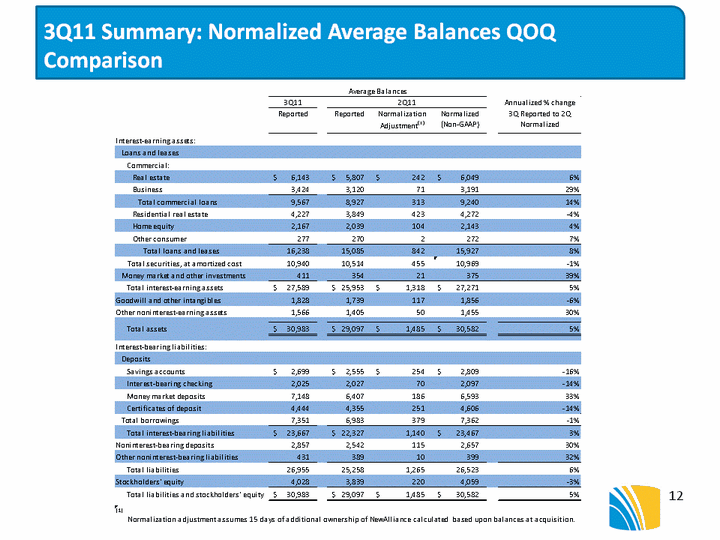
| Normalized Average Balance Sheet |

| Organic loan growth across our footprint Eastern PA Upstate NY Western PA Capital Markets - Multi Region Total Loan Balances$ millions (CHART) +7% YOY 4% of Bank's 12% YOYOrganic Growth +46% YOY (CHART) (CHART) +4% YOY 1% of Bank's 12% YOYOrganic Growth (CHART) +$220M YOY 2% of Bank's 12% YOYOrganic Growth 5% of Bank's 12% YOYOrganic Growth |

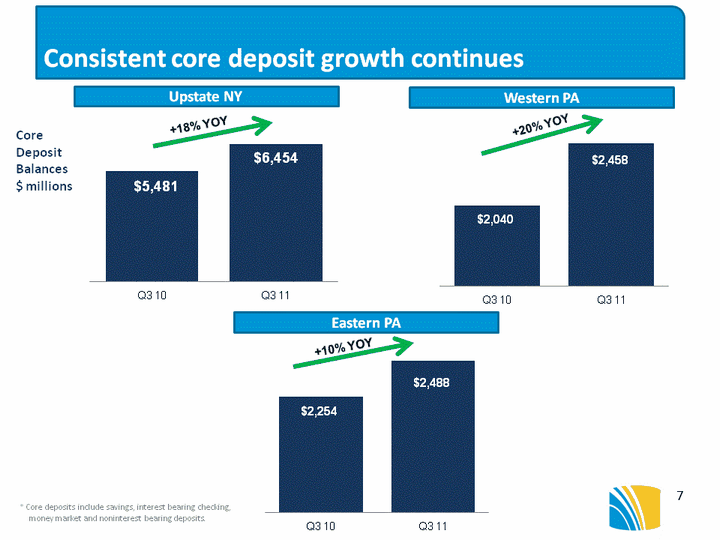
| Consistent core deposit growth continues * Core deposits include savings, interest bearing checking, money market and noninterest bearing deposits. Eastern PA Upstate NY Western PA Core Deposit Balances$ millions +10% YOY +18% YOY +20% YOY (CHART) (CHART) (CHART) |

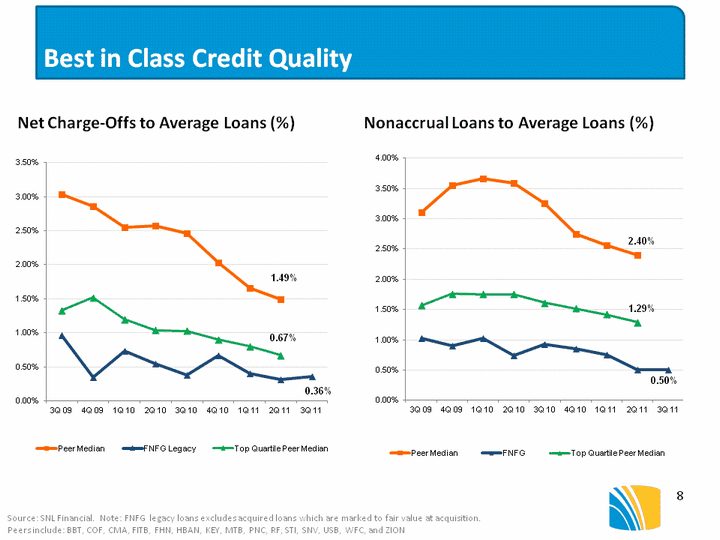
| Best in Class Credit Quality Net Charge-Offs to Average Loans (%) Nonaccrual Loans to Average Loans (%) Source: SNL Financial. Note: FNFG legacy loans excludes acquired loans which are marked to fair value at acquisition.Peers include: BBT, COF, CMA, FITB, FHN, HBAN, KEY, MTB, PNC, RF, STI, SNV, USB, WFC, and ZION (CHART) (CHART) |

| NIM Reconciliation : 3Q11 vs. 2Q11 |

| Appendix Non-GAAP Measures - This presentation contains financial information determined by methods other than in accordance with accounting principles generally accepted in the United States of America (GAAP). The Company believes that these non-GAAP financial measures provide a meaningful comparison of the underlying operational performance of the Company, and facilitate investors' assessments of business and performance trends in comparison to others in the financial services industry. In addition, the Company believes the exclusion of these non-operating items enables management to perform a more effective evaluation and comparison of the Company's results and to assess performance in relation to the Company's ongoing operations. These disclosures should not be viewed as a substitute for financial measures determined in accordance with GAAP, nor are they necessarily comparable to non-GAAP performance measures that may be presented by other companies. Where non-GAAP disclosures are used in this presentation, the comparable GAAP financial measure, as well as the reconciliation to the comparable GAAP financial member, can be found in this Appendix. |

| 3Q11 Summary: Normalized QOQ Comparison |

| 3Q11 Summary: Normalized Average Balances QOQ Comparison |
