Attached files
| file | filename |
|---|---|
| 8-K - FORM 8-K - CAPITAL ONE FINANCIAL CORP | d245193d8k.htm |
| EX-99.1 - EXHIBIT 99.1 - CAPITAL ONE FINANCIAL CORP | d245193dex991.htm |
| EX-99.2 - EXHIBIT 99.2 - CAPITAL ONE FINANCIAL CORP | d245193dex992.htm |
 Third Quarter 2011
Results October 20, 2011
Exhibit 99.3 |
| 2
October 20, 2011
Forward-Looking Statements
Please note that the following materials containing information regarding
Capital One’s financial performance speak only as of the particular date or dates indicated in these
materials. Capital One does not undertake any obligation to update or
revise any of the information contained herein whether as a result of new information, future events or
otherwise.
Certain statements in this presentation and other oral and written
statements made by Capital One from time to time are forward-looking statements, including those that
discuss, among other things, strategies, goals, outlook or other
non-historical matters; projections, revenues, income, returns, accruals for claims in litigation and for other
claims against Capital One, earnings per share or other financial
measures for Capital One; future financial and operating results; Capital One’s plans, objectives,
expectations and intentions; the projected impact and benefits of the
pending transactions involving Capital One, HSBC and ING Direct (the “transactions”); and the
assumptions that underlie these matters. To the extent that any
such information is forward-looking, it is intended to fit within the safe harbor for forward-looking
information provided by the Private Securities Litigation Reform Act of
1995. Numerous factors could cause Capital One’s actual results to differ materially from those
described in such forward-looking statements, including, among other
things: general economic and business conditions in the U.S., the U.K., Canada, or Capital One’s local
markets, including conditions affecting employment levels, interest
rates, consumer income and confidence, spending and savings that may affect consumer bankruptcies,
defaults, charge-offs and deposit activity; an increase or decrease
in credit losses (including increases due to a worsening of general economic conditions in the credit
environment); the possibility that regulatory and other approvals and
conditions to either of the transactions are not received or satisfied on a timely basis or at all; the
possibility that modifications to the terms of either of the transactions
may be required in order to obtain or satisfy such approvals or conditions; the possibility that Capital
One will not receive third-party consents necessary to fully realize
the anticipated benefits of the transactions; the possibility that Capital One may not fully realize the
projected cost savings and other projected benefits of the transactions;
changes in the anticipated timing for closing either of the transactions; difficulties and delays in
integrating the assets and businesses acquired in the transactions;
business disruption during the pendency of or following the transactions; the inability to sustain revenue
and earnings growth; diversion of management time on issues related to
the transactions; reputational risks and the reaction of customers and counterparties to the
transactions; disruptions relating to the transactions negatively
impacting Capital One’s ability to maintain relationships with customers, employees and suppliers; changes
in asset quality and credit risk as a result of the transactions;
financial, legal, regulatory, tax or accounting changes or actions, including the impact of the Dodd-Frank Wall
Street Reform and Consumer Protection Act and the regulations promulgated
thereunder; developments, changes or actions relating to any litigation matter involving
Capital One; increases or decreases in interest rates; Capital One’s
ability to access the capital markets at attractive rates and terms to capitalize and fund its operations and
future growth; the success of Capital One’s marketing efforts in
attracting and retaining customers; increases or decreases in Capital One’s aggregate loan balances or the
number of customers and the growth rate and composition thereof,
including increases or decreases resulting from factors such as shifting product mix, amount of actual
marketing expenses Capital One incurs and attrition of loan balances; the
level of future repurchase or indemnification requests Capital One may receive, the actual future
performance of mortgage loans relating to such requests, the success
rates of claimants against Capital One, any developments in litigation and the actual recoveries Capital
One may make on any collateral relating to claims against Capital One;
the amount and rate of deposit growth; changes in the reputation of or expectations regarding the
financial services industry or Capital One with respect to practices,
products or financial condition; any significant disruption in Capital One’s operations or technology
platform; Capital One’s ability to maintain a compliance
infrastructure suitable for its size and complexity; Capital One’s ability to control costs; the amount of, and rate of
growth in, Capital One’s expenses as its business develops or
changes or as it expands into new market areas; Capital One’s ability to execute on its strategic and operational
plans; any significant disruption of, or loss of public confidence in,
the United States Mail service affecting Capital One’s response rates and consumer payments; Capital
One’s ability to recruit and retain experienced personnel to assist
in the management and operations of new products and services; changes in the labor and employment
markets; fraud or misconduct by Capital One’s customers, employees
or business partners; competition from providers of products and services that compete with Capital
One’s businesses; and other risk factors set forth from time to time
in reports that Capital One files with the Securities and Exchange Commission (the “SEC”), including,
but not limited to, the Annual Report on Form 10-K for the year ended
December 31, 2010, and Exhibit 99.5 to the Current Report on Form 8-K filed on July 13, 2011.
You should carefully consider the factors discussed above in evaluating
these forward-looking statements. All information in these slides is based on the consolidated results
of Capital One Financial Corporation, unless otherwise noted. A
reconciliation of any non-GAAP financial measures included in this presentation can be found in Capital
One’s most recent Current Report on Form 8-K filed October 20,
2011, available on Capital One’s website at www.capitalone.com under “Investors.”
|
| 3
October 20, 2011
•
Diluted EPS of $1.77, or $813M, compared to $1.97, or $911M, in Q2 2011
•
Ending loan balances increased $987M to $130B on growth in Auto Finance,
Commercial and Revolving Domestic Card balances
•
Net Interest Margin remained strong
•
Asset yields up 13 bps, largely due to credit benefits
•
Cost of funds down 6 bps
•
Pre-provision earnings increased as higher revenue was partially offset by increased
non-interest expense
•
Provision expense increased due to smaller allowance release, partially offset by
lower charge-offs
•
Charge-offs down 39 bps from 2.91% to 2.52%
•
Allowance coverage ratio down 19 bps from 3.48% to 3.29%
•
Capital generation remained strong
•
Basel 1 Tier 1 Common ratio of 10.0%; Basel 3 Tier 1 Common ratio ~10 bps higher
Third quarter 2011 highlights |
 4
October 20, 2011
Loan balances increased modestly and margin expanded in the third
quarter
Average Balances & Margin Highlights
Average
Yield/
Average
Yield/
(Dollars in millions)(unaudited)
Balance
Rate
Balance
Rate
Interest-earning assets:
Loans held for investment
129,043
$
11.00
%
127,916
$
10.53
%
Investment securities
37,189
2.84
40,381
3.10
Cash equivalents and other
11,478
0.73
5,846
1.30
Total interest-earning assets
177,710
$
8.63
%
174,143
$
8.50
%
Interest-bearing liabilities:
Total interest-bearing deposits
110,750
$
1.06
%
109,251
$
1.12
%
Securitized debt obligations
18,478
1.93
22,191
2.04
Senior and subordinated notes
10,519
3.19
8,093
3.11
Other borrowings
8,369
4.06
9,167
3.49
Total interest-bearing liabilities
148,116
$
1.49
%
148,702
$
1.51
%
Interest income to average interest-earning assets
8.63
%
8.50
%
Interest expense to average interest-earning assets
1.24
1.30
Net interest margin
7.39
%
7.20
%
Quarter Ended 09/30/11
Quarter Ended 06/30/11 |
 5
October 20, 2011
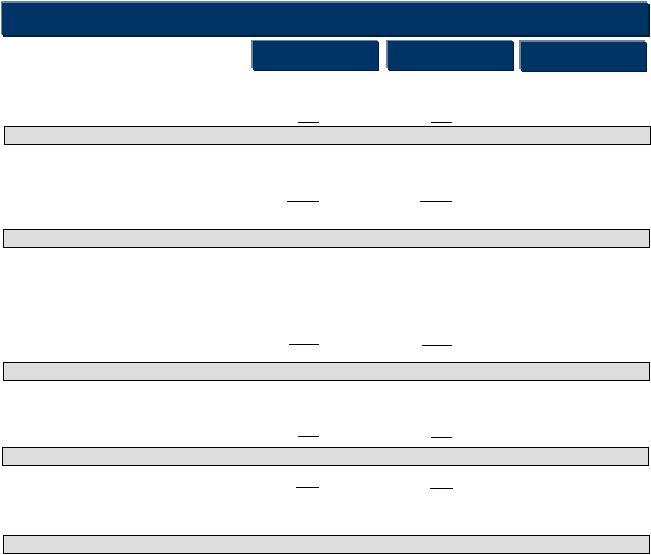
Third quarter 2011 earnings were $1.77 per share
Income Statement
Net interest income
Non-interest income
Revenue
Marketing expense
Operating expense
Pre-Provision Earnings (before tax)
Net charge-offs
Other
Allowance build (release)
Provision Expense
Discontinued operations, net of tax
Total company (after tax)
EPS
Tax expense
Pretax income
$MM
Operating Earnings (after tax)
Non-Interest Expense
3,283
871
4,154
312
1,985
2,297
1,857
812
18
(208)
622
813
865
(52)
$1.77
1,235
370
Q311
3,136
857
3,993
329
1,926
2,255
1,738
931
(9)
(579)
343
911
945
(34)
$1.97
1,395
450
Q211
5%
2%
4%
5%
(3)%
(2)%
7%
13%
400%
(64)%
(81)%
(11)%
(8)%
(53)%
(11)%
18%
(10)%
% Change |
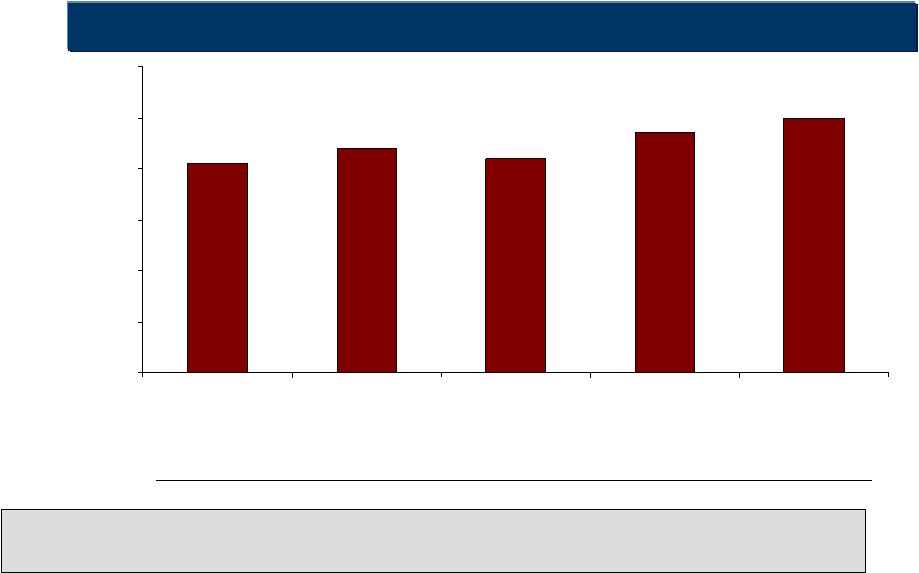 Our capacity to generate
capital remains strong Tier
1
Common
Equity
to
Risk-Weighted
Assets
(Basel
I)
1
8.2%
8.8%
8.4%
9.4%
10.0%
0%
2%
4%
6%
8%
10%
12%
Q310
Q410
Q111
Q211
Q311
Disallowed DTA
RWA
EOP Loans
(1.3)
(1.2)
125
127
126
126
(1.4)
142
124
Tier 1 Common excluding
disallowed DTA
($B)
11.5
12.4
13.4
Tier 1 Common
10.2
11.2
12.0
(0.6)
146
129
14.3
13.7
(0.2)
149
130
15.1
14.9
2
2
1
October 20, 2011
Tier 1 Common ratio is a non-GAAP measure calculated based on Tier 1 common equity divided by
risk-weighted assets. See "Exhibit 99.2—Table 12: Reconciliation of
Non-GAAP Measures and Calculation of Regulatory Capital Measures" for the calculation of this ratio.
Tier 1 Common ratio as of the quarter end does not reflect any impact from the equity forward sale
agreements executed in July 2011 which have not been settled in whole or in part.
6 |
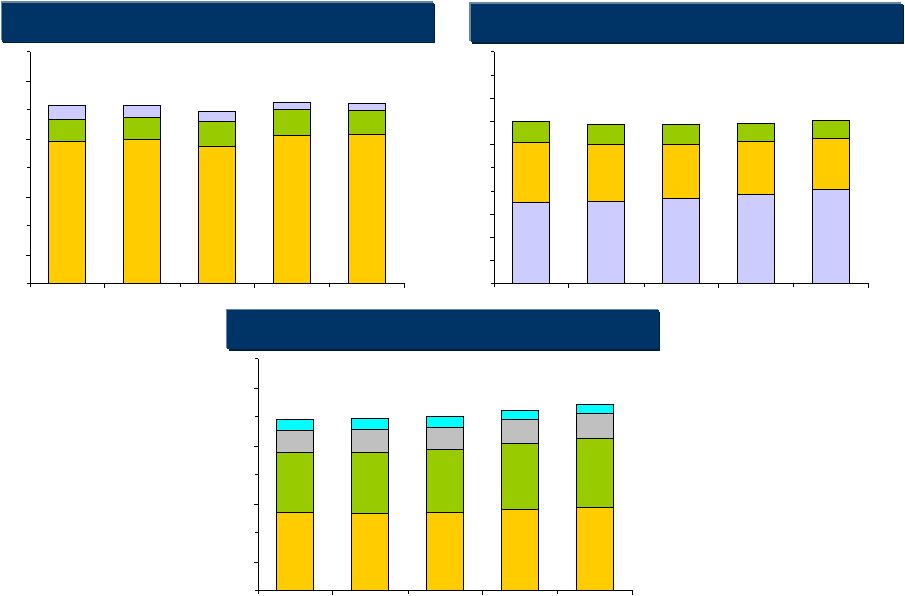 October 20, 2011
Growth in Auto Finance, Commercial Banking and Revolving Domestic
Card resulted in higher ending loan balances in the third quarter
Credit Card (EOP)
13,475
13,396
13,543
14,035
14,389
10,364
10,484
10,758
11,404
11,924
3,813
4,020
3,936
4,122
4,221
1,890
1,842
1,780
1,642
1,571
0
5
10
15
20
25
30
35
40
Q310
Q410
Q111
Q211
Q311
Commercial Banking
Consumer Banking
Comm’l
& Multi-Family
Middle Market
49,291
49,970
47,298
51,234
51,510
7,487
7,522
8,735
8,711
8,210
4,548
3,879
3,272
2,760
2,310
0
10
20
30
40
50
60
70
80
Q310
Q410
Q111
Q211
Q311
Revolving
Domestic Card
International
17643
17867
18342
19223
20422
12,763
12,103
11,741
11,323
10,916
4,591
4,413
4,223
4,046
4,014
0
5
10
15
20
25
30
35
40
45
50
Q310
Q410
Q111
Q211
Q311
Home Loans
Retail
Banking
Auto
Specialty Lending
Small Ticket CRE
$M
$M
$M
Installment
loans
7 |
 8
October 20, 2011
Consumer credit is stabilizing exhibiting expected seasonal patterns
3.92%
8.23%
4.74%
6.20%
7.28%
3.65%
3.33%
3.59%
4.53%
4.09%
0%
1%
2%
3%
4%
5%
6%
7%
8%
9%
10%
11%
Q310
Q410
Q111
Q211
Q311
Domestic Credit Card ($53.7B*)
Net Charge-off Rate
30+ Day Delinquency Rate
Home Loan ($11.1B*)
0.71%
0.41%
0.60%
0.89%
0.53%
0.61%
0.70%
0.64%
0.69%
0.78%
0%
1%
2%
3%
Q310
Q410
Q111
Q211
Q311
Auto ($19.8B*)
6.68%
5.74%
7.02%
7.60%
6.15%
5.75%
5.84%
5.55%
5.30%
5.35%
0%
1%
2%
3%
4%
5%
6%
7%
8%
9%
10%
Q310
Q410
Q111
Q211
Q311
International Credit Card ($8.7B*)
1.69%
2.65%
1.11%
2.71%
1.98%
6.34%
7.42%
7.58%
6.09%
5.79%
0%
1%
2%
3%
4%
5%
6%
7%
8%
9%
10%
11%
Q310
Q410
Q111
Q211
Q311
Net Charge-off Rate
30+ Day Delinquency Rate
Net Charge-off Rate
30+ Day Performing
Delinquency Rate
Net Charge-off Rate
30+ Day Performing
Delinquency Rate
* Average Loans |
 9
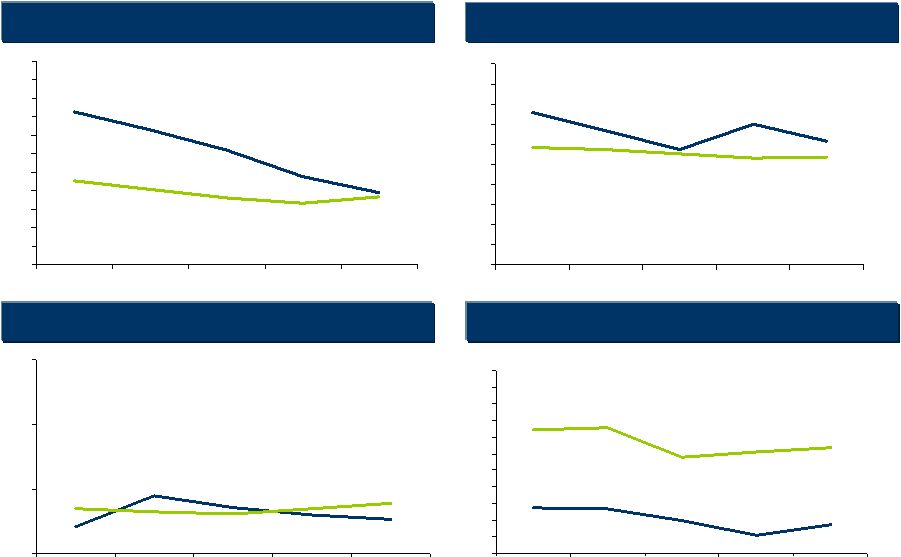
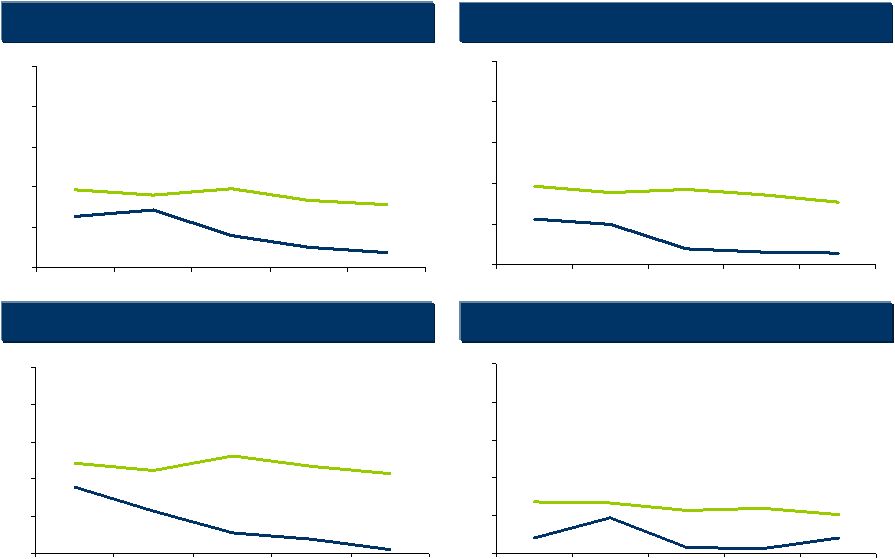
October 20, 2011
Commercial Banking credit metrics have stabilized and improved
modestly over the last five quarters
1.43%
0.79%
0.50%
1.27%
0.37%
1.80%
1.94%
1.95%
1.66%
1.55%
0%
1%
2%
3%
4%
5%
Q310
Q410
Q111
Q211
Q311
Total Commercial Banking ($31.3B*)
Nonperforming
Asset Rate
Charge-off
Rate
Commercial & Multi-Family Real Estate ($14.0B*)
0.12%
1.15%
0.39%
1.78%
0.56%
2.16%
2.42%
2.23%
2.35%
2.63%
0%
1%
2%
3%
4%
5%
Q310
Q410
Q111
Q211
Q311
Middle Market ($11.6B*)
Nonperforming
Asset Rate
Charge-off
Rate
1.00%
0.38%
0.30%
1.11%
0.28%
1.76%
1.94%
1.86%
1.71%
1.54%
0%
1%
2%
3%
4%
5%
Q310
Q410
Q111
Q211
Q311
Total Commercial Lending
Excluding Small Ticket CRE ($29.7B*)
Nonperforming
Asset Rate
Charge-off
Rate
0.41%
0.94%
0.13%
0.43%
0.18%
1.04%
1.38%
1.33%
1.19%
1.14%
0%
1%
2%
3%
4%
5%
Q310
Q410
Q111
Q211
Q311
Nonperforming
Asset Rate
Charge-off
Rate
* Average Loans |
 10
October 20, 2011
We are in a strong position to deliver significant value to customers
and shareholders
Sustainable
economic
advantages
Positioned at
the forefront
of where
banking is
going
End-game
positions
with relevant
scale
Large and
loyal
customer
franchise
Advantaged
access to
both sides of
the balance
sheet
•
Growth potential (off a larger base)
•
Strong returns and capital generation
•
Strong balance sheet and financial resilience
•
National
consumer
assets
•
National brand
•
Digital
leadership and
scale
•
Local banking
in attractive
markets
•
Credit risk
underwriting
•
Direct/digital
distribution |
 |